Upgrade to Pro — share decks privately, control downloads, hide ads and more …

Building a clustering tree

Luke Zappia
August 18, 2017

Building a clustering tree

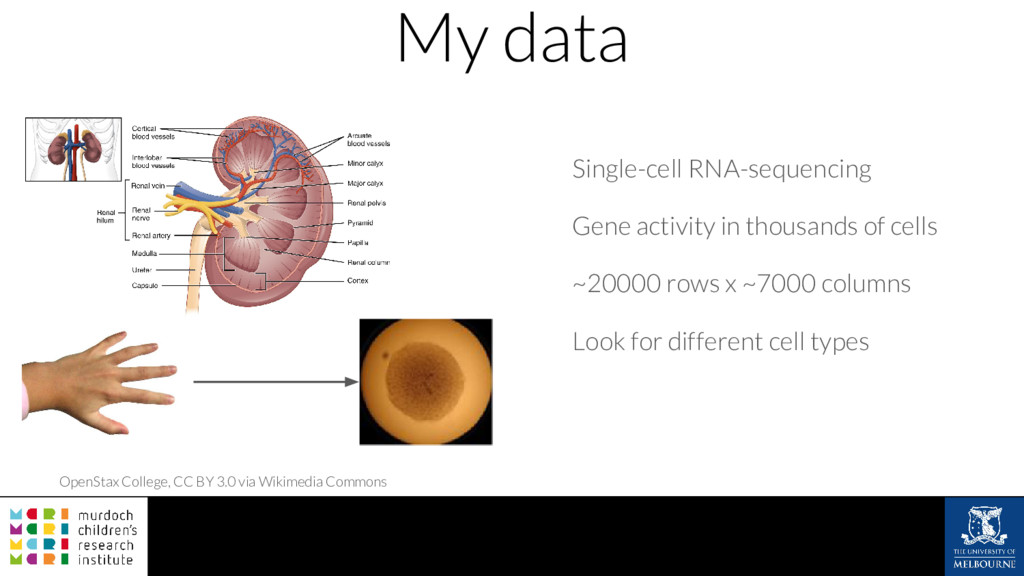
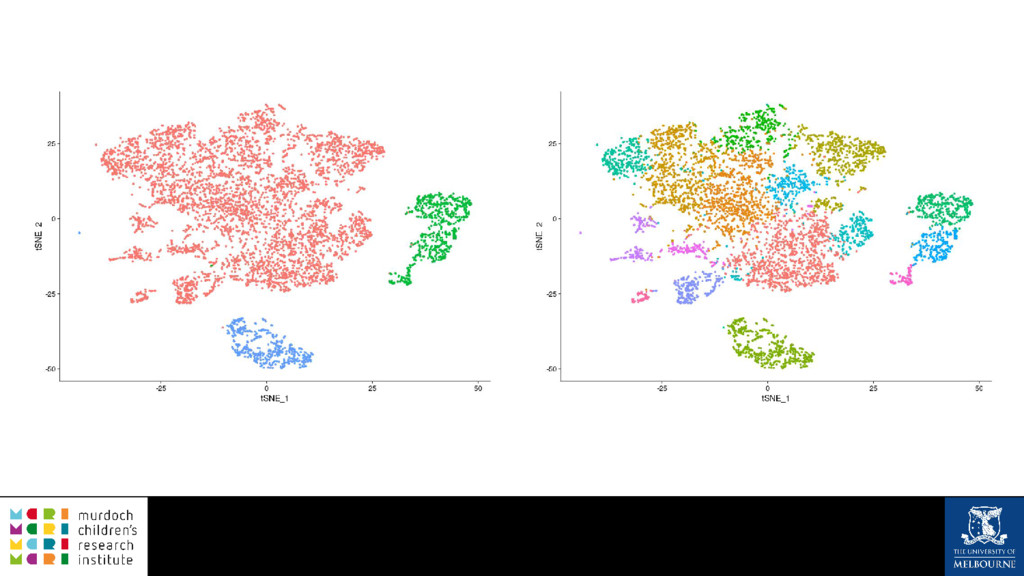
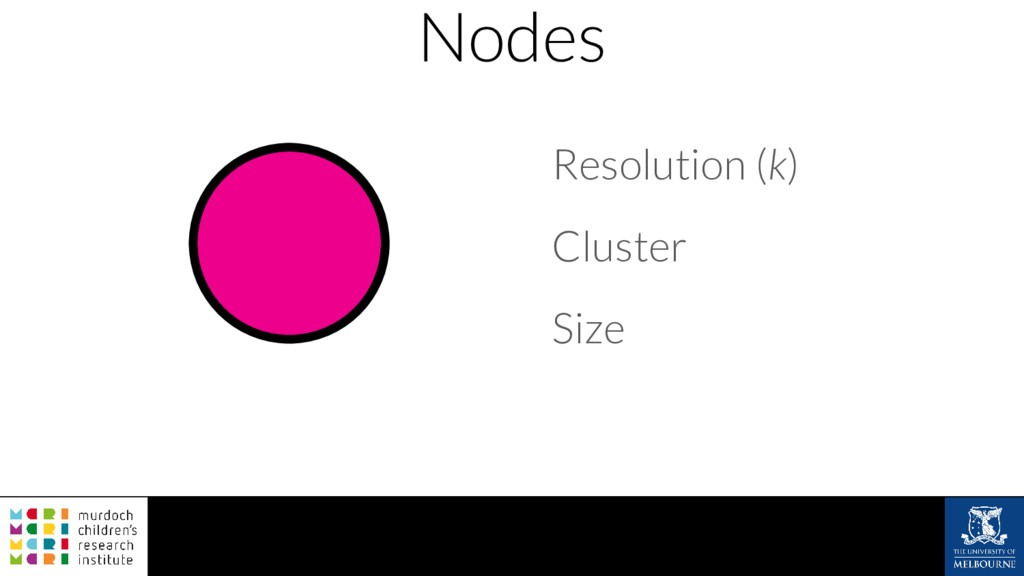
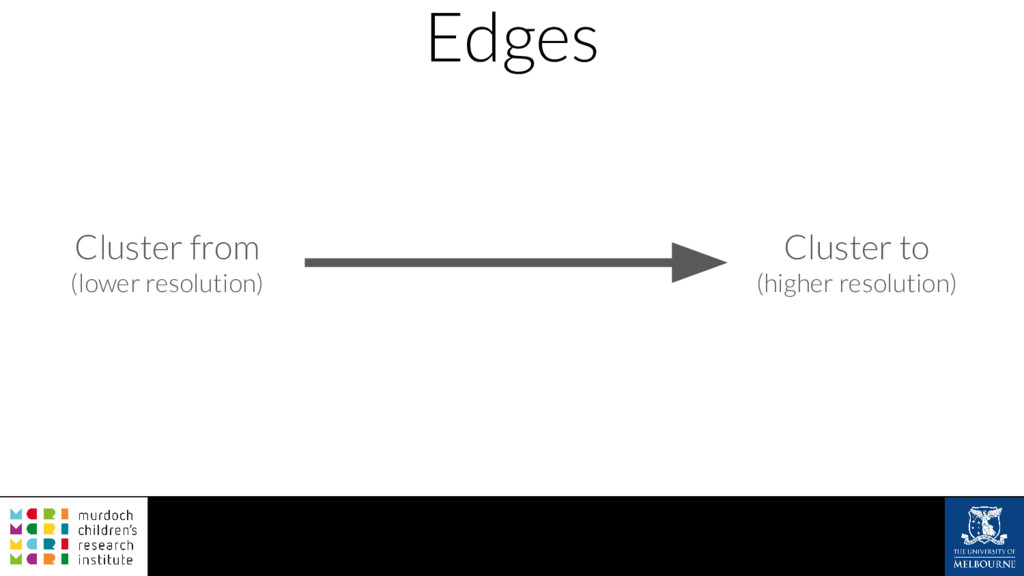
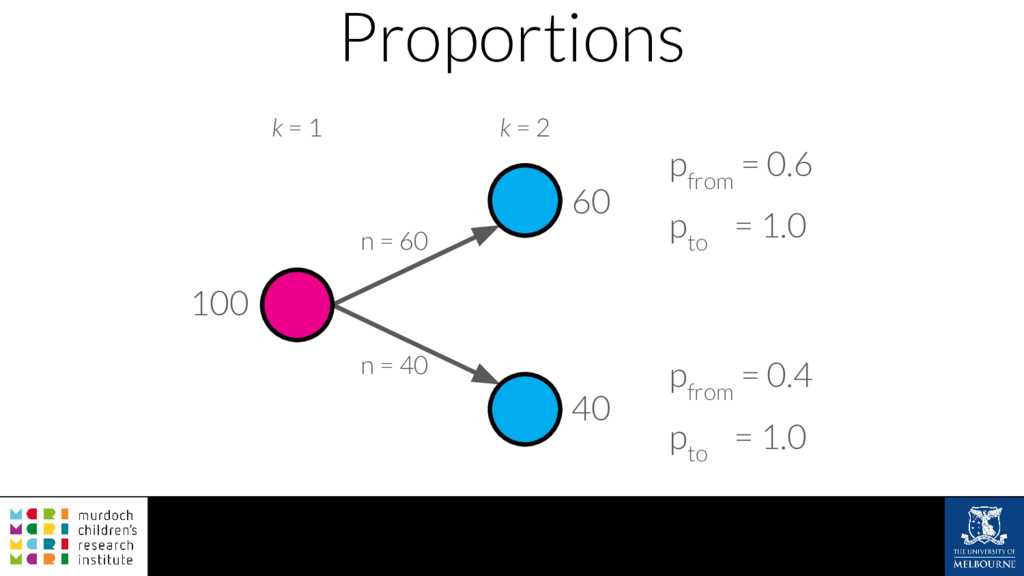
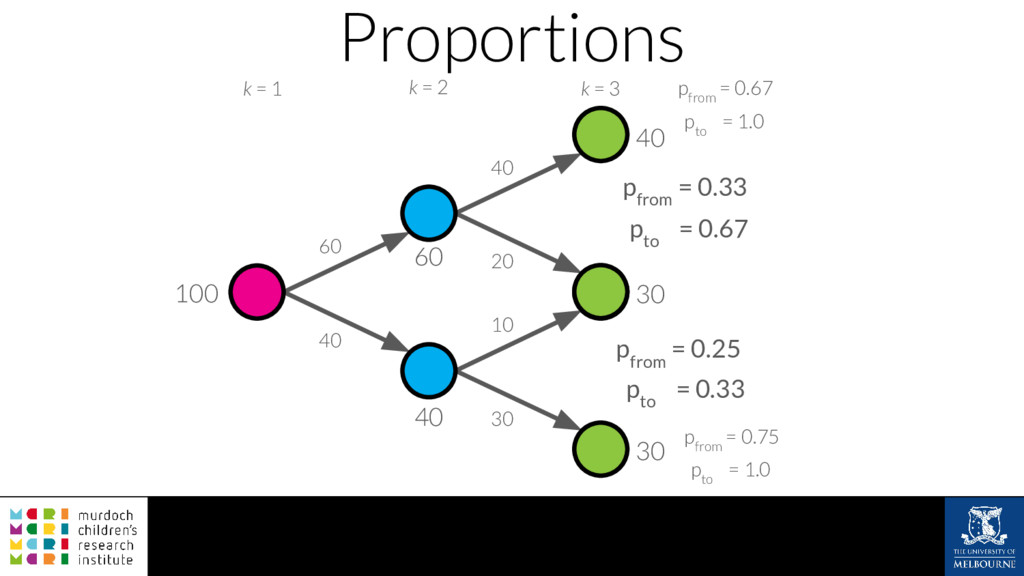
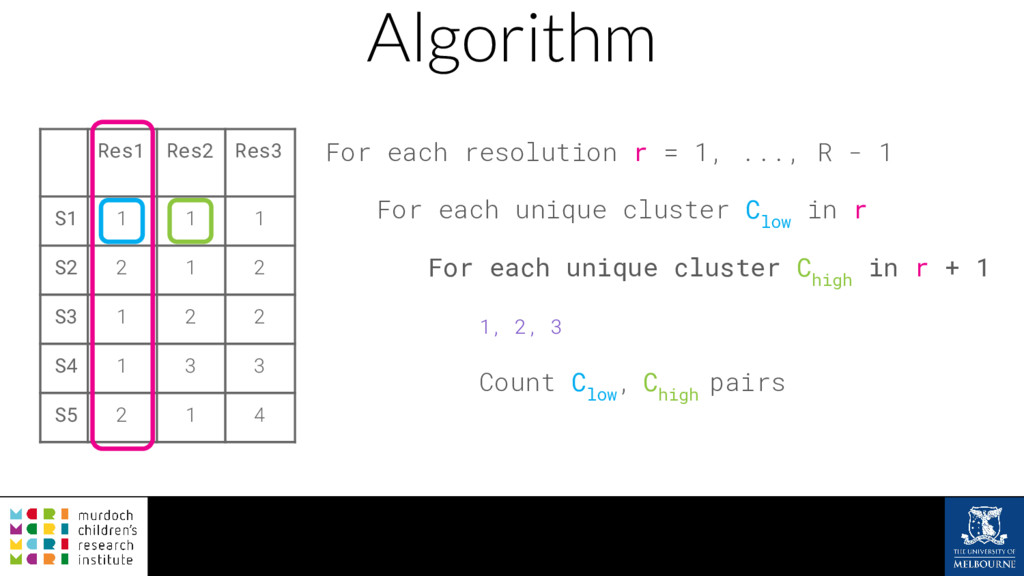
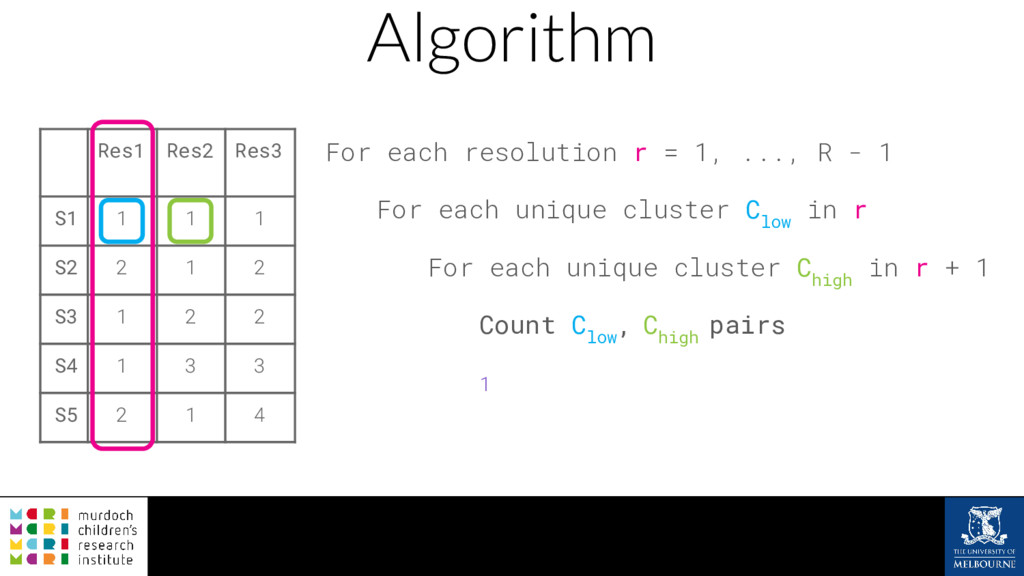
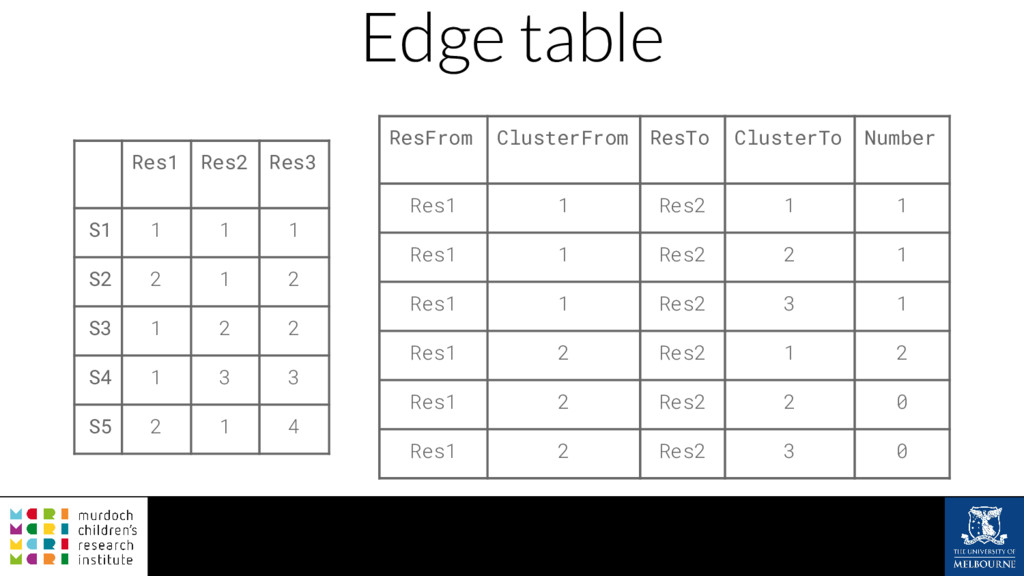
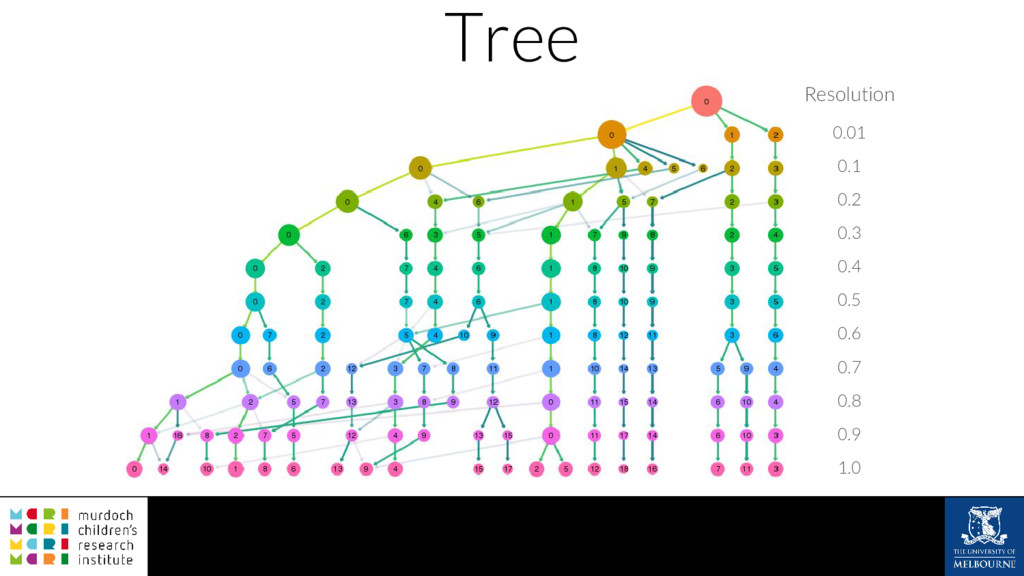
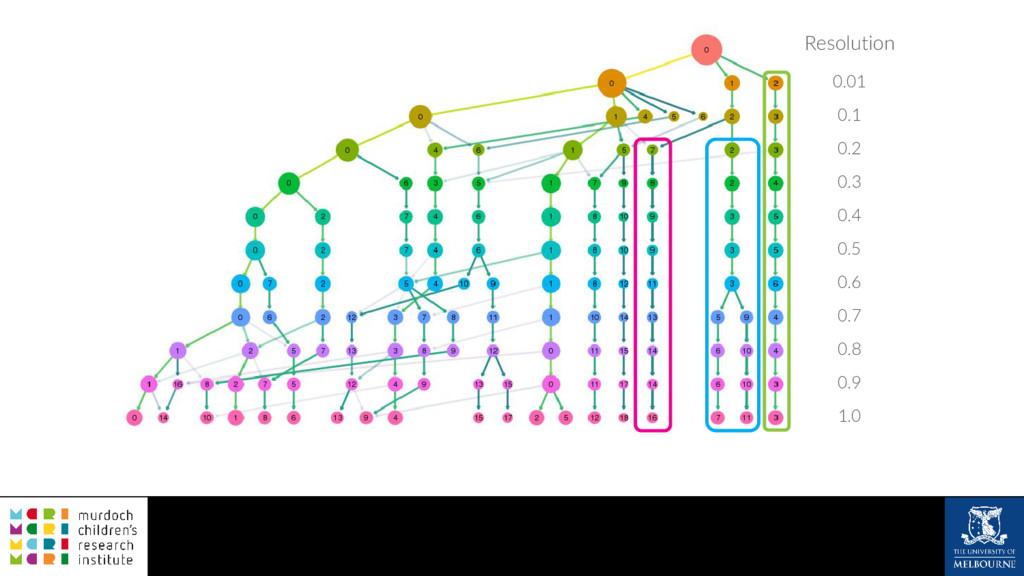
A common task in many fields is to group objects or samples based on their characteristics such that objects in one group are more similar to each other than to objects in other groups. This unsupervised process is known as clustering. Many clustering algorithms exist but all of them require some sort of user input to decide how many groups to produce. For example k-means clustering requires a value for k, the number of clusters, and graph-based clustering methods can include a resolution parameter. How do we know what the correct number of clusters is and what are the relationships between clusters at different resolutions? I will show how to construct a clustering tree to help answer these questions. While I will use a single-cell RNA sequencing dataset as an example this approach could be used for any discipline or clustering method. A clustering tree combines information from multiple clusterings with different resolutions and shows the relationships between them. This visualisation can be used to see which clusters are distinct, where new clusters come from and how many samples change clusters as the number of clusters increases. Building a clustering tree provides an alternative way of looking at clusterings, giving extra insight into the clustering process and helping to determine the correct number of clusters to use in further analysis.

Luke Zappia

August 18, 2017
Tweet

More Decks by Luke Zappia

Other Decks in Science

Transcript

  1. My data OpenStax College, CC BY 3.0 via Wikimedia Commons

    Single-cell RNA-sequencing Gene activity in thousands of cells ~20000 rows x ~7000 columns Look for different cell types
  2. Proportions 100 60 40 k = 1 k = 2

    p from = n / size low n = 60 n = 40 p to = n / size high
  3. Proportions 100 60 40 k = 1 k = 2

    p from = 0.6 n = 60 n = 40 p to = 1.0 p from = 0.4 p to = 1.0
  4. Proportions 100 60 40 k = 1 k = 2

    p from = 0.67 60 40 p to = 1.0 40 30 40 20 30 10 30 k = 3 p from = 0.33 p to = 0.67 p from = 0.25 p to = 0.33 p from = 0.75 p to = 1.0
  5. Algorithm For each resolution r = 1, ..., R -

    1 For each unique cluster C low in r For each unique cluster C high in r + 1 Count C low , C high pairs Res1 Res2 Res3 S1 1 1 1 S2 2 1 2 S3 1 2 2 S4 1 3 3 S5 2 1 4
  6. Algorithm For each resolution r = 1, ..., R -

    1 Res1, Res2 For each unique cluster C low in r For each unique cluster C high in r + 1 Count C low , C high pairs Res1 Res2 Res3 S1 1 1 1 S2 2 1 2 S3 1 2 2 S4 1 3 3 S5 2 1 4
  7. Algorithm For each resolution r = 1, ..., R -

    1 For each unique cluster C low in r 1, 2 For each unique cluster C high in r + 1 Count C low , C high pairs Res1 Res2 Res3 S1 1 1 1 S2 2 1 2 S3 1 2 2 S4 1 3 3 S5 2 1 4
  8. Algorithm For each resolution r = 1, ..., R -

    1 For each unique cluster C low in r For each unique cluster C high in r + 1 1, 2, 3 Count C low , C high pairs Res1 Res2 Res3 S1 1 1 1 S2 2 1 2 S3 1 2 2 S4 1 3 3 S5 2 1 4
  9. Algorithm For each resolution r = 1, ..., R -

    1 For each unique cluster C low in r For each unique cluster C high in r + 1 Count C low , C high pairs 1 Res1 Res2 Res3 S1 1 1 1 S2 2 1 2 S3 1 2 2 S4 1 3 3 S5 2 1 4
  10. Edge table Res1 Res2 Res3 S1 1 1 1 S2

    2 1 2 S3 1 2 2 S4 1 3 3 S5 2 1 4 ResFrom ClusterFrom ResTo ClusterTo Number Res1 1 Res2 1 1 Res1 1 Res2 2 1 Res1 1 Res2 3 1 Res1 2 Res2 1 2 Res1 2 Res2 2 0 Res1 2 Res2 3 0
  11. Summary Choosing the number of clusters is hard but important

    A clustering tree can help by showing: - Relationships between clusters - Which clusters are distinct - Where samples are changing
  12. Acknowledgements Everyone that makes tools and data available Supervisors Alicia

    Oshlack Melissa Little MCRI Bioinformatics Belinda Phipson MCRI KDDR Alex Combes @_lazappi_ oshlacklab.com R Tutorial lazappi.id.au/building-a-clustering-tree/ Slides speakerdeck.com/lazappi/building-a-clustering-tree