literature in fields related to the fundamental principles of this project; keywords include: GIS, crowd-sourcing, mobile applications, walking, cluster analysis and custom cartography. • Review the information types and technology applicable to the participation in walking. • Build a database of walking routes that appends data from various sources to the routes. This helps to contextualize and characterize the routes, and provides a foundation for the classification and typology of walking routes.
analysis to build a GIS-based typology of walking routes. • Learn more about the behaviour of walkers by completing a survey of a relevant population; in this case the Walkingworld community. • Use the knowledge gained from the survey to validate research decisions made in producing the typology • Use the knowledge gained from the survey to inform the design and implementation of a mobile application. • Future work includes the testing and evaluation of mobile application in lab and field tests, and the development of bespoke walking cartography.
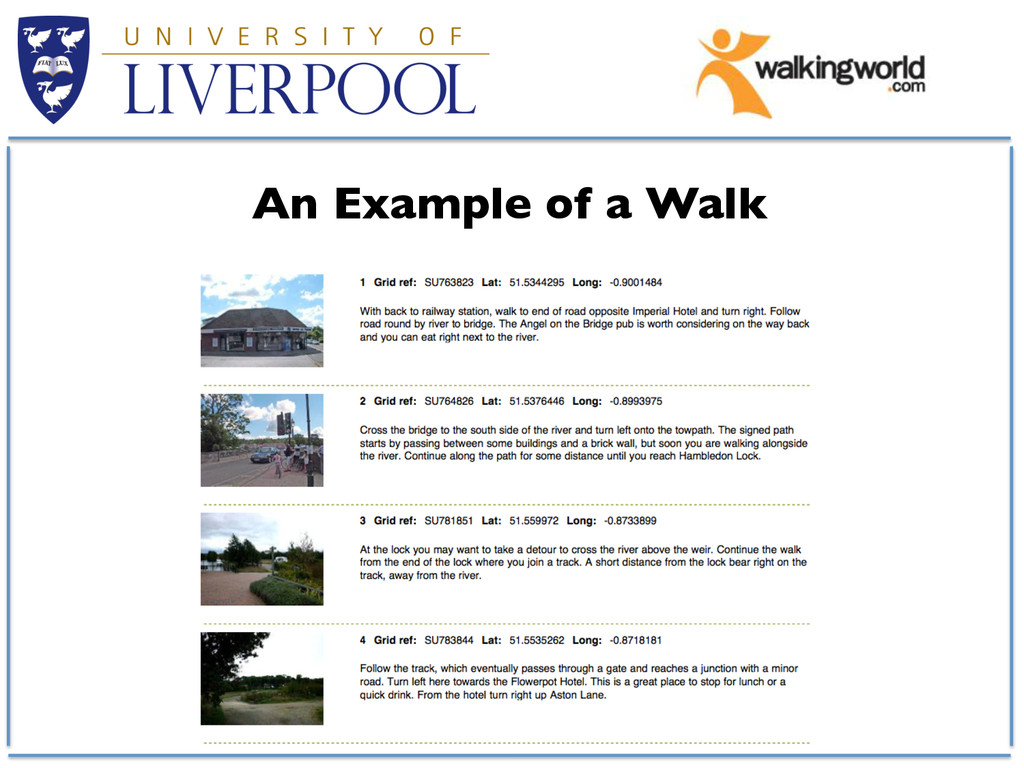
walking enthusiasts. • Over 6000 walks to view and download, download is only possible with a subscription. • Possible for new members to submit walks as well as download them. • The newly submitted routes are then moderated and a small royalty is paid to the submitter. • This is a very early example of a crowd sourced data model, with a slightly different business model to similar projects in the area. • Walks consist of a series of waypoints or walk nodes. Each walk is required to have a photo, description, grid reference square and geolocation.
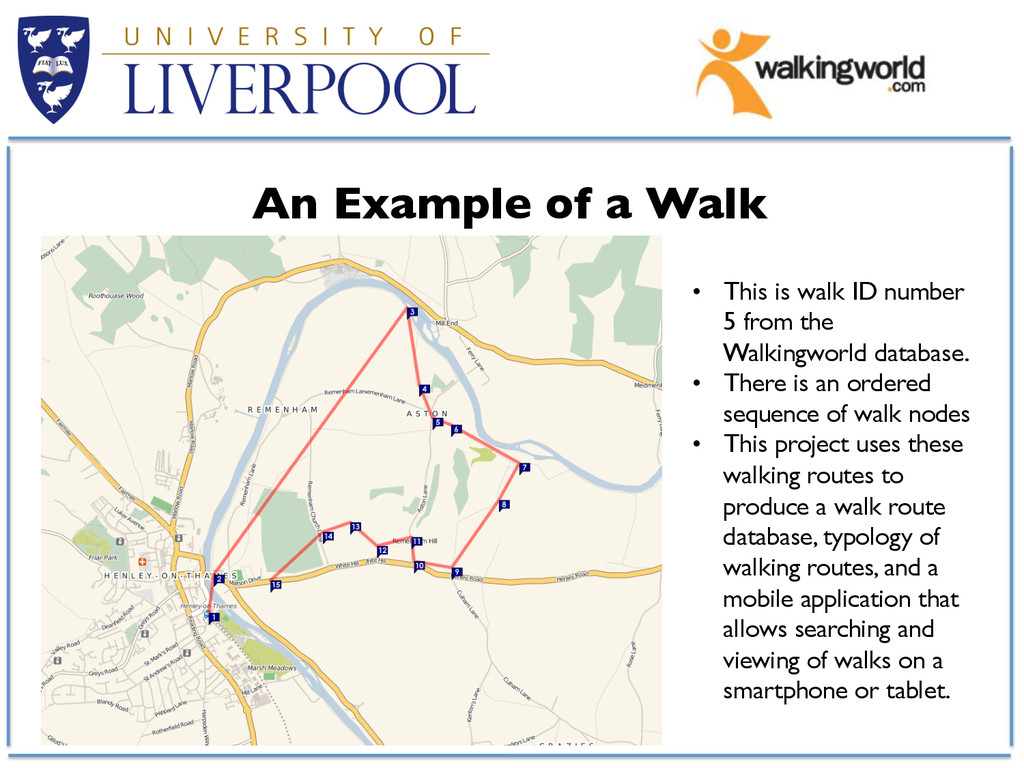
number 5 from the Walkingworld database. • There is an ordered sequence of walk nodes • This project uses these walking routes to produce a walk route database, typology of walking routes, and a mobile application that allows searching and viewing of walks on a smartphone or tablet.
walk point Open Data • In National Park/Green Belt/Area of Outstanding Natural Beauty? • Urban/Rural Classification • Population Density of Surrounding Area • Altitude of walk point Derived Data • Distance to public transport • Distance to nearest pubs • Distance to coast • “Average Scenic Rating” WALKING ROUTE DATABASE • Distance to nearest water • Geology of underlying rock
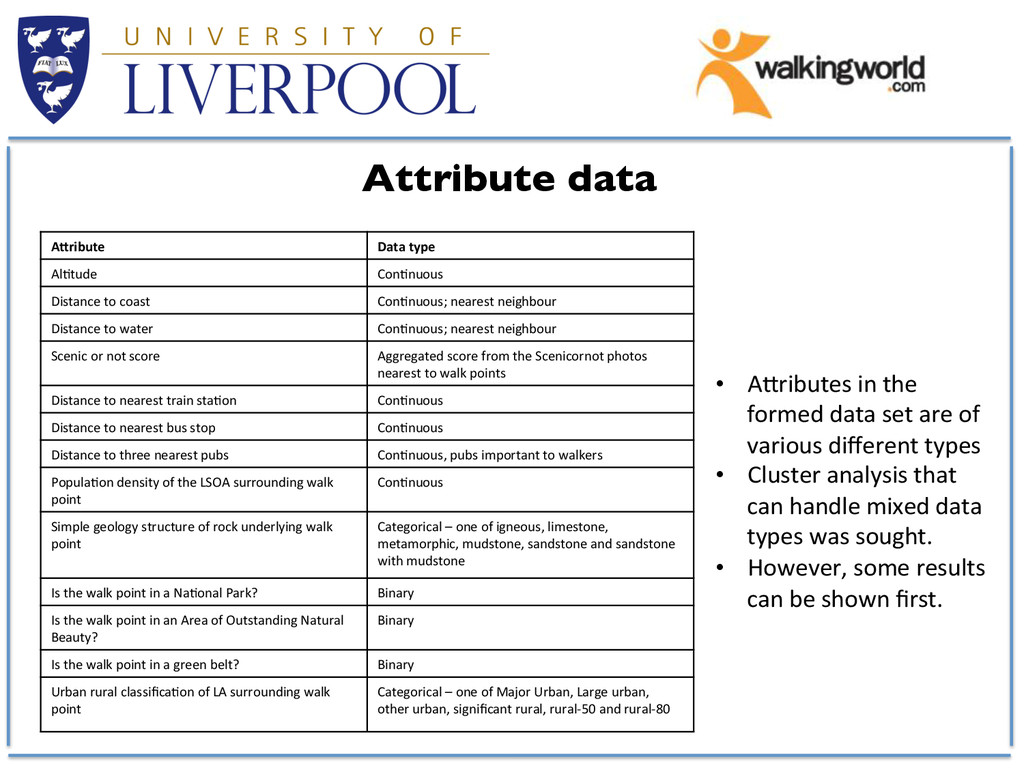
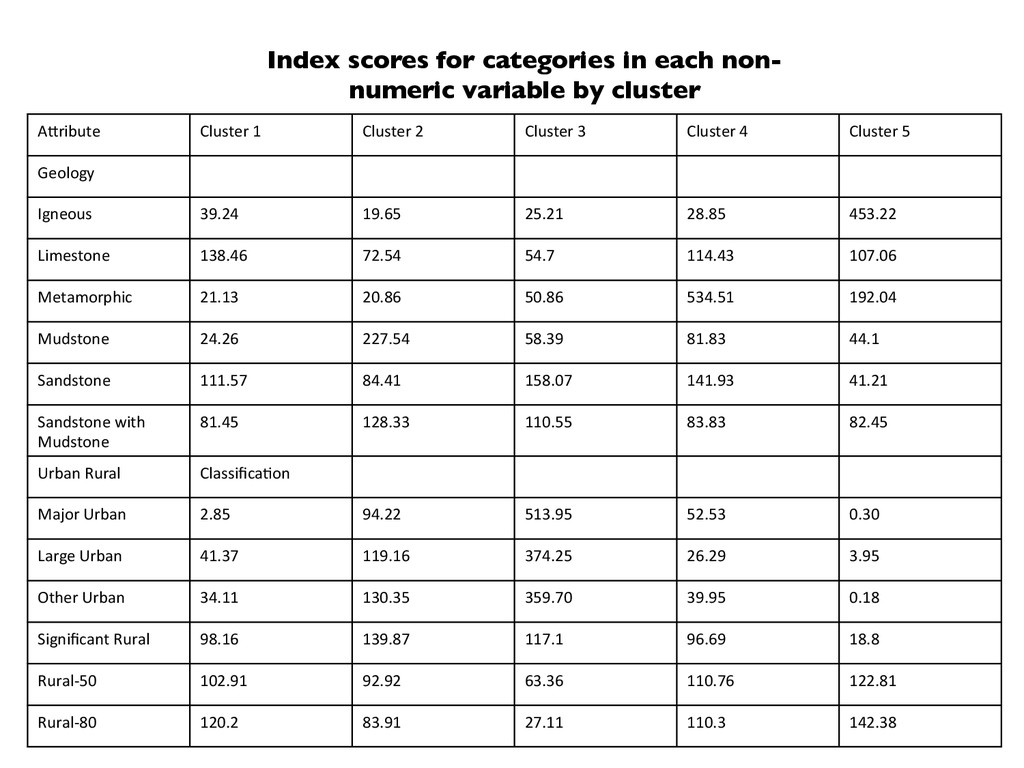
Distance to coast ConDnuous; nearest neighbour Distance to water ConDnuous; nearest neighbour Scenic or not score Aggregated score from the Scenicornot photos nearest to walk points Distance to nearest train staDon ConDnuous Distance to nearest bus stop ConDnuous Distance to three nearest pubs ConDnuous, pubs important to walkers PopulaDon density of the LSOA surrounding walk point ConDnuous Simple geology structure of rock underlying walk point Categorical – one of igneous, limestone, metamorphic, mudstone, sandstone and sandstone with mudstone Is the walk point in a NaDonal Park? Binary Is the walk point in an Area of Outstanding Natural Beauty? Binary Is the walk point in a green belt? Binary Urban rural classificaDon of LA surrounding walk point Categorical – one of Major Urban, Large urban, other urban, significant rural, rural-‐50 and rural-‐80 • AUributes in the formed data set are of various different types • Cluster analysis that can handle mixed data types was sought. • However, some results can be shown first.
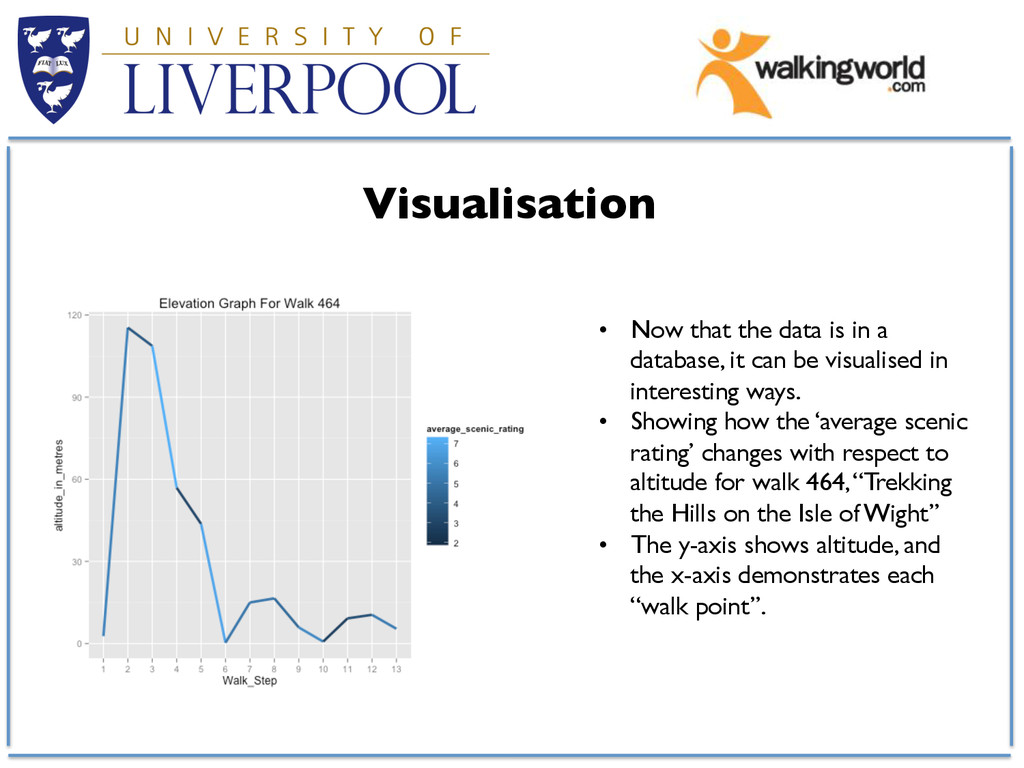
it can be visualised in interesting ways. • Showing how the ‘average scenic rating’ changes with respect to altitude for walk 464, “Trekking the Hills on the Isle of Wight” • The y-axis shows altitude, and the x-axis demonstrates each “walk point”.
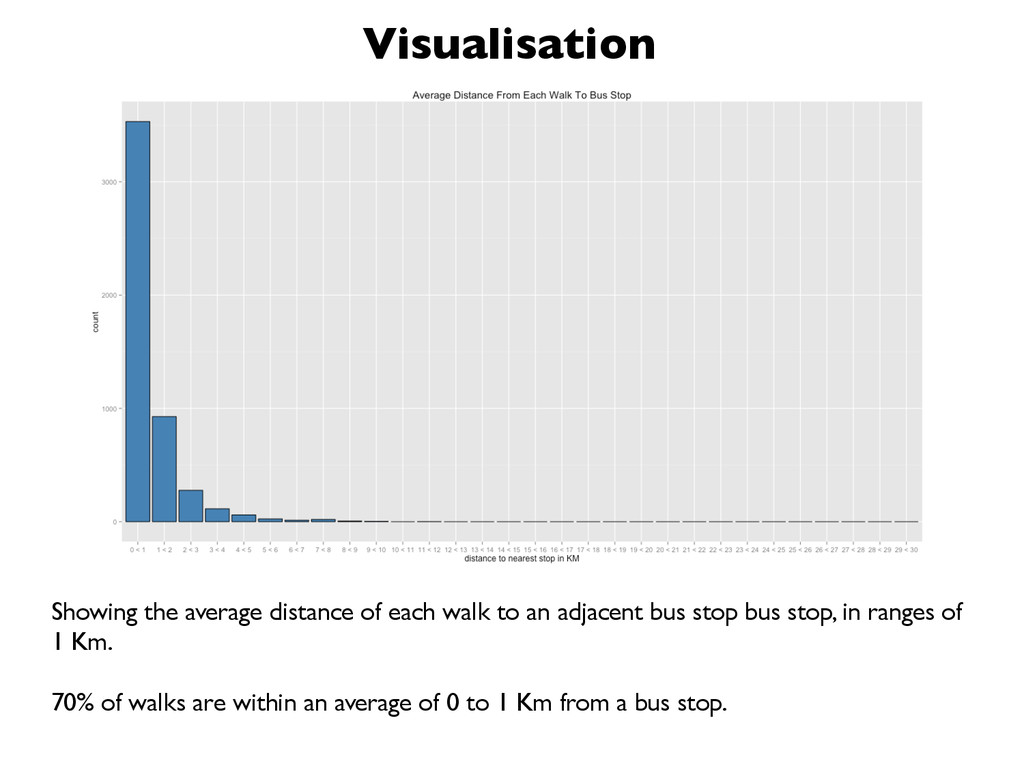
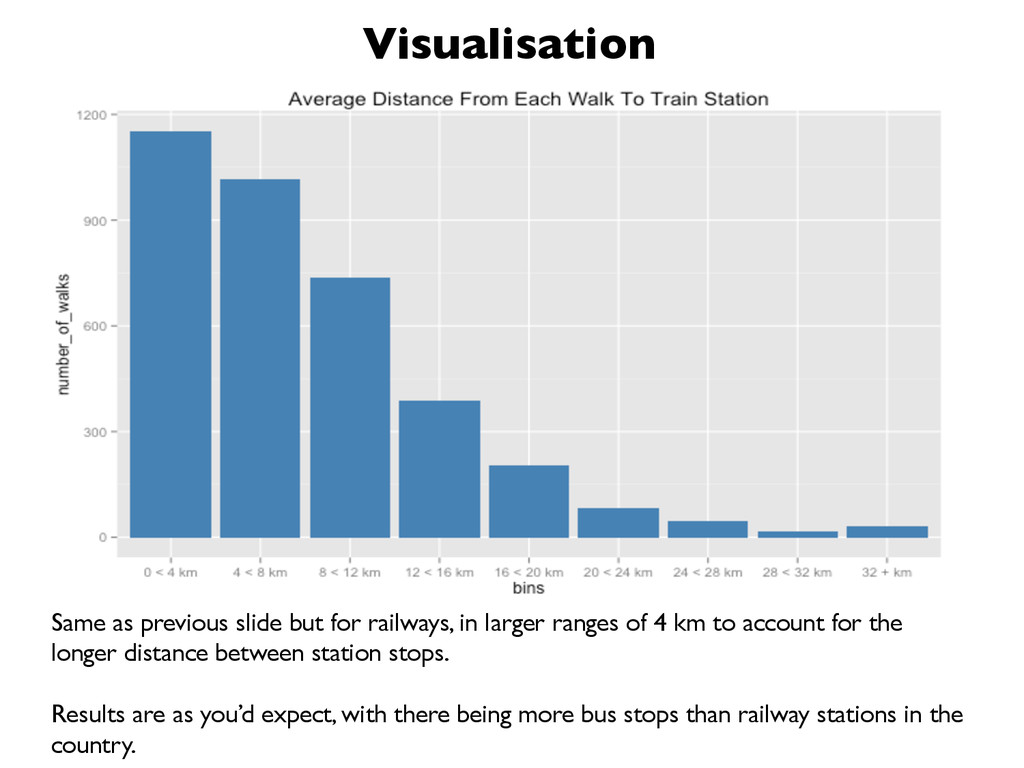
ranges of 4 km to account for the longer distance between station stops. Results are as you’d expect, with there being more bus stops than railway stations in the country.
database. • The ‘k-means’ algorithm could not be used for this data set as it contained categorical variables (one example being the “Is in National Park/Green Belt/ Area of Outstanding Natural Beauty” variables). • The ‘EM Algorithm’ was used instead of k-means, as it can handle both continuous and categorical variables and gives each variable individual treatment by assigning an appropriate statistical distribution to it, finding the likelihood function (the Expectation part in the ‘E’) and then maximizing the likelihood of the each distribution (the Maximization part), to be inputted as part of an overall distribution for the entire data set, using ‘missing’ or unobserved data to form clusters.
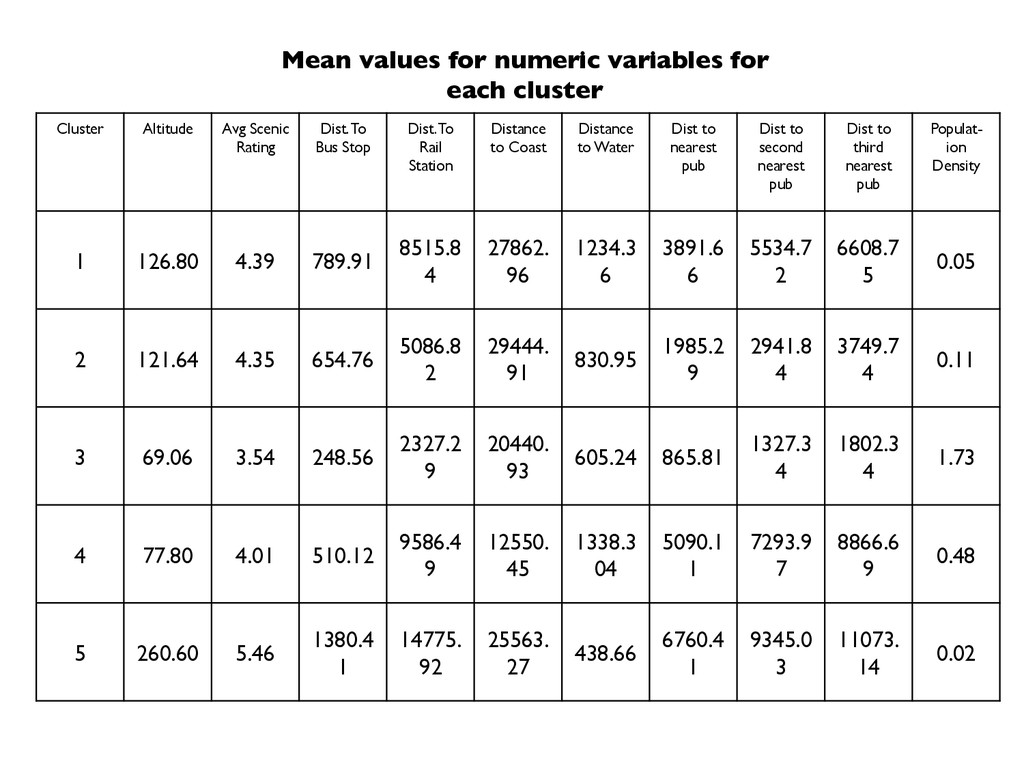
found to be 8. However, the size of the clusters (i.e. the amount of points in each cluster) was much more evenly spread for value k=5, and this also had a very high BIC value. • For the benefit of aesthetics, choosing appropriate names for 5 clusters of walking routes was more sensible than 8, as many of the walks will have similar attributes. • Each route is made up of several walk points, and it is the walk points that were classified. An important point here is that it is not the routes themselves that were classified, and so routes may have some points in one cluster and other points in other clusters. • This is not necessarily a bad thing: a walk may start near to the coast and end up atop a cliff in a National Park; and so more than one classification for an entire route would make sense.
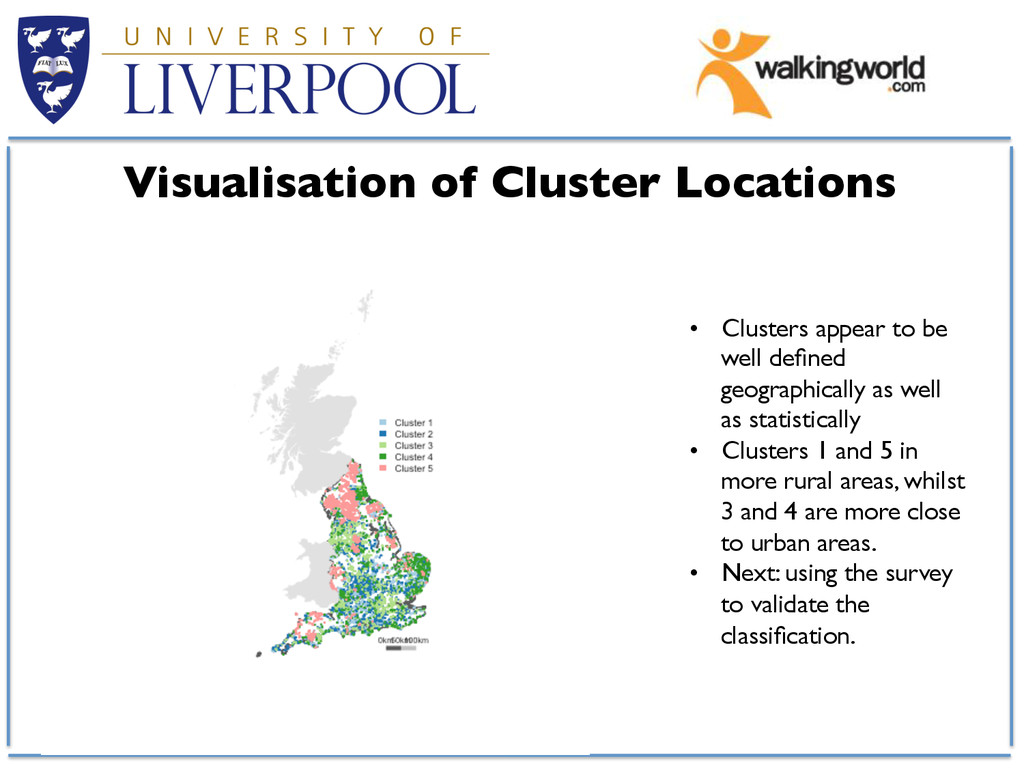
defined geographically as well as statistically • Clusters 1 and 5 in more rural areas, whilst 3 and 4 are more close to urban areas. • Next: using the survey to validate the classification.
research project explored the validity of the classificaDon through an illustraDve case study. • Specifically, this involved a survey that was sent out to every Walkingworld member via its monthly newsleUer. • 22 quesDons were asked, and there was a total of 237 complete responses. Given that there is an (esDmated) 65,000 members, to find results that were within +/-‐10% of the populaDon mean at the 95% confidence level, a total of 96 respondents would be required. To gain more accuracy (within +/-‐5%), a total of 382 respondents would be required. Thus, in the context of this research, 237 is a reasonable rate of response. • The survey included quesDons about the type of routes that the users were typically interested in.
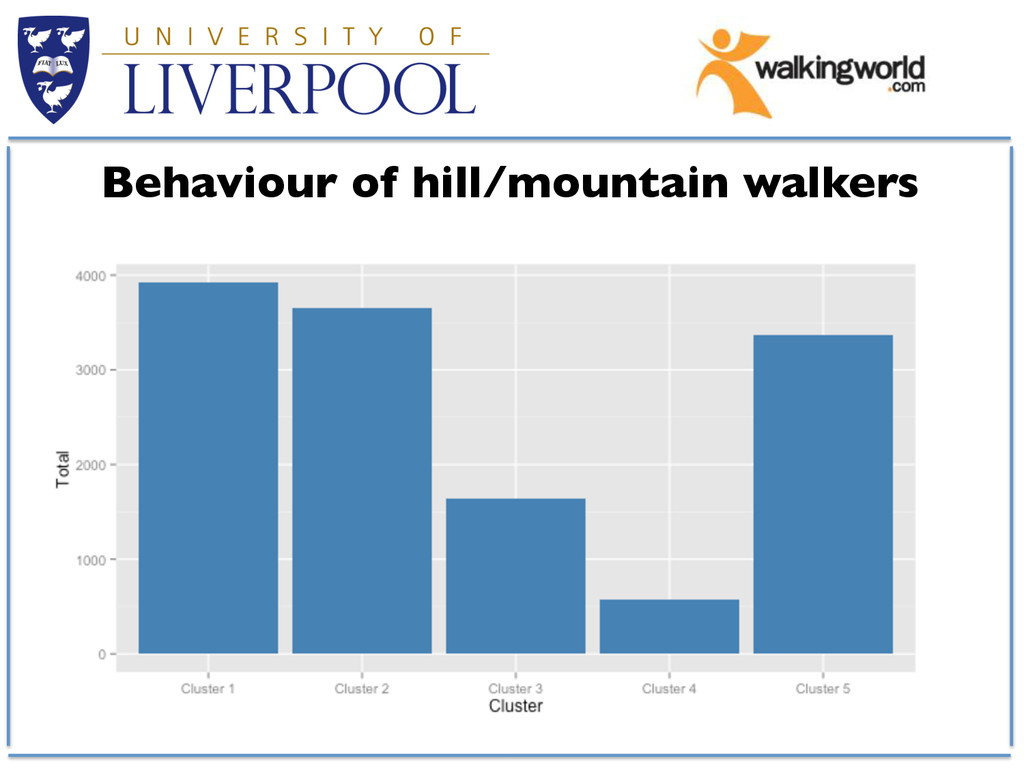
either: • Liked to walk serious mountain challenges occasionally (i.e., any posiDve response to the quesDon: ‘Do you like to walk mountain challenges?’) • Or liked to walk hills/moors/fells regularly (i.e., at least twice a month) • Were then cross-‐tabulated against the walking route classificaDon. • The Walkingworld server provided all of the id’s of walks that survey respondents had viewed in full, downloaded as a PDF, or downloaded as a GPX file. • Of the 99 respondents who fell into the ‘hill-‐walkers’ category, 33 route download profiles were found. • Although Cluster 2 has more views/downloads than Cluster 5 here, this may be because one parDcular walker has skewed the results: in fact, one user made 912 views or downloads of Cluster 2. If this walker is ignored, Clusters 5 and 1 have the most views and downloads. These clusters contain walks that are highest in alDtude, average scenic raDng, and distance to the coast.
views/downloads than Cluster 5 here, this may be because one parDcular walker has skewed the results: in fact, one user made 912 views or downloads of Cluster 2. If this walker is ignored, Clusters 5 and 1 have the most views and downloads. • These clusters contain walks that are highest in alDtude, average scenic raDng, and distance to the coast, which correspond to hilly areas.
been created using data appended to routes. This gives the walking routes a rich, multidimensional characterization. • This classification may be of use to various stakeholders, especially individuals searching for a walk. • An illustrative case study was completed using a survey of the Walkingworld community • This case study helps to validate the classification and its use to potential stakeholders. • A mobile application that allows users to search for, download and view a walk on a map is in production, and this application will make use of the classification produced in this research project.
-- Walks in Areas of Outstanding Natural Beauty • Cluster 2: Into the Wild -- Walks in remote areas • Cluster 3: Lowland, Coastal, Urban -- Walks close to urban areas • Cluster 4: Urban Meadows -- Walks in and around green belt areas • Cluster 5: Lofty Heights -- Trekking the beautiful hills in and around National Parks