objectives of the task, sample data to work from and the tools to write and test. The meaty part of this presentation is with methodologies, where I’ll go over the different implementation methods and how I produced a working tool. Then, I’ll go over other features I added to the tool and further developments. Finally, I’ll wrap everything up by passing along key knowledge gained with this project. 2
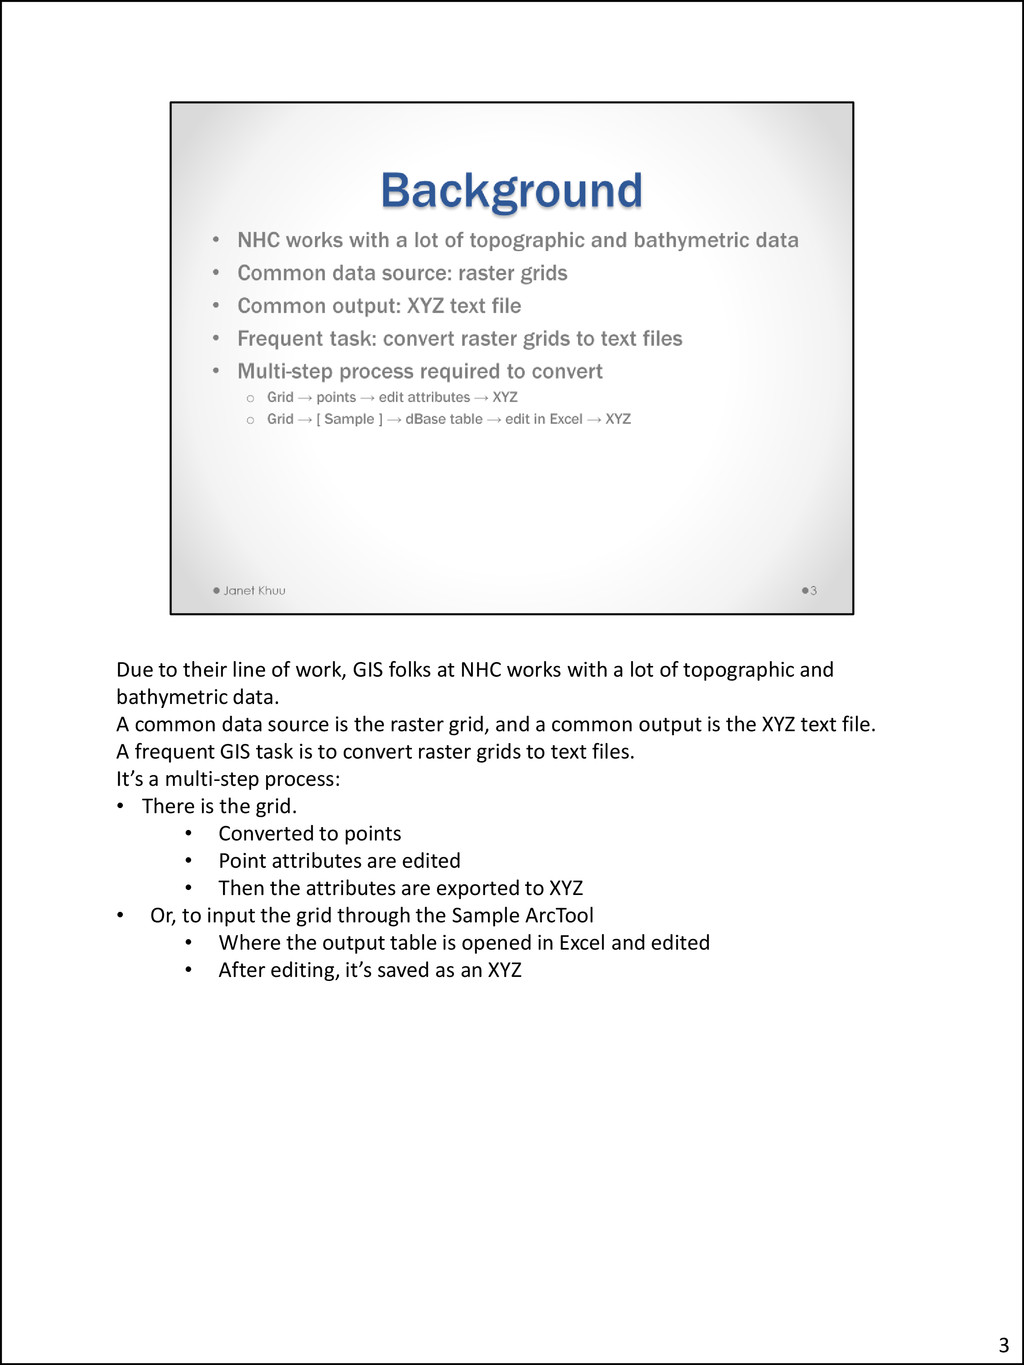
works with a lot of topographic and bathymetric data. A common data source is the raster grid, and a common output is the XYZ text file. A frequent GIS task is to convert raster grids to text files. It’s a multi-step process: • There is the grid. • Converted to points • Point attributes are edited • Then the attributes are exported to XYZ • Or, to input the grid through the Sample ArcTool • Where the output table is opened in Excel and edited • After editing, it’s saved as an XYZ 3
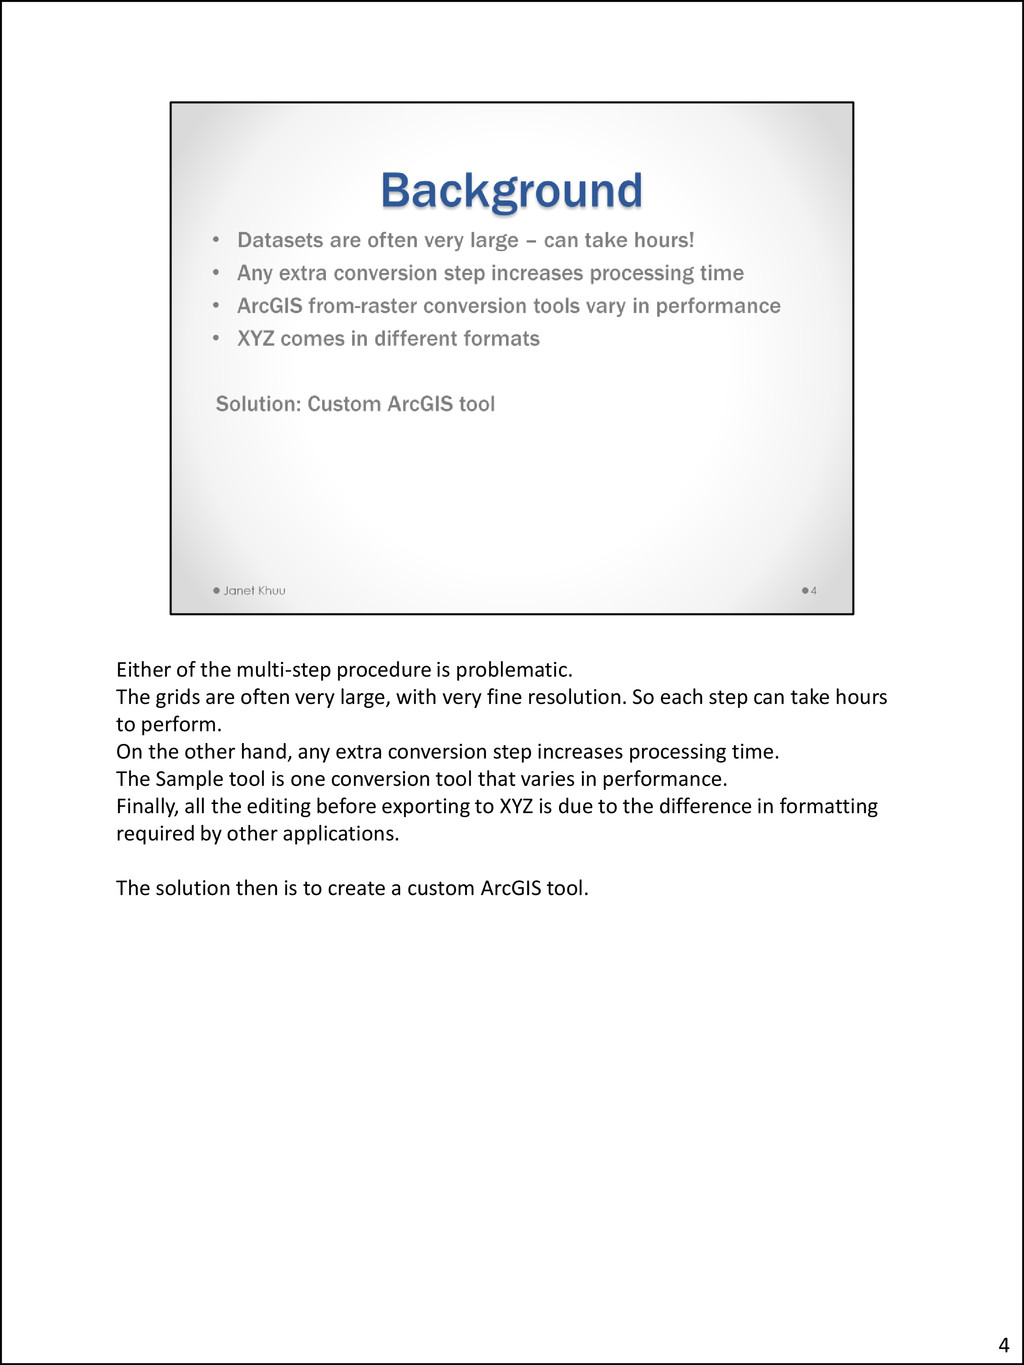
often very large, with very fine resolution. So each step can take hours to perform. On the other hand, any extra conversion step increases processing time. The Sample tool is one conversion tool that varies in performance. Finally, all the editing before exporting to XYZ is due to the difference in formatting required by other applications. The solution then is to create a custom ArcGIS tool. 4
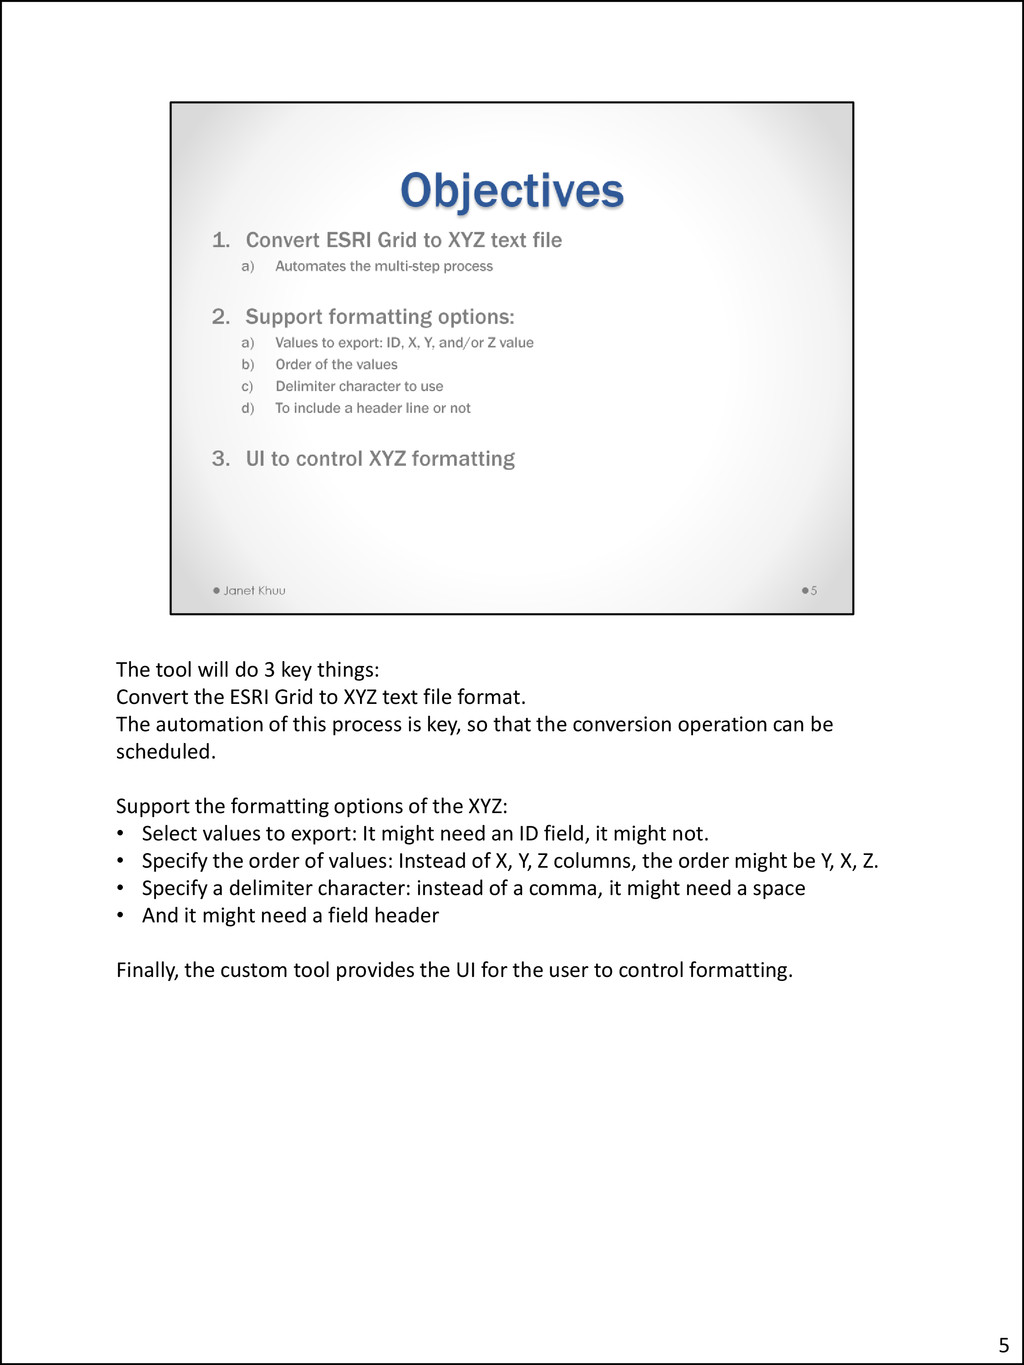
Grid to XYZ text file format. The automation of this process is key, so that the conversion operation can be scheduled. Support the formatting options of the XYZ: • Select values to export: It might need an ID field, it might not. • Specify the order of values: Instead of X, Y, Z columns, the order might be Y, X, Z. • Specify a delimiter character: instead of a comma, it might need a space • And it might need a field header Finally, the custom tool provides the UI for the user to control formatting. 5
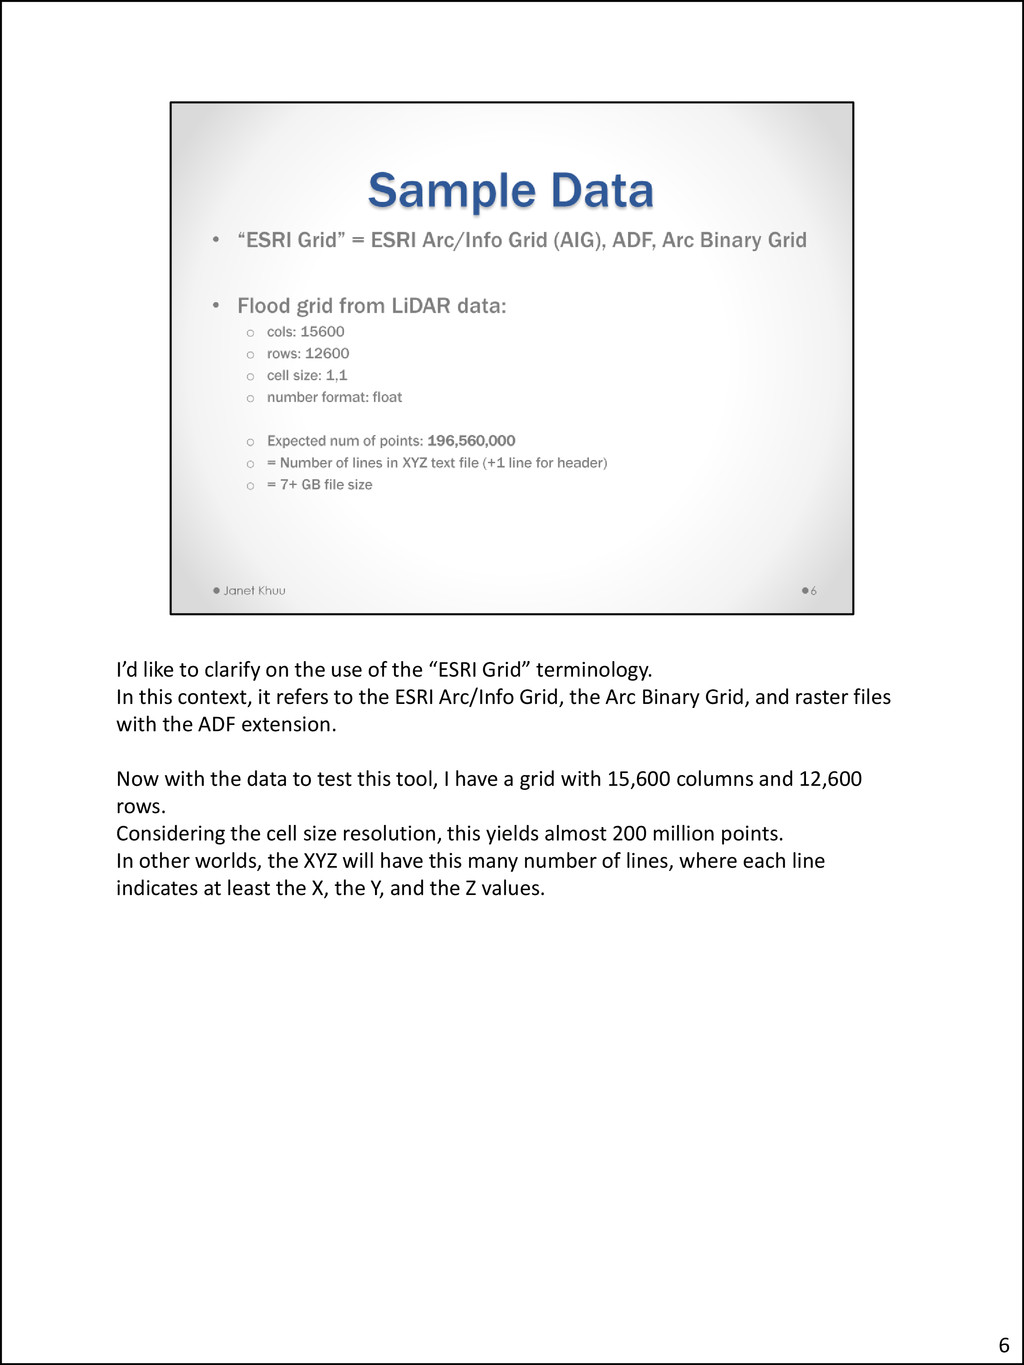
Grid” terminology. In this context, it refers to the ESRI Arc/Info Grid, the Arc Binary Grid, and raster files with the ADF extension. Now with the data to test this tool, I have a grid with 15,600 columns and 12,600 rows. Considering the cell size resolution, this yields almost 200 million points. In other worlds, the XYZ will have this many number of lines, where each line indicates at least the X, the Y, and the Z values. 6
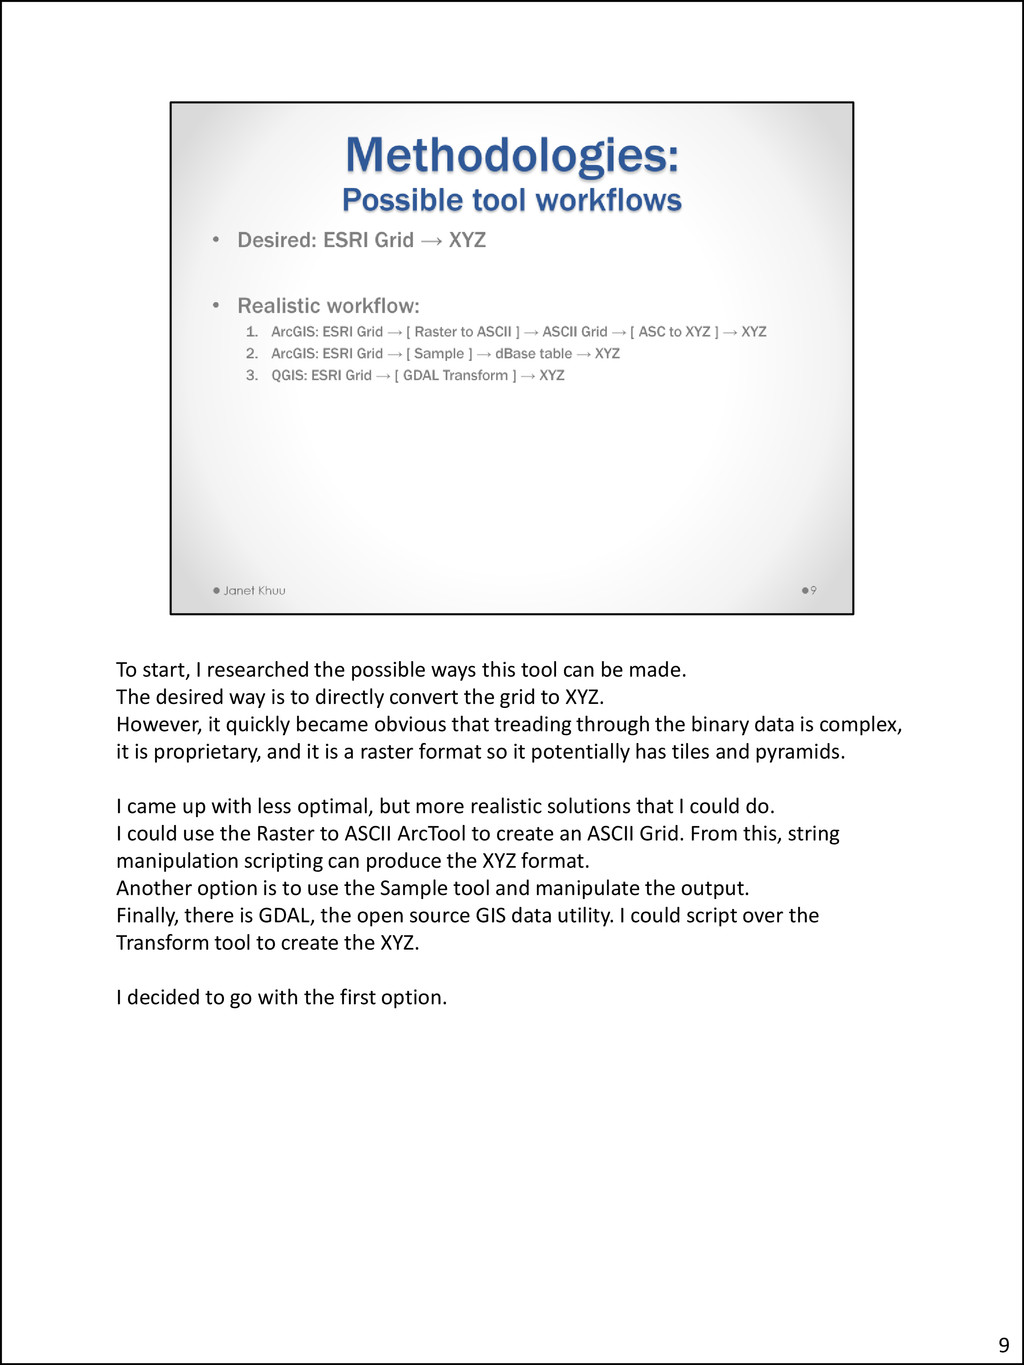
be made. The desired way is to directly convert the grid to XYZ. However, it quickly became obvious that treading through the binary data is complex, it is proprietary, and it is a raster format so it potentially has tiles and pyramids. I came up with less optimal, but more realistic solutions that I could do. I could use the Raster to ASCII ArcTool to create an ASCII Grid. From this, string manipulation scripting can produce the XYZ format. Another option is to use the Sample tool and manipulate the output. Finally, there is GDAL, the open source GIS data utility. I could script over the Transform tool to create the XYZ. I decided to go with the first option. 9
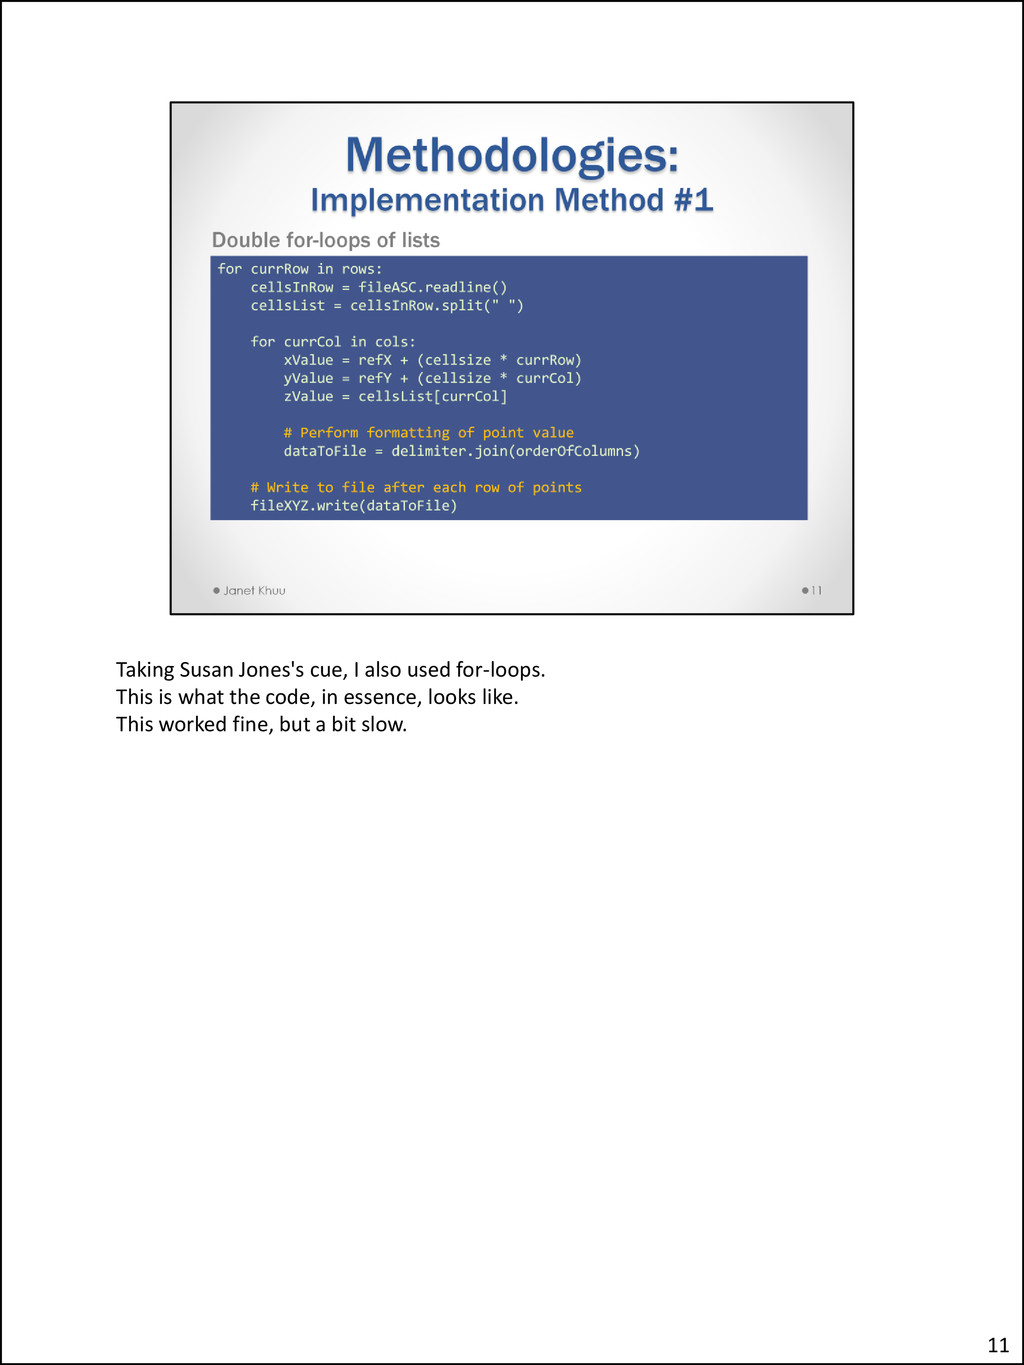
of the ASCII Grid to XYZ converter by Susan Jones available on the ESRI website. It showed that it could be done in Python and ArcObjects. But since I was dealing with ESRI Grid, I would also need to figure out how to first convert it to ASCII Grid. I decided to use ESRI's Raster to ASCII tool. Taking all of this in, my script would then • Translate the python script to use ArcPy • Automate the input and output handling between tools • And apply formatting transformation to XYZ 10
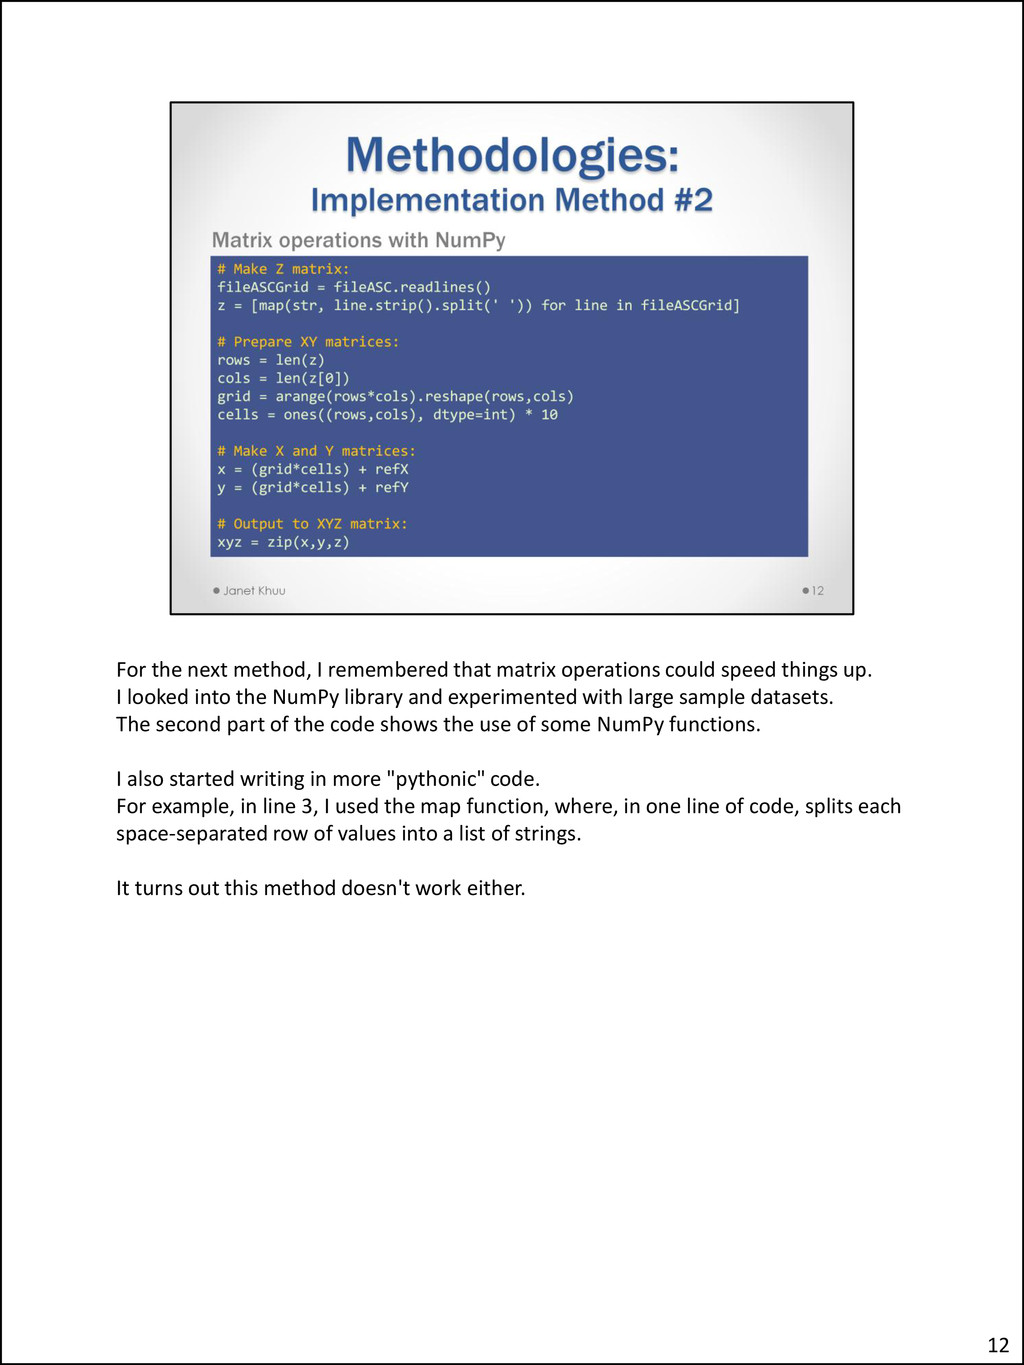
speed things up. I looked into the NumPy library and experimented with large sample datasets. The second part of the code shows the use of some NumPy functions. I also started writing in more "pythonic" code. For example, in line 3, I used the map function, where, in one line of code, splits each space-separated row of values into a list of strings. It turns out this method doesn't work either. 12
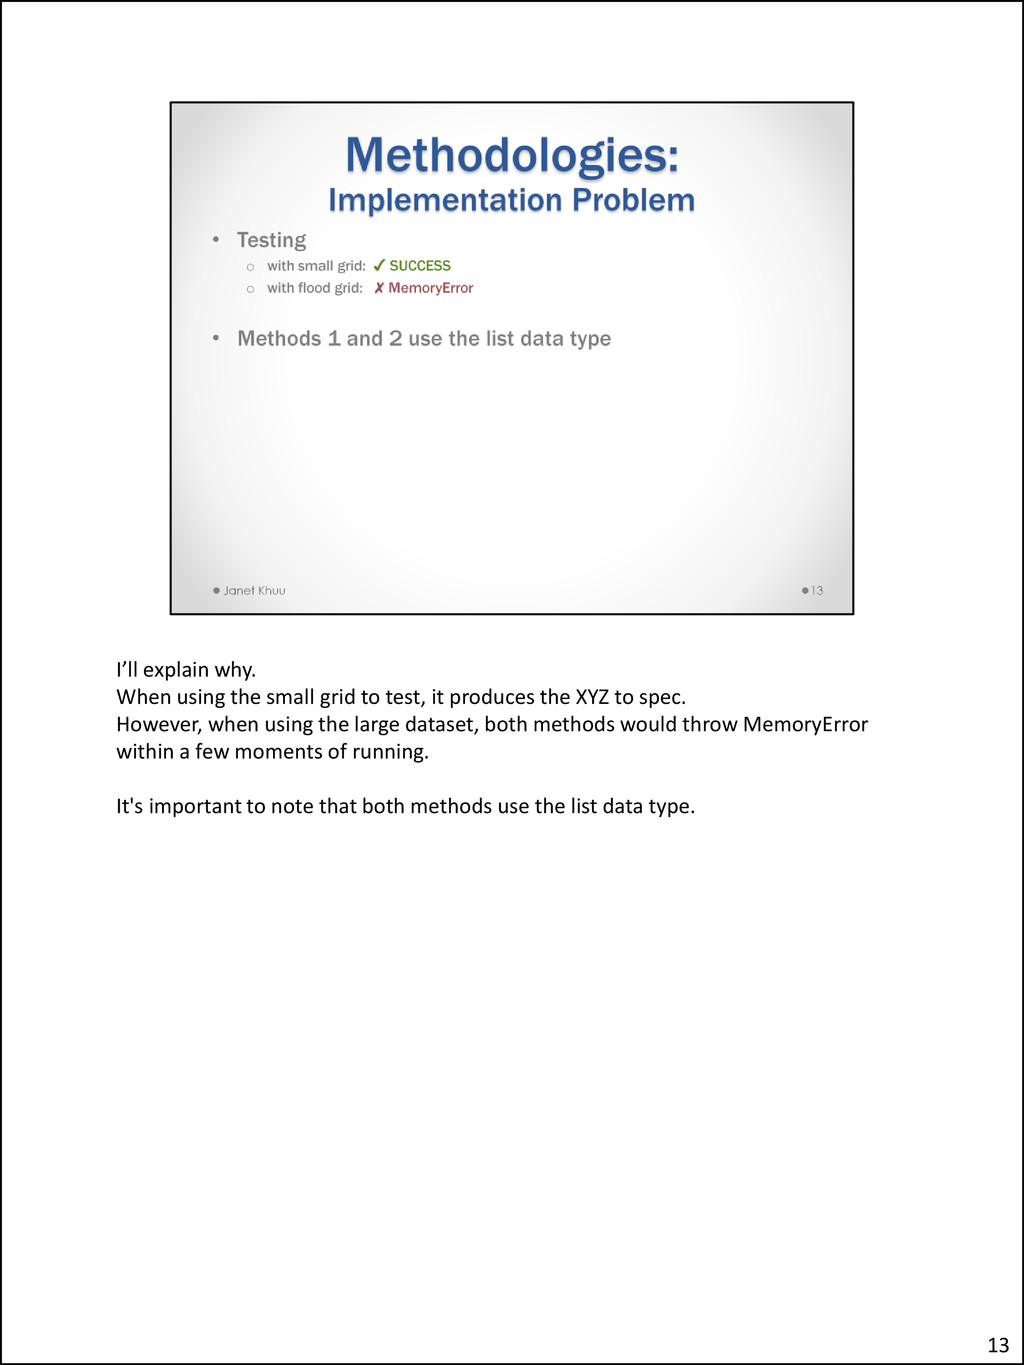
it produces the XYZ to spec. However, when using the large dataset, both methods would throw MemoryError within a few moments of running. It's important to note that both methods use the list data type. 13
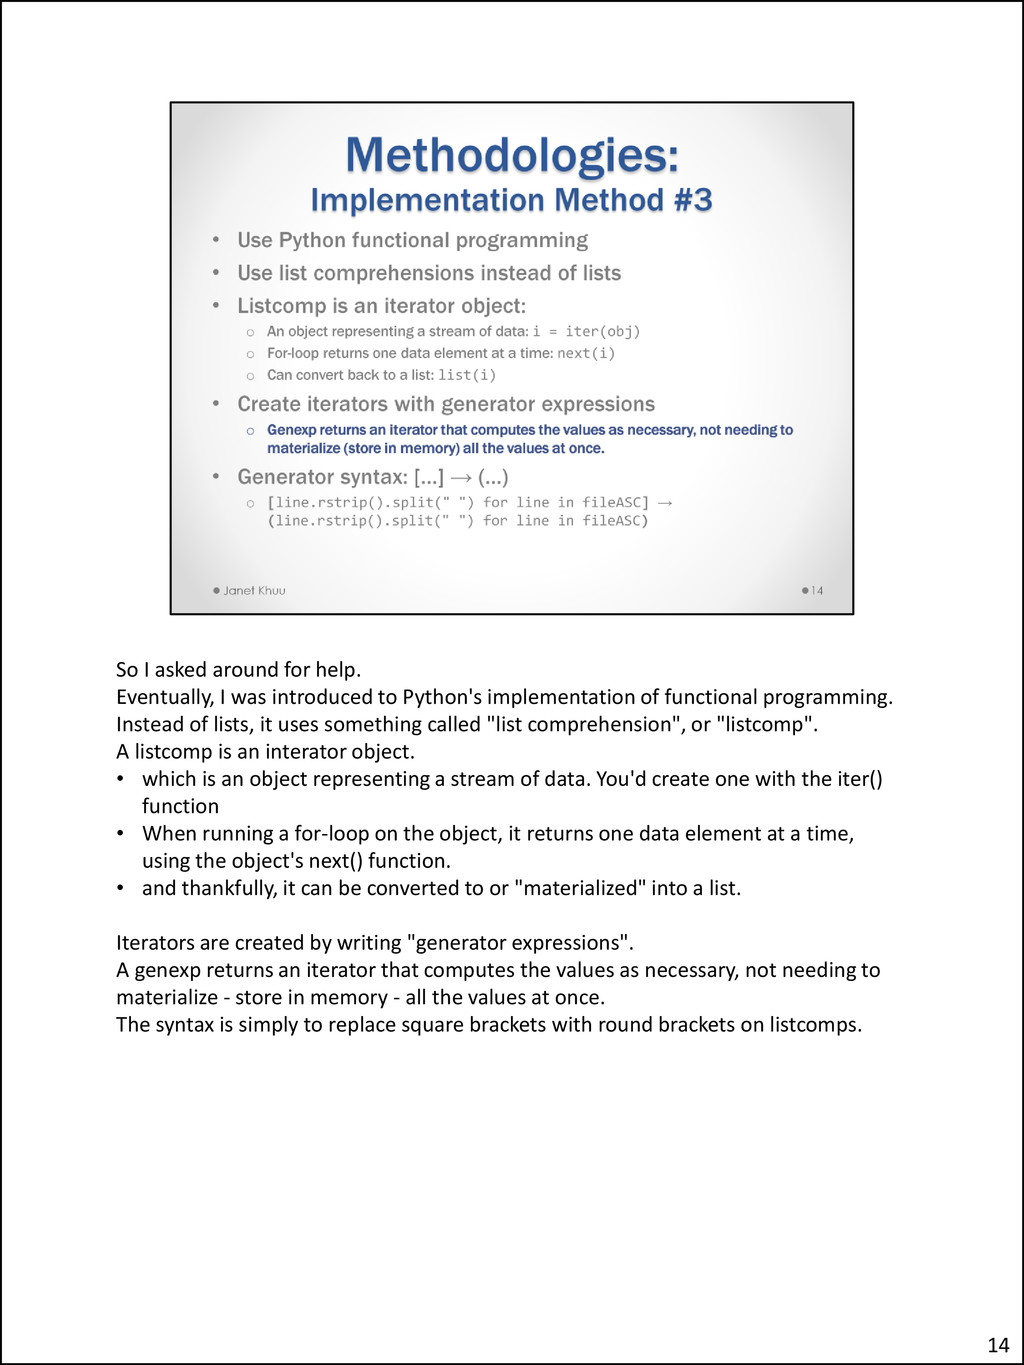
to Python's implementation of functional programming. Instead of lists, it uses something called "list comprehension", or "listcomp". A listcomp is an interator object. • which is an object representing a stream of data. You'd create one with the iter() function • When running a for-loop on the object, it returns one data element at a time, using the object's next() function. • and thankfully, it can be converted to or "materialized" into a list. Iterators are created by writing "generator expressions". A genexp returns an iterator that computes the values as necessary, not needing to materialize - store in memory - all the values at once. The syntax is simply to replace square brackets with round brackets on listcomps. 14
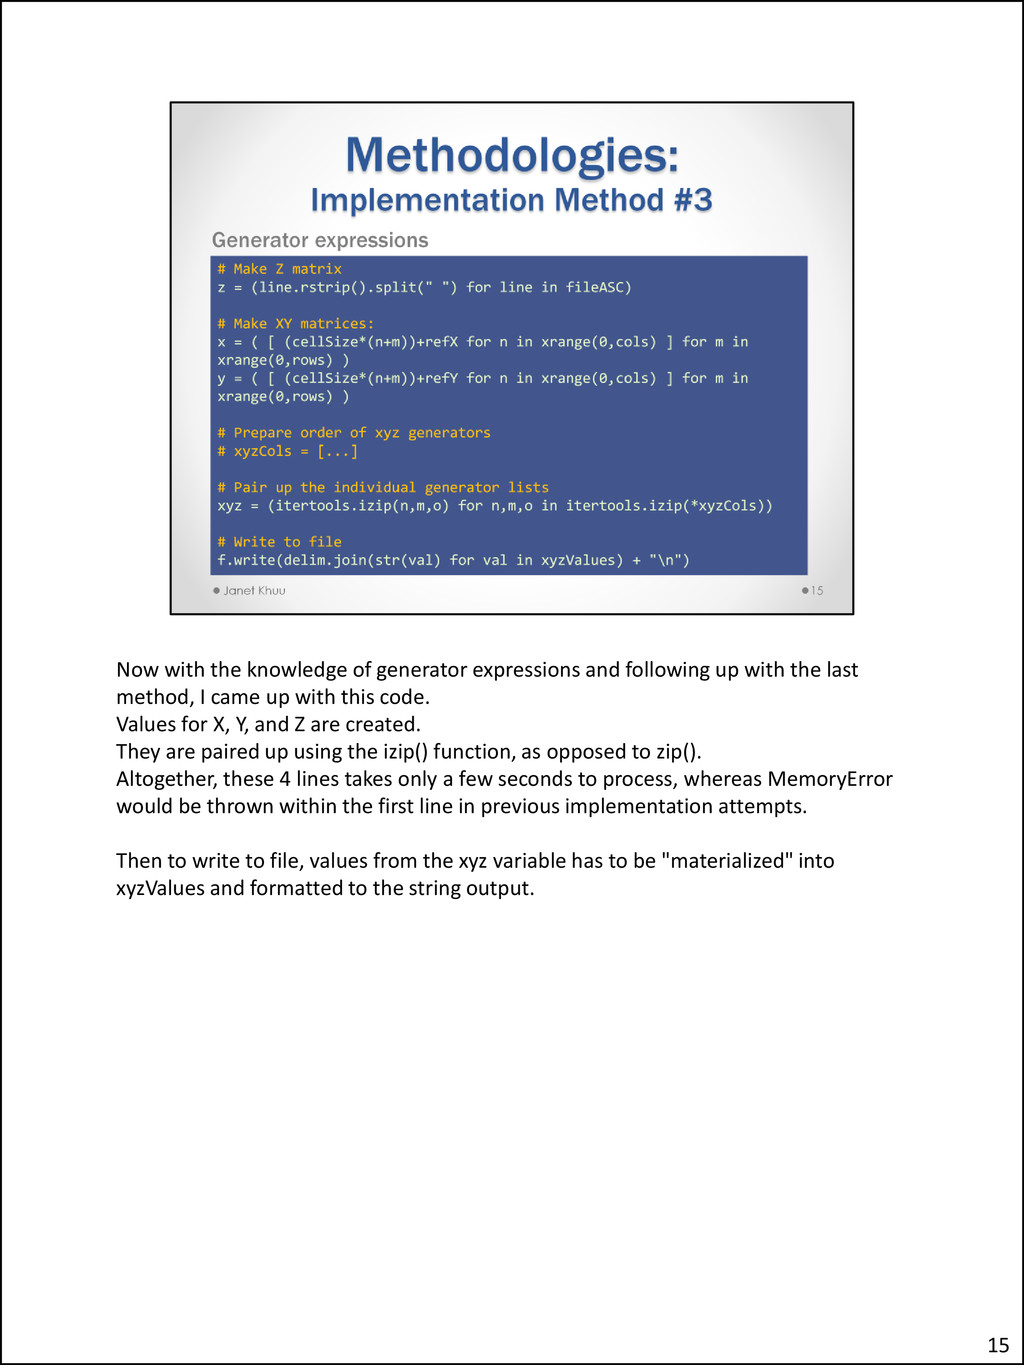
with the last method, I came up with this code. Values for X, Y, and Z are created. They are paired up using the izip() function, as opposed to zip(). Altogether, these 4 lines takes only a few seconds to process, whereas MemoryError would be thrown within the first line in previous implementation attempts. Then to write to file, values from the xyz variable has to be "materialized" into xyzValues and formatted to the string output. 15
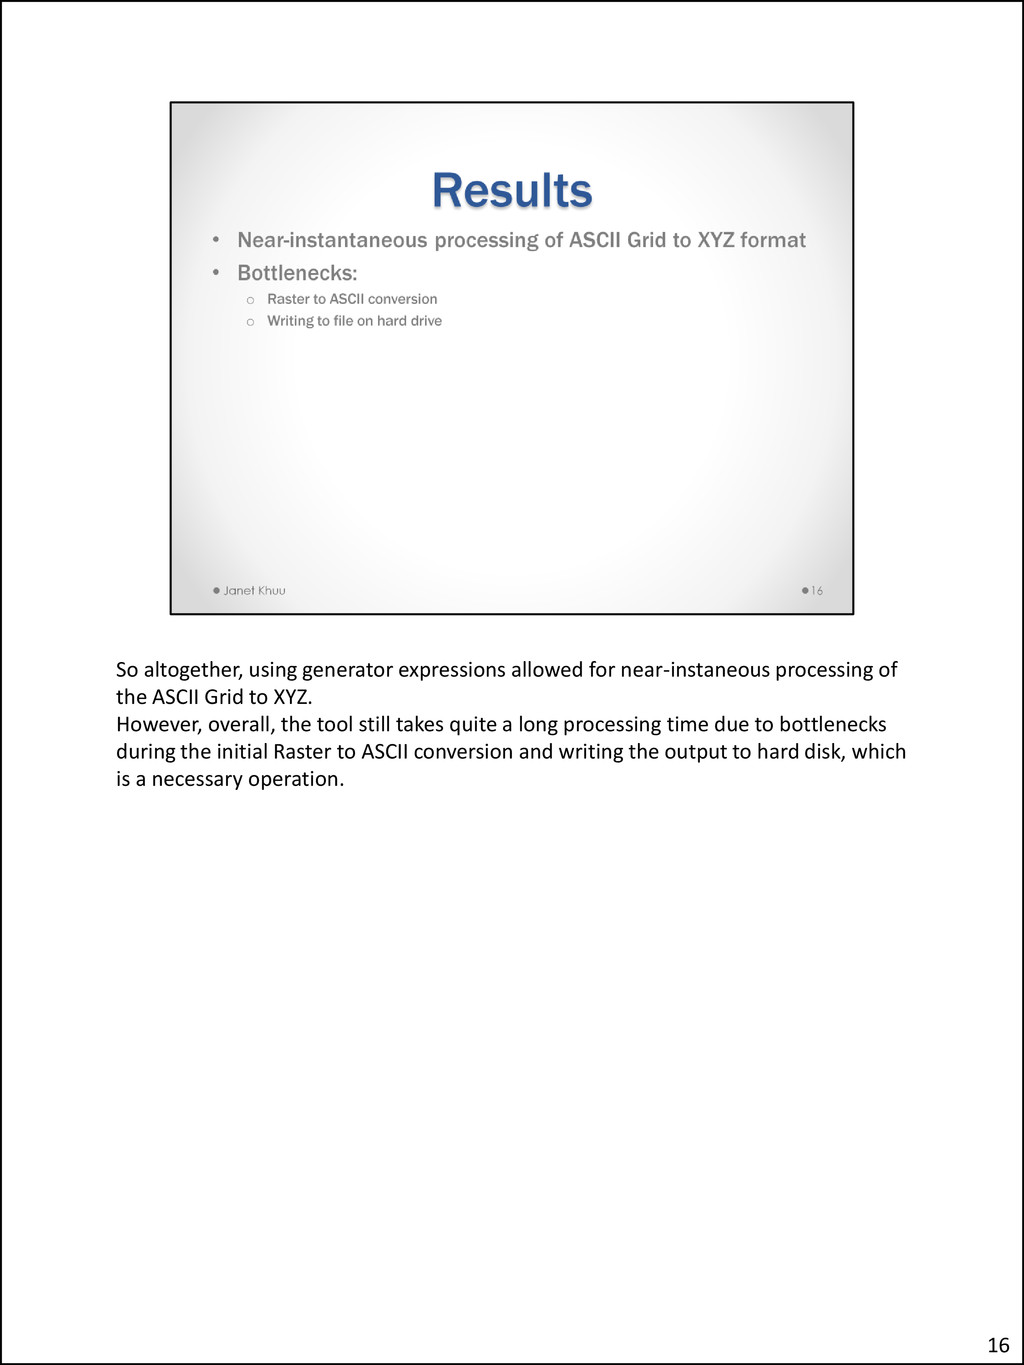
the ASCII Grid to XYZ. However, overall, the tool still takes quite a long processing time due to bottlenecks during the initial Raster to ASCII conversion and writing the output to hard disk, which is a necessary operation. 16
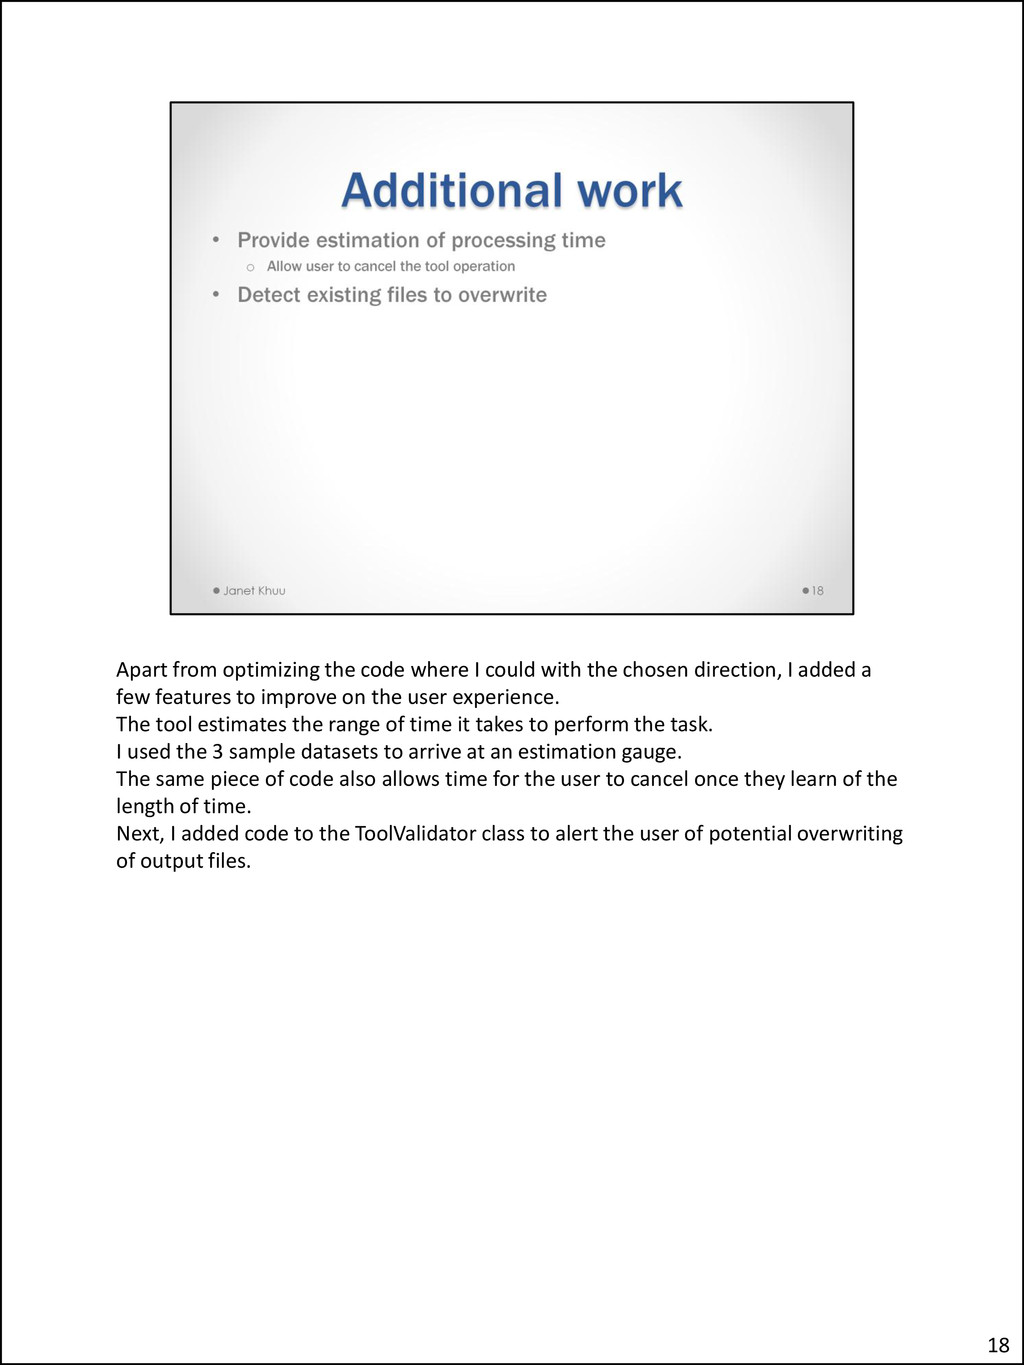
chosen direction, I added a few features to improve on the user experience. The tool estimates the range of time it takes to perform the task. I used the 3 sample datasets to arrive at an estimation gauge. The same piece of code also allows time for the user to cancel once they learn of the length of time. Next, I added code to the ToolValidator class to alert the user of potential overwriting of output files. 18
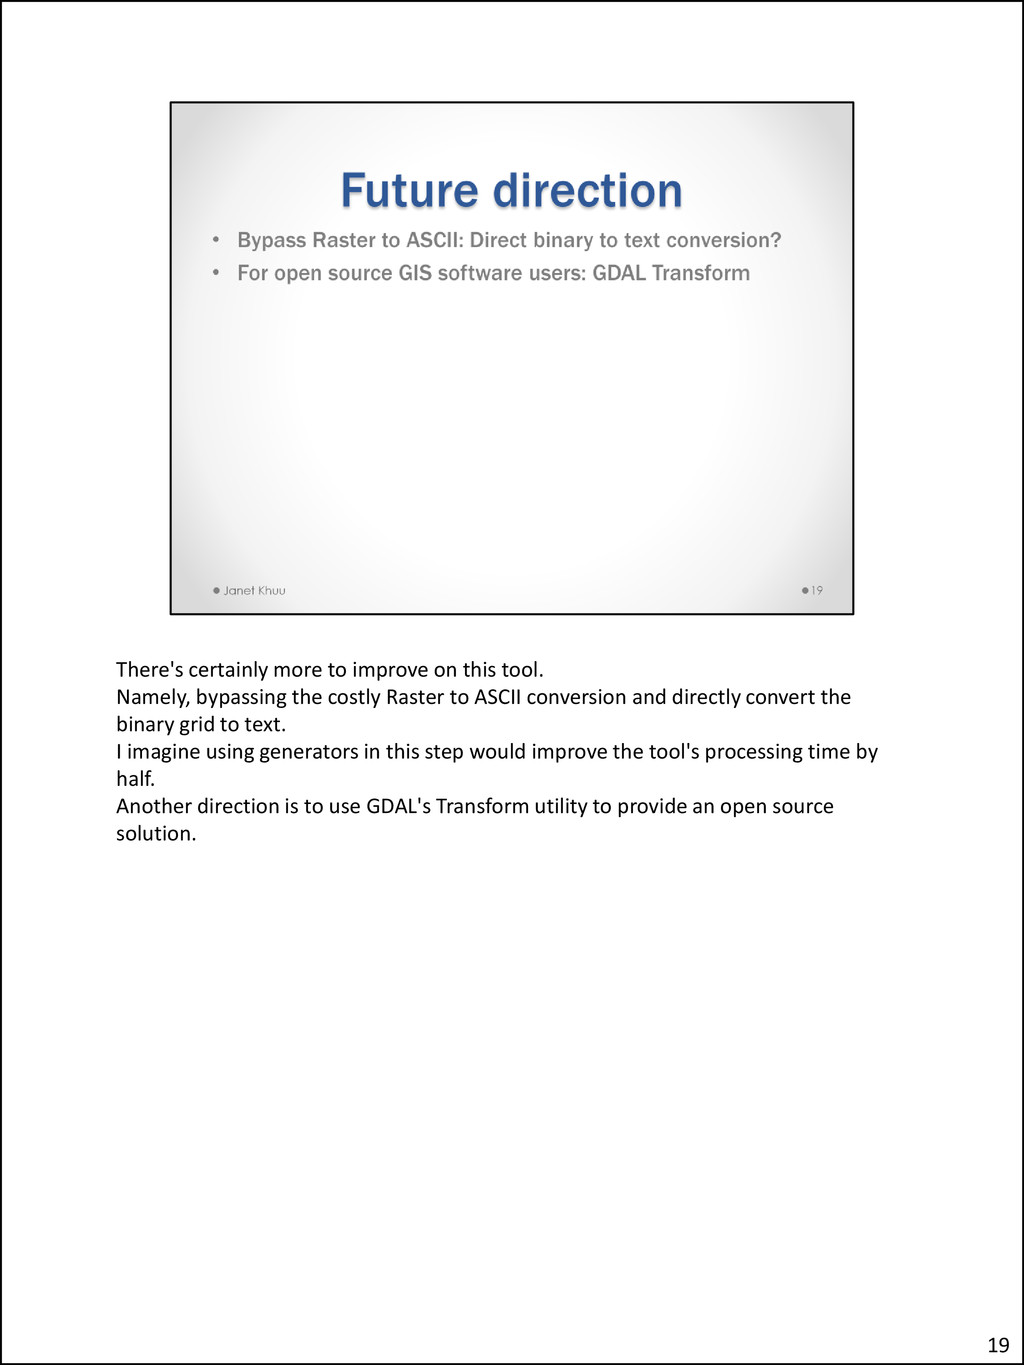
the costly Raster to ASCII conversion and directly convert the binary grid to text. I imagine using generators in this step would improve the tool's processing time by half. Another direction is to use GDAL's Transform utility to provide an open source solution. 19
learning opportunity. I learned about the Python way of functional programming, namely, with list comprehensions, iterables, and generator expressions and functions. I have memorized string manipulation functions in Python. I am now familiar with the two types of grids and XYZ formats. Finally, because I created a custom ArcTool, I came away learning how to document the tool and parameters, and scripting possibilities to improve the user experience with ToolValidator. 20
if it weren’t for a number of these resources. Namely, StackOverflow Q&A’s, the Python book and documentation, and the Python IRC channel were immensely helpful. 21