Upgrade to Pro — share decks privately, control downloads, hide ads and more …

Software Metrics Machine

Software Metrics Machine

Software Metrics Machine (SMM) is an open-source, local-first command-line tool and dashboard (https://www.npmjs.com/package/@smmachine/launcher) that collects, stores, and visualizes engineering metrics from the systems a development team already uses — git history, CI/CD runs, pull requests, issue trackers, and code-quality gates. It runs entirely on the user's machine: no data leaves the local environment, no account is required, and no telemetry is collected.

Avatar for Marabesi

Marabesi

July 27, 2026

More Decks by Marabesi

Other Decks in Programming

Transcript

  1. OPEN SOURCE bolt LOCAL-FIRST DORA-INSPIRED Software Metrics Machine. A data-driven

    approach to high-performing teams. Everything runs locally on your machine — your code, your git history, your CI, your metrics. # Install $ npm i -g @smmachine/launcher BUILT FOR TECH LEADS & DEVELOPERS WHO WANT TO SHIP BETTER SOFTWARE, FASTER github.com/Side-Projects-4-Fun/software-metrics-machine
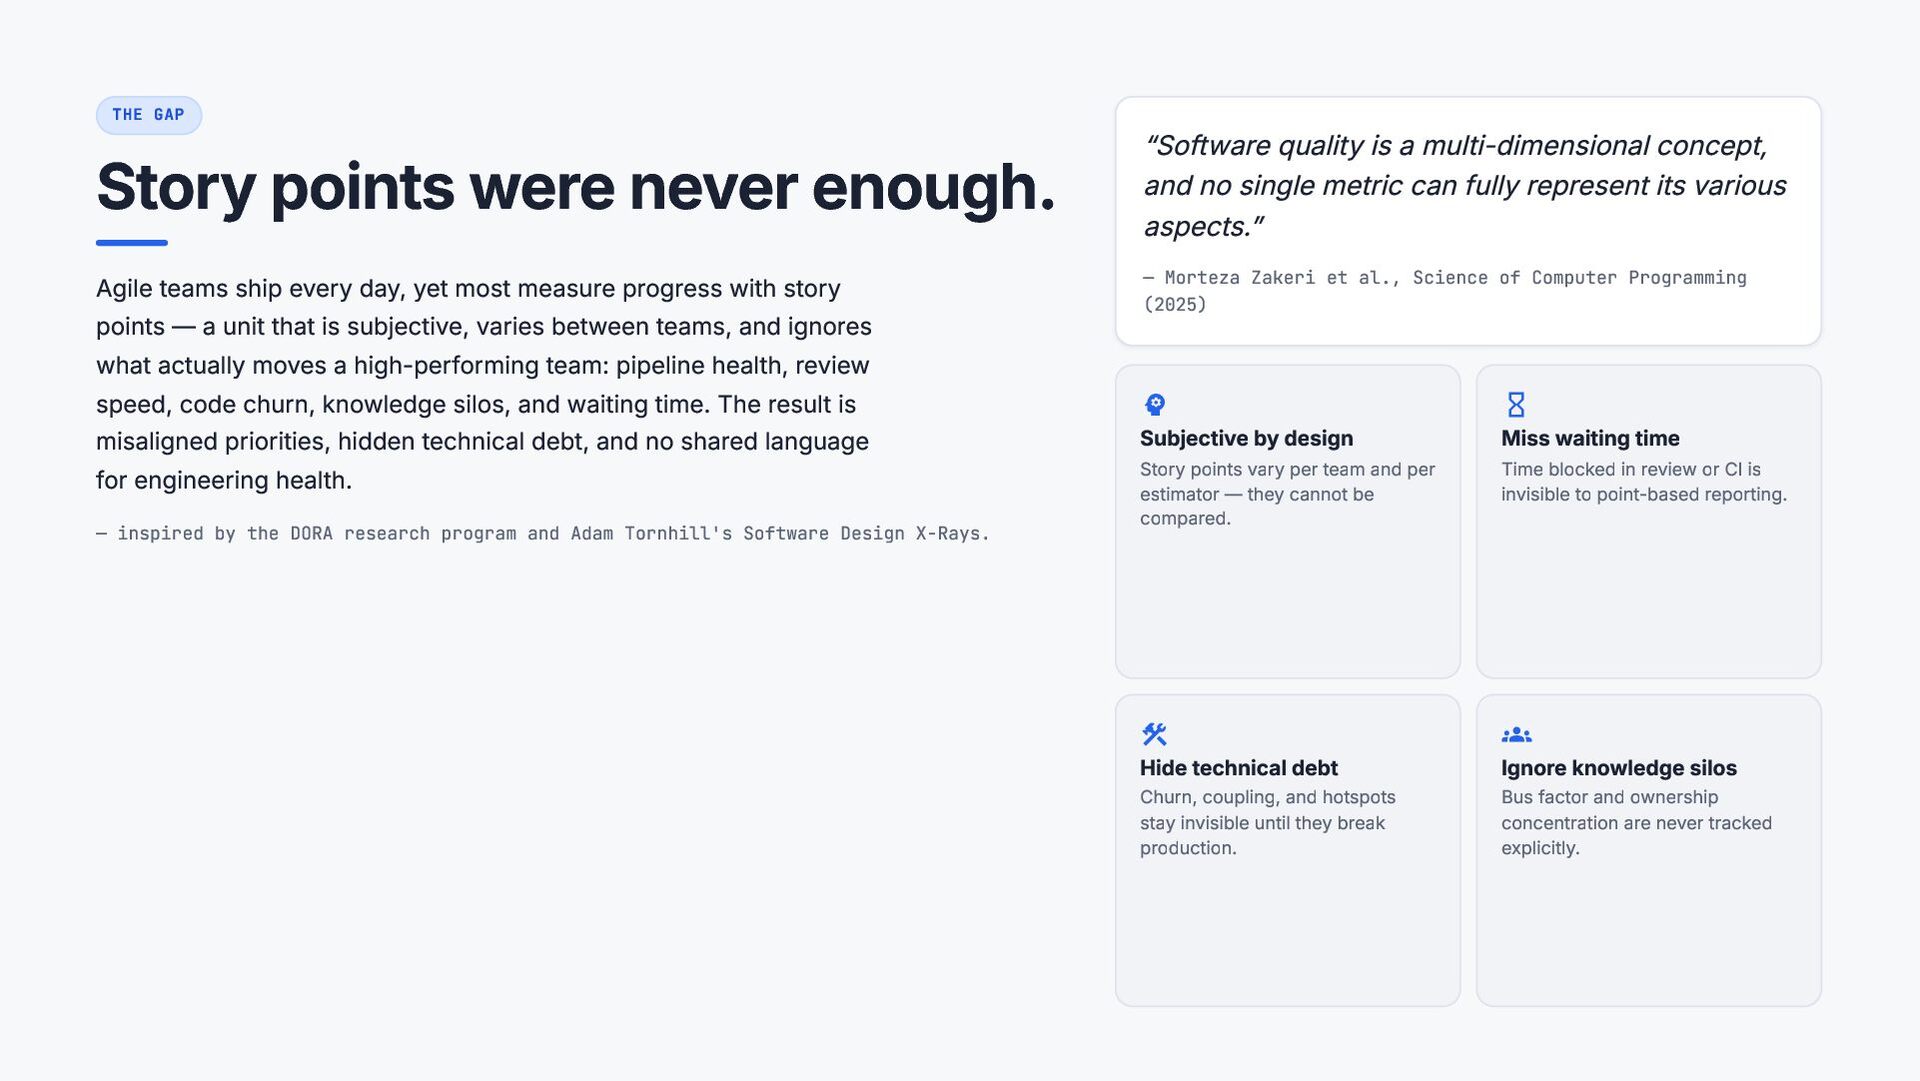
  2. THE GAP Story points were never enough. “Software quality is

    a multi-dimensional concept, and no single metric can fully represent its various aspects.” Agile teams ship every day, yet most measure progress with story points — a unit that is subjective, varies between teams, and ignores what actually moves a high-performing team: pipeline health, review speed, code churn, knowledge silos, and waiting time. The result is misaligned priorities, hidden technical debt, and no shared language for engineering health. — Morteza Zakeri et al., Science of Computer Programming (2025) — inspired by the DORA research program and Adam Tornhill's Software Design X-Rays. psychology hourglass_empty Story points vary per team and per estimator — they cannot be compared. Time blocked in review or CI is invisible to point-based reporting. Subjective by design Miss waiting time construction groups_off Churn, coupling, and hotspots stay invisible until they break production. Bus factor and ownership concentration are never tracked explicitly. Hide technical debt Ignore knowledge silos
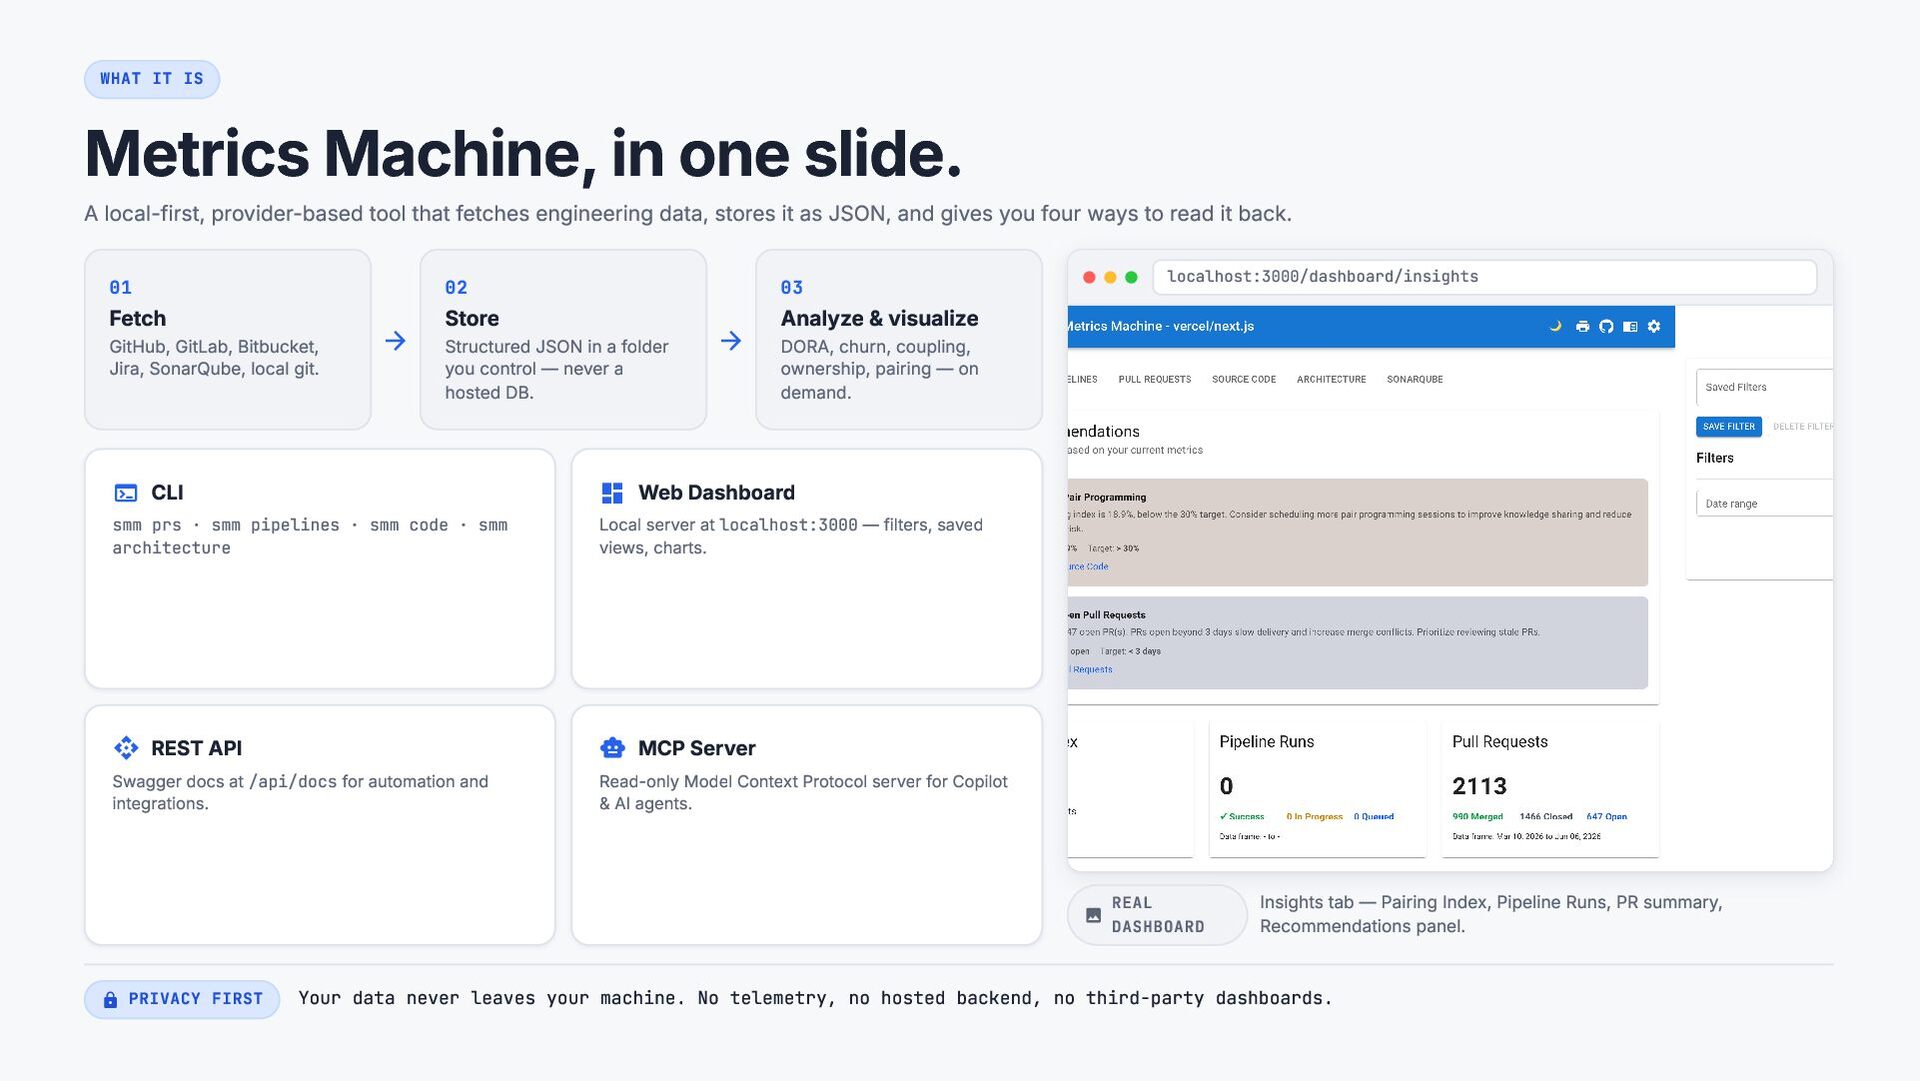
  3. WHAT IT IS Metrics Machine, in one slide. A local-first,

    provider-based tool that fetches engineering data, stores it as JSON, and gives you four ways to read it back. 01 Fetch 02 GitHub, GitLab, Bitbucket, Jira, SonarQube, local git. arrow_forward Store 03 Structured JSON in a folder you control — never a hosted DB. arrow_forward Analyze & visualize DORA, churn, coupling, ownership, pairing — on demand. terminal CLI dashboard Web Dashboard api REST API smart_toy MCP Server smm prs · smm pipelines · smm code · smm architecture Swagger docs at /api/docs for automation and integrations. localhost:3000/dashboard/insights Local server at localhost:3000 — filters, saved views, charts. Read-only Model Context Protocol server for Copilot & AI agents. REAL image DASHBOARD lock PRIVACY FIRST Insights tab — Pairing Index, Pipeline Runs, PR summary, Recommendations panel. Your data never leaves your machine. No telemetry, no hosted backend, no third-party dashboards.
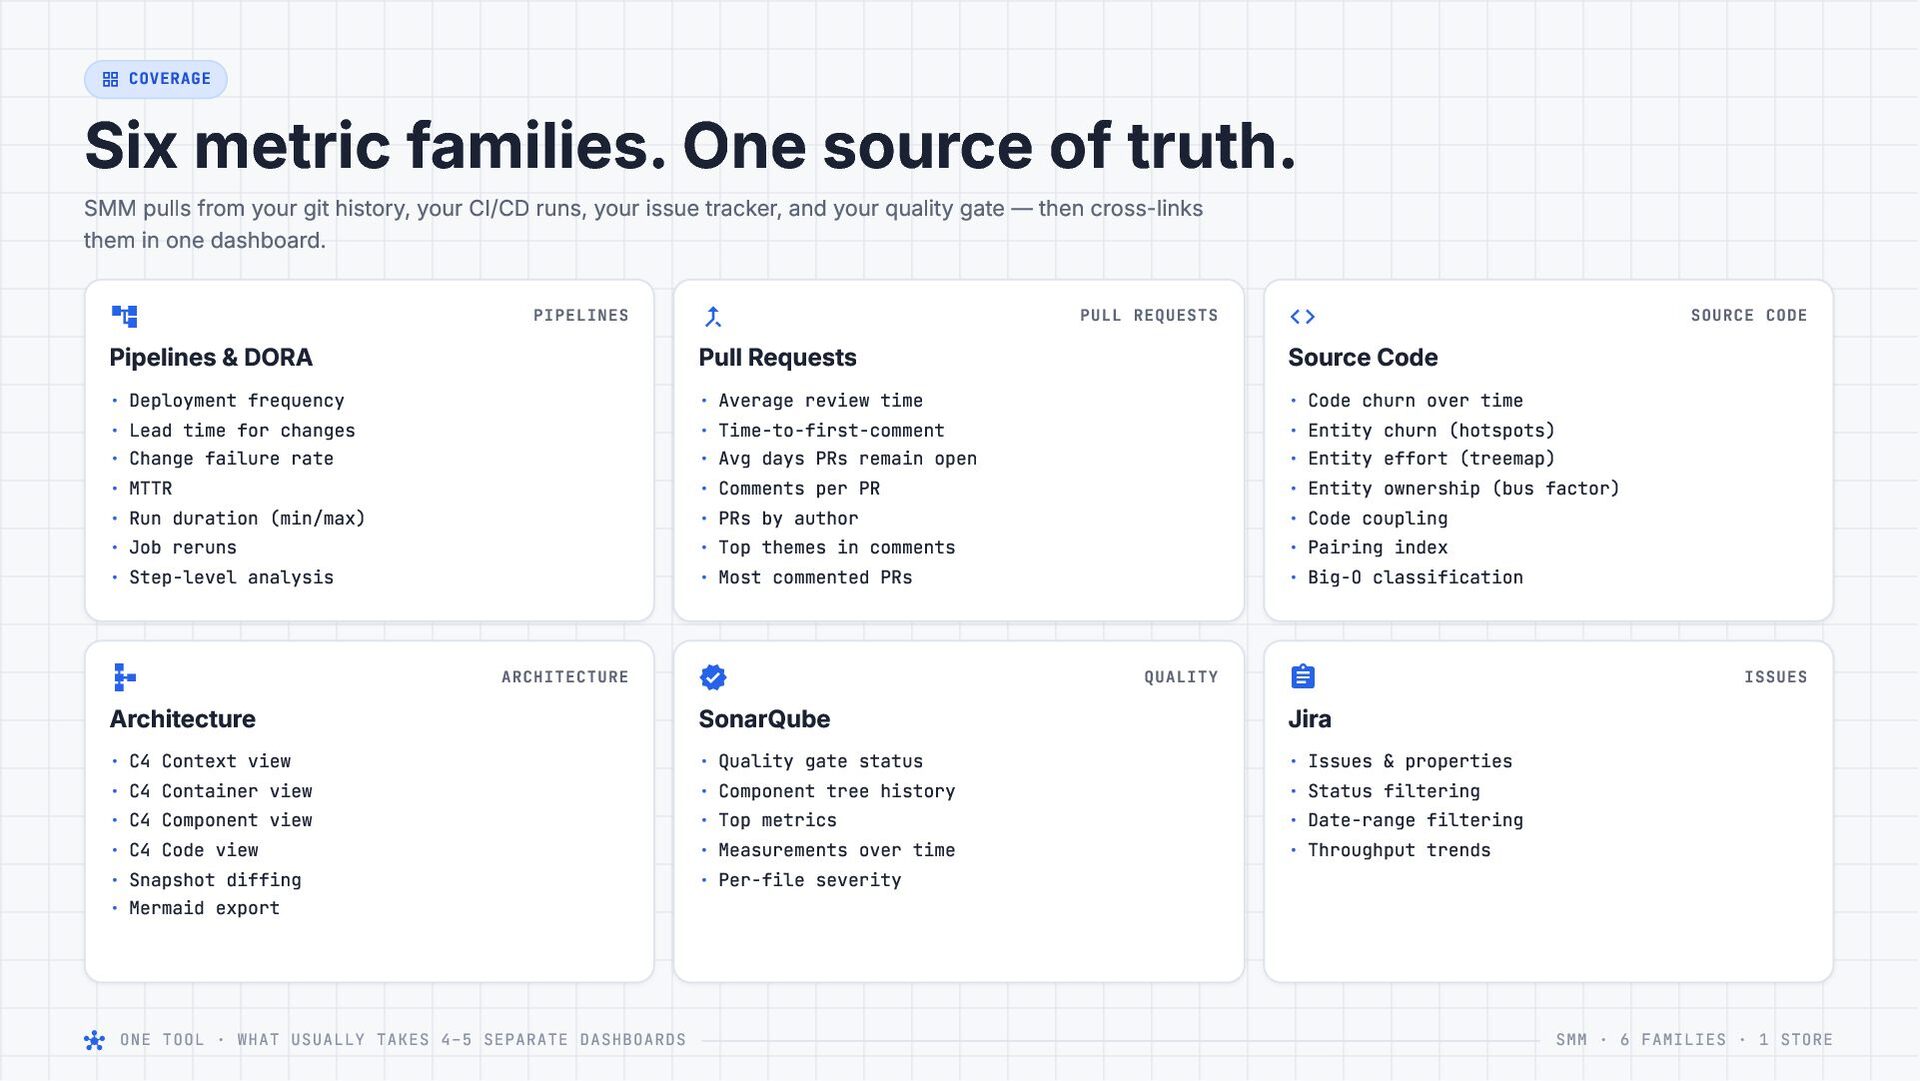
  4. grid_view COVERAGE Six metric families. One source of truth. SMM

    pulls from your git history, your CI/CD runs, your issue tracker, and your quality gate — then cross-links them in one dashboard. account_tree PIPELINES Pipelines & DORA PULL REQUESTS Pull Requests · Deployment frequency · Lead time for changes · Change failure rate · MTTR · Run duration (min/max) · Job reruns · Step-level analysis schema merge_type Architecture · C4 Context view · C4 Container view · C4 Component view · C4 Code view · Snapshot diffing · Mermaid export hub ONE TOOL · WHAT USUALLY TAKES 4–5 SEPARATE DASHBOARDS verified SonarQube · Quality gate status · Component tree history · Top metrics · Measurements over time · Per-file severity SOURCE CODE Source Code · Average review time · Time-to-first-comment · Avg days PRs remain open · Comments per PR · PRs by author · Top themes in comments · Most commented PRs ARCHITECTURE code · Code churn over time · Entity churn (hotspots) · Entity effort (treemap) · Entity ownership (bus factor) · Code coupling · Pairing index · Big-O classification QUALITY assignment ISSUES Jira · Issues & properties · Status filtering · Date-range filtering · Throughput trends SMM · 6 FAMILIES · 1 STORE
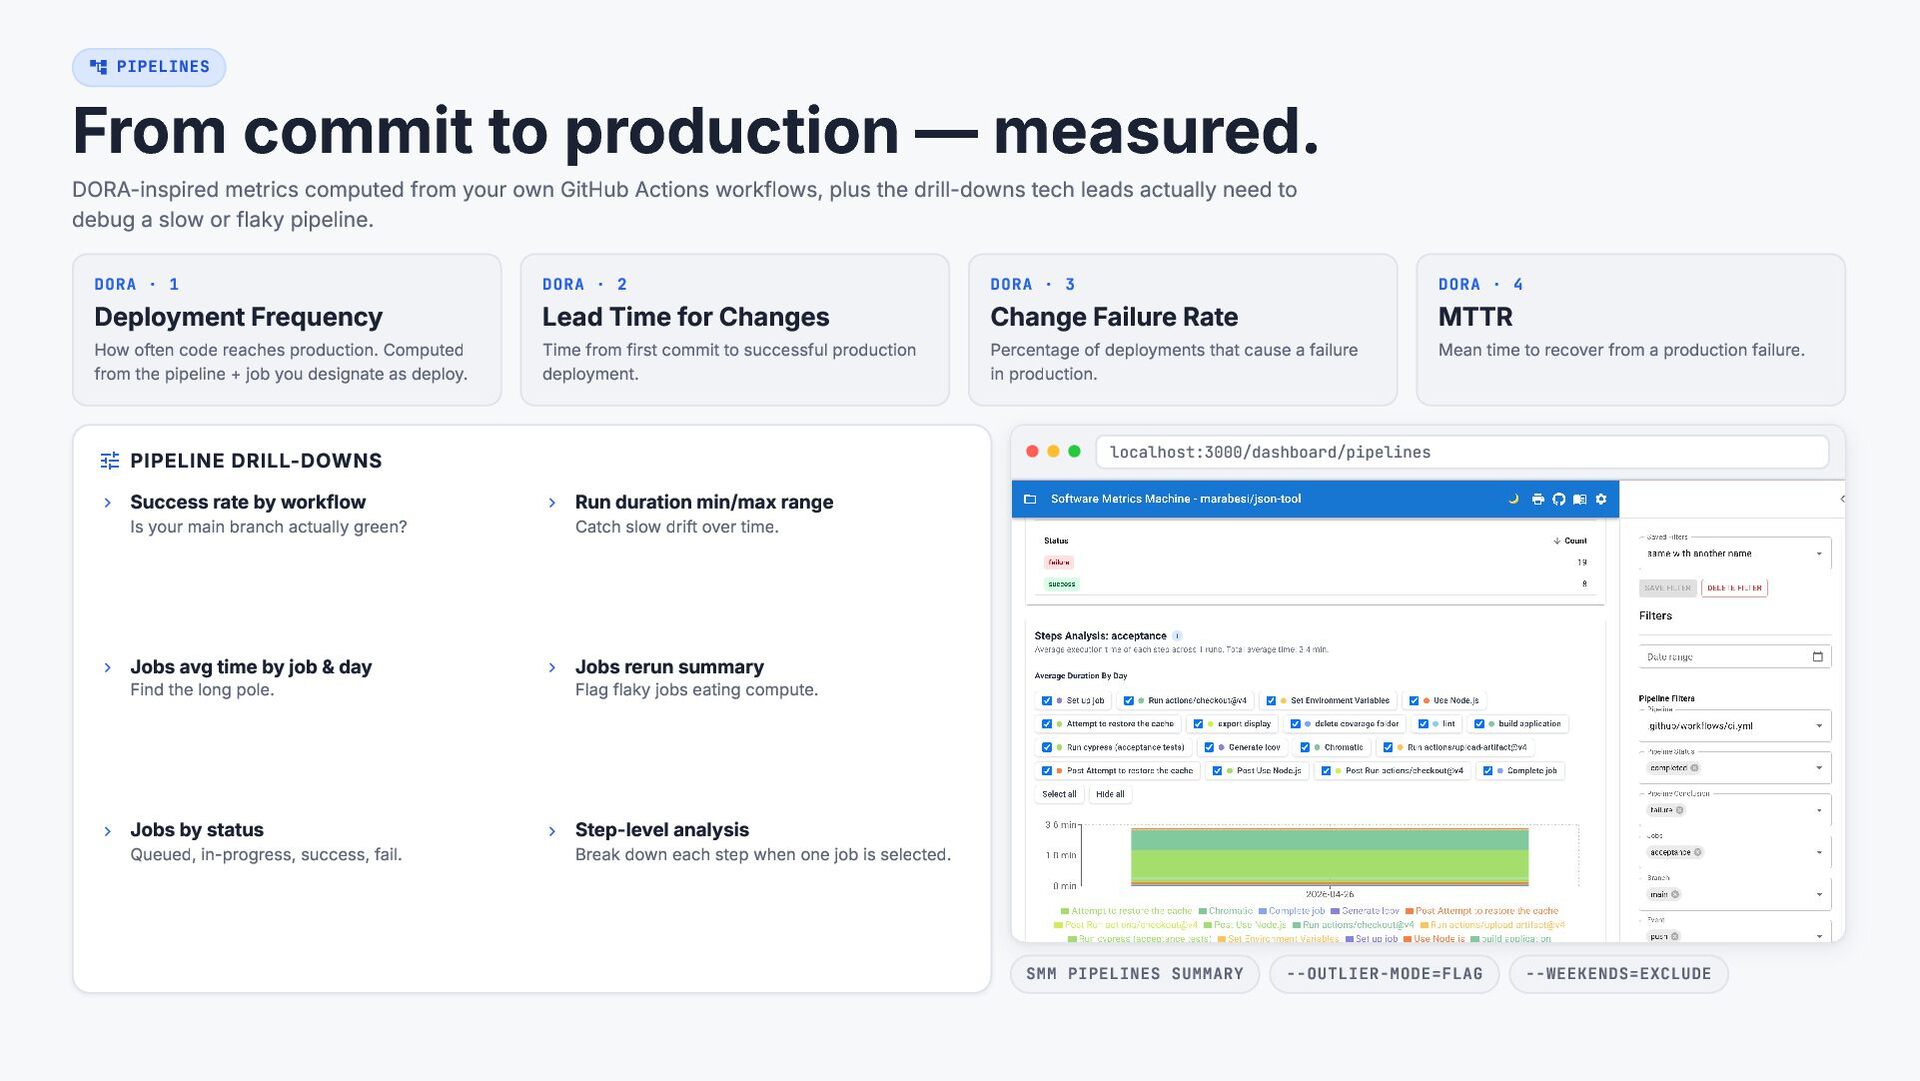
  5. account_tree PIPELINES From commit to production — measured. DORA-inspired metrics

    computed from your own GitHub Actions workflows, plus the drill-downs tech leads actually need to debug a slow or flaky pipeline. DORA · 1 DORA · 2 DORA · 3 DORA · 4 How often code reaches production. Computed from the pipeline + job you designate as deploy. Time from first commit to successful production deployment. Percentage of deployments that cause a failure in production. Mean time to recover from a production failure. Deployment Frequency Lead Time for Changes chevron_right Run duration min/max range chevron_right Jobs avg time by job & day chevron_right Jobs rerun summary chevron_right Jobs by status chevron_right Step-level analysis Find the long pole. Queued, in-progress, success, fail. MTTR localhost:3000/dashboard/pipelines tune PIPELINE DRILL-DOWNS chevron_right Success rate by workflow Is your main branch actually green? Change Failure Rate Catch slow drift over time. Flag flaky jobs eating compute. Break down each step when one job is selected. SMM PIPELINES SUMMARY --OUTLIER-MODE=FLAG --WEEKENDS=EXCLUDE
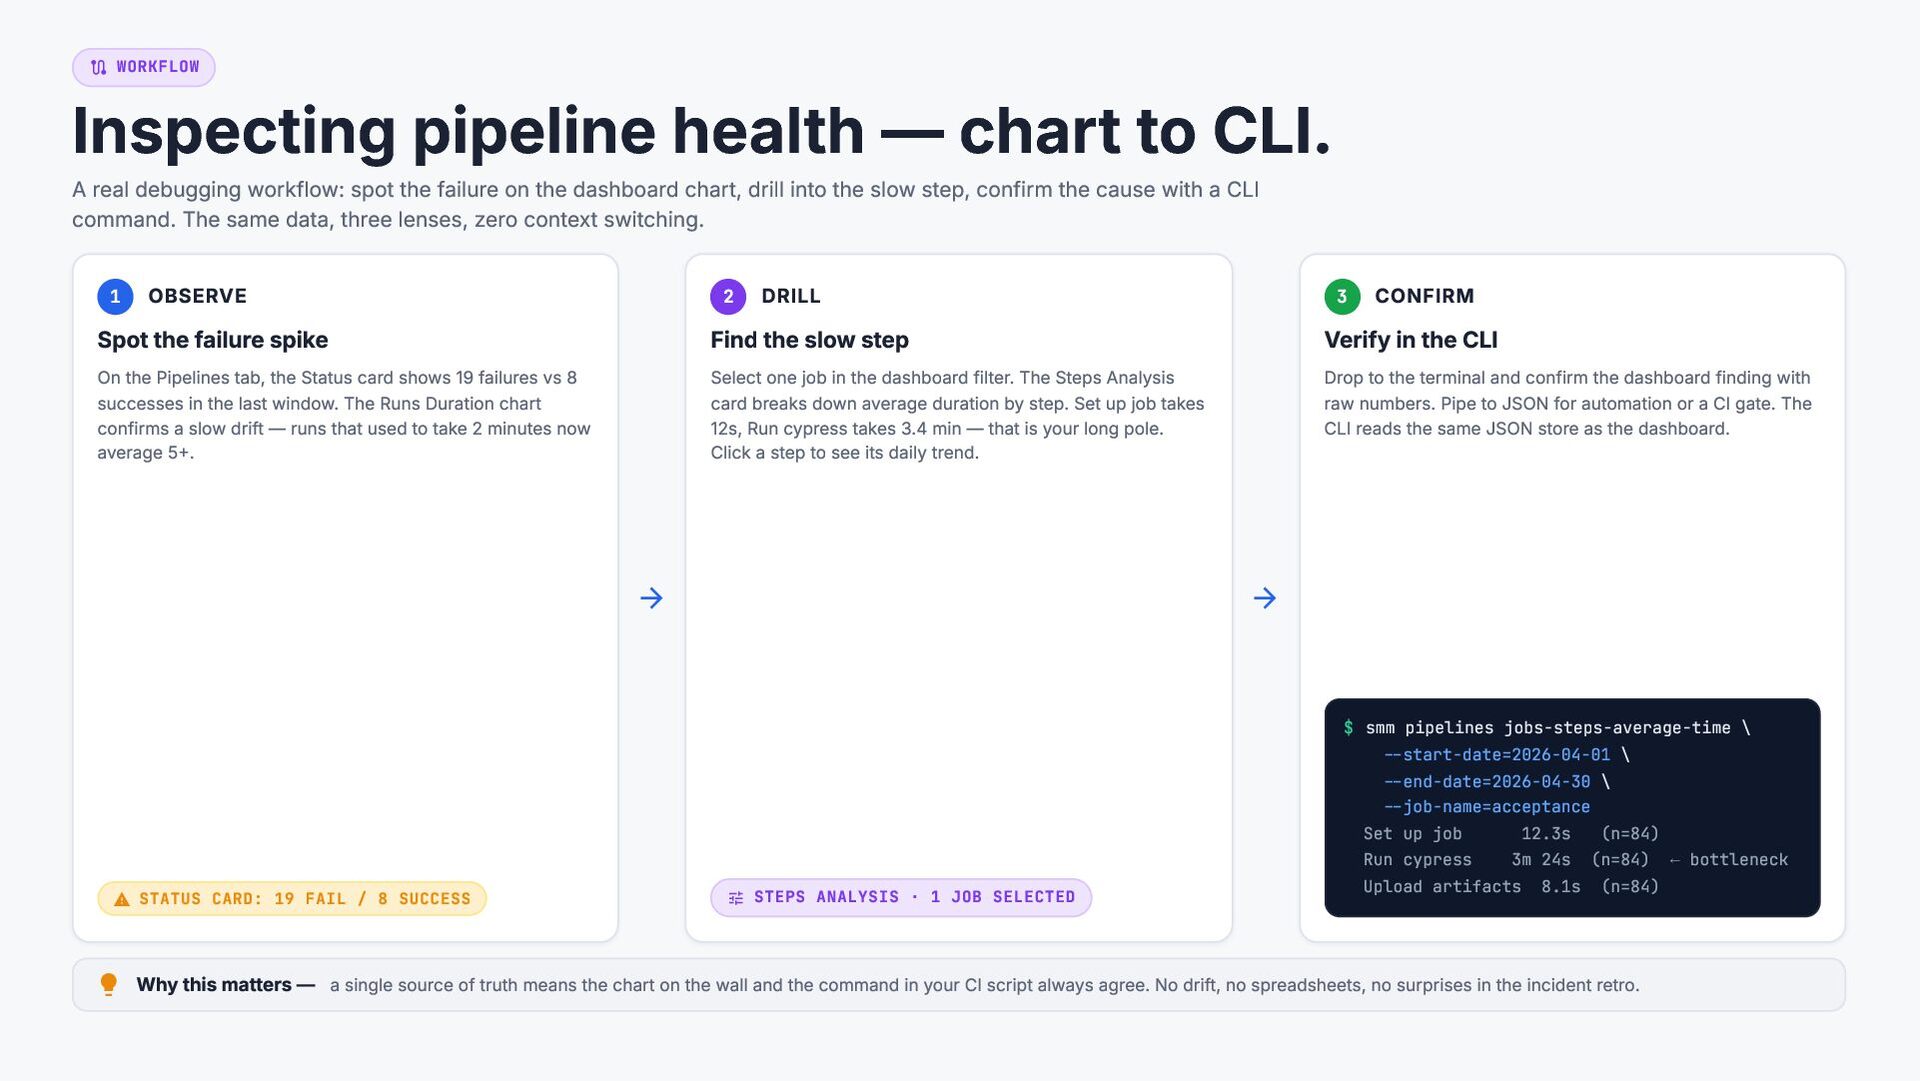
  6. route WORKFLOW Inspecting pipeline health — chart to CLI. A

    real debugging workflow: spot the failure on the dashboard chart, drill into the slow step, confirm the cause with a CLI command. The same data, three lenses, zero context switching. 1 OBSERVE 2 DRILL 3 CONFIRM Spot the failure spike Find the slow step Verify in the CLI On the Pipelines tab, the Status card shows 19 failures vs 8 successes in the last window. The Runs Duration chart confirms a slow drift — runs that used to take 2 minutes now average 5+. Select one job in the dashboard filter. The Steps Analysis card breaks down average duration by step. Set up job takes 12s, Run cypress takes 3.4 min — that is your long pole. Click a step to see its daily trend. Drop to the terminal and confirm the dashboard finding with raw numbers. Pipe to JSON for automation or a CI gate. The CLI reads the same JSON store as the dashboard. arrow_forward warning STATUS CARD: 19 FAIL / 8 SUCCESS arrow_forward tune STEPS ANALYSIS · 1 JOB SELECTED $ smm pipelines jobs-steps-average-time \ --start-date=2026-04-01 \ --end-date=2026-04-30 \ --job-name=acceptance Set up job 12.3s (n=84) Run cypress 3m 24s (n=84) ← bottleneck Upload artifacts 8.1s (n=84) lightbulb Why this matters — a single source of truth means the chart on the wall and the command in your CI script always agree. No drift, no spreadsheets, no surprises in the incident retro.
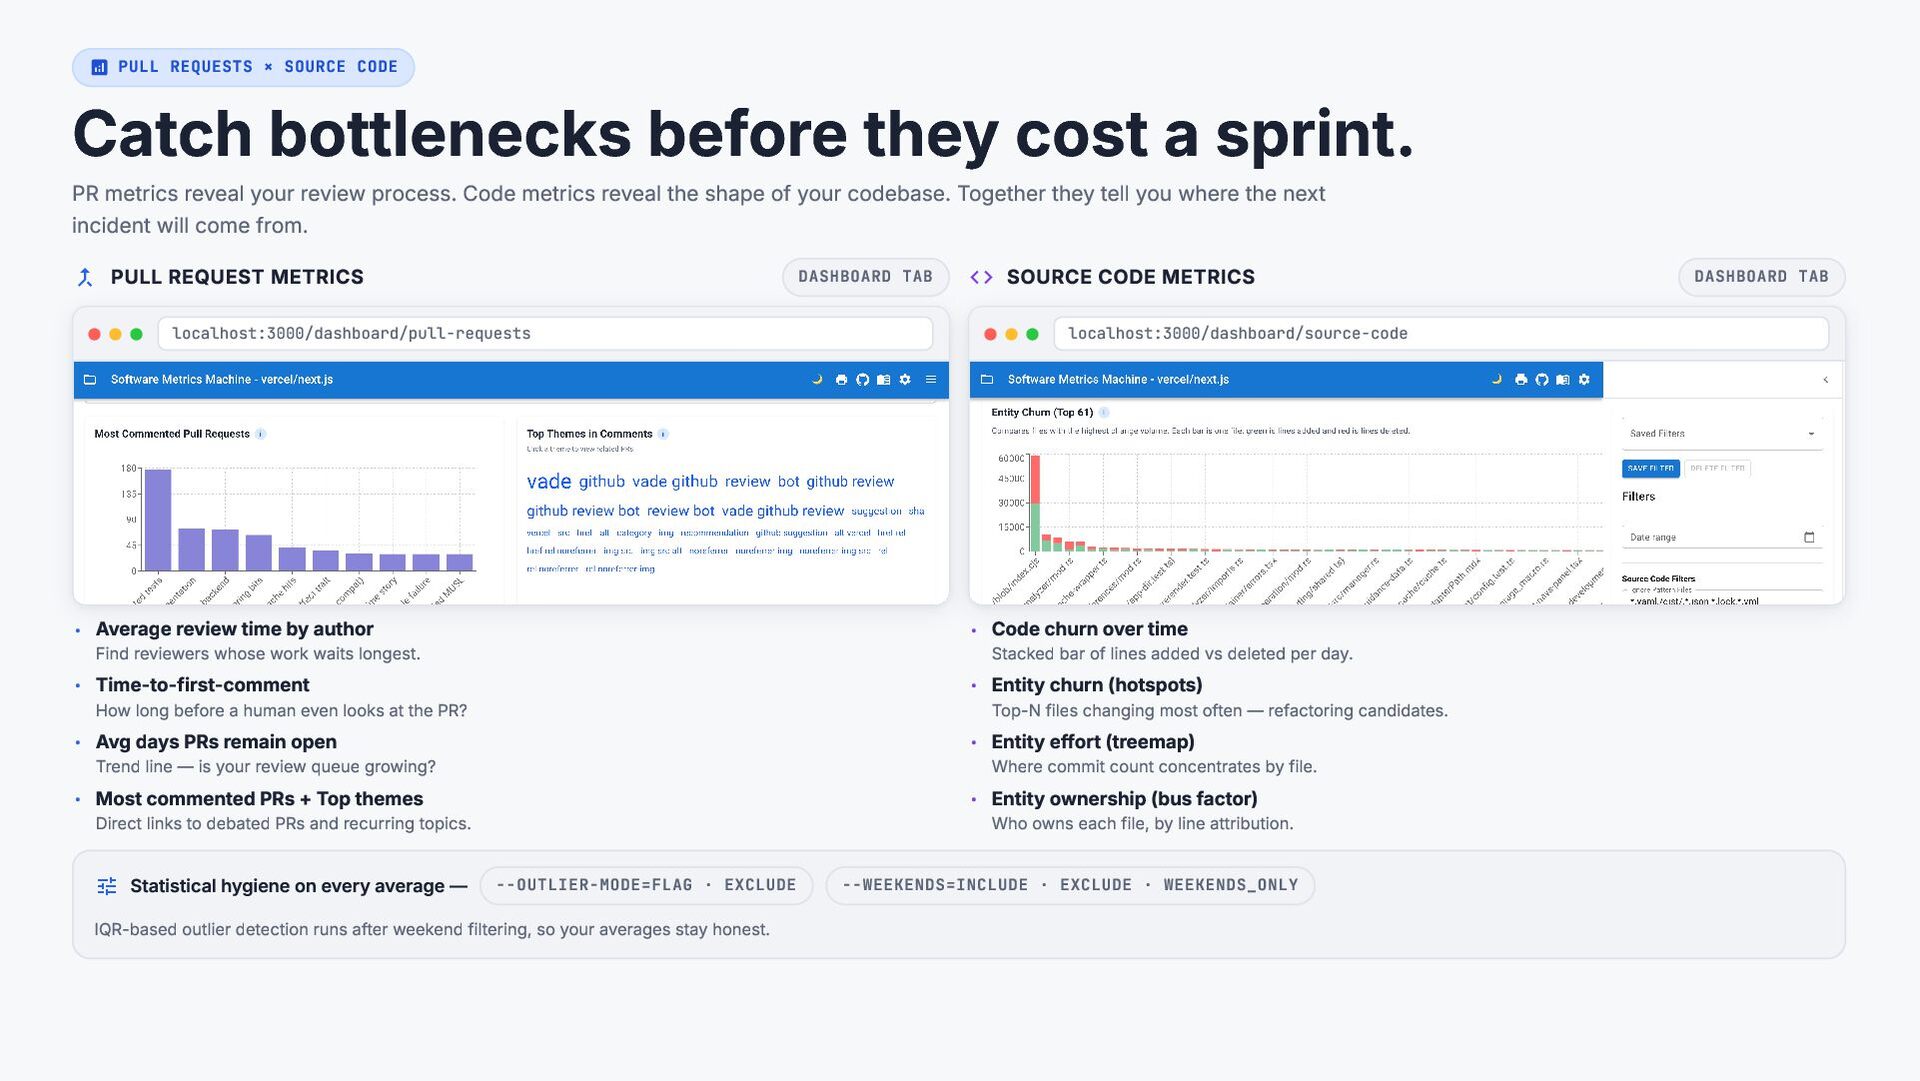
  7. analytics PULL REQUESTS × SOURCE CODE Catch bottlenecks before they

    cost a sprint. PR metrics reveal your review process. Code metrics reveal the shape of your codebase. Together they tell you where the next incident will come from. merge_type PULL REQUEST METRICS DASHBOARD TAB localhost:3000/dashboard/pull-requests code SOURCE CODE METRICS localhost:3000/dashboard/source-code · Average review time by author · Code churn over time · Time-to-first-comment · Entity churn (hotspots) · Avg days PRs remain open · Entity effort (treemap) · Most commented PRs + Top themes · Entity ownership (bus factor) Find reviewers whose work waits longest. Stacked bar of lines added vs deleted per day. How long before a human even looks at the PR? Top-N files changing most often — refactoring candidates. Trend line — is your review queue growing? Where commit count concentrates by file. Direct links to debated PRs and recurring topics. tune Statistical hygiene on every average — Who owns each file, by line attribution. --OUTLIER-MODE=FLAG · EXCLUDE IQR-based outlier detection runs after weekend filtering, so your averages stay honest. --WEEKENDS=INCLUDE · EXCLUDE · WEEKENDS_ONLY DASHBOARD TAB
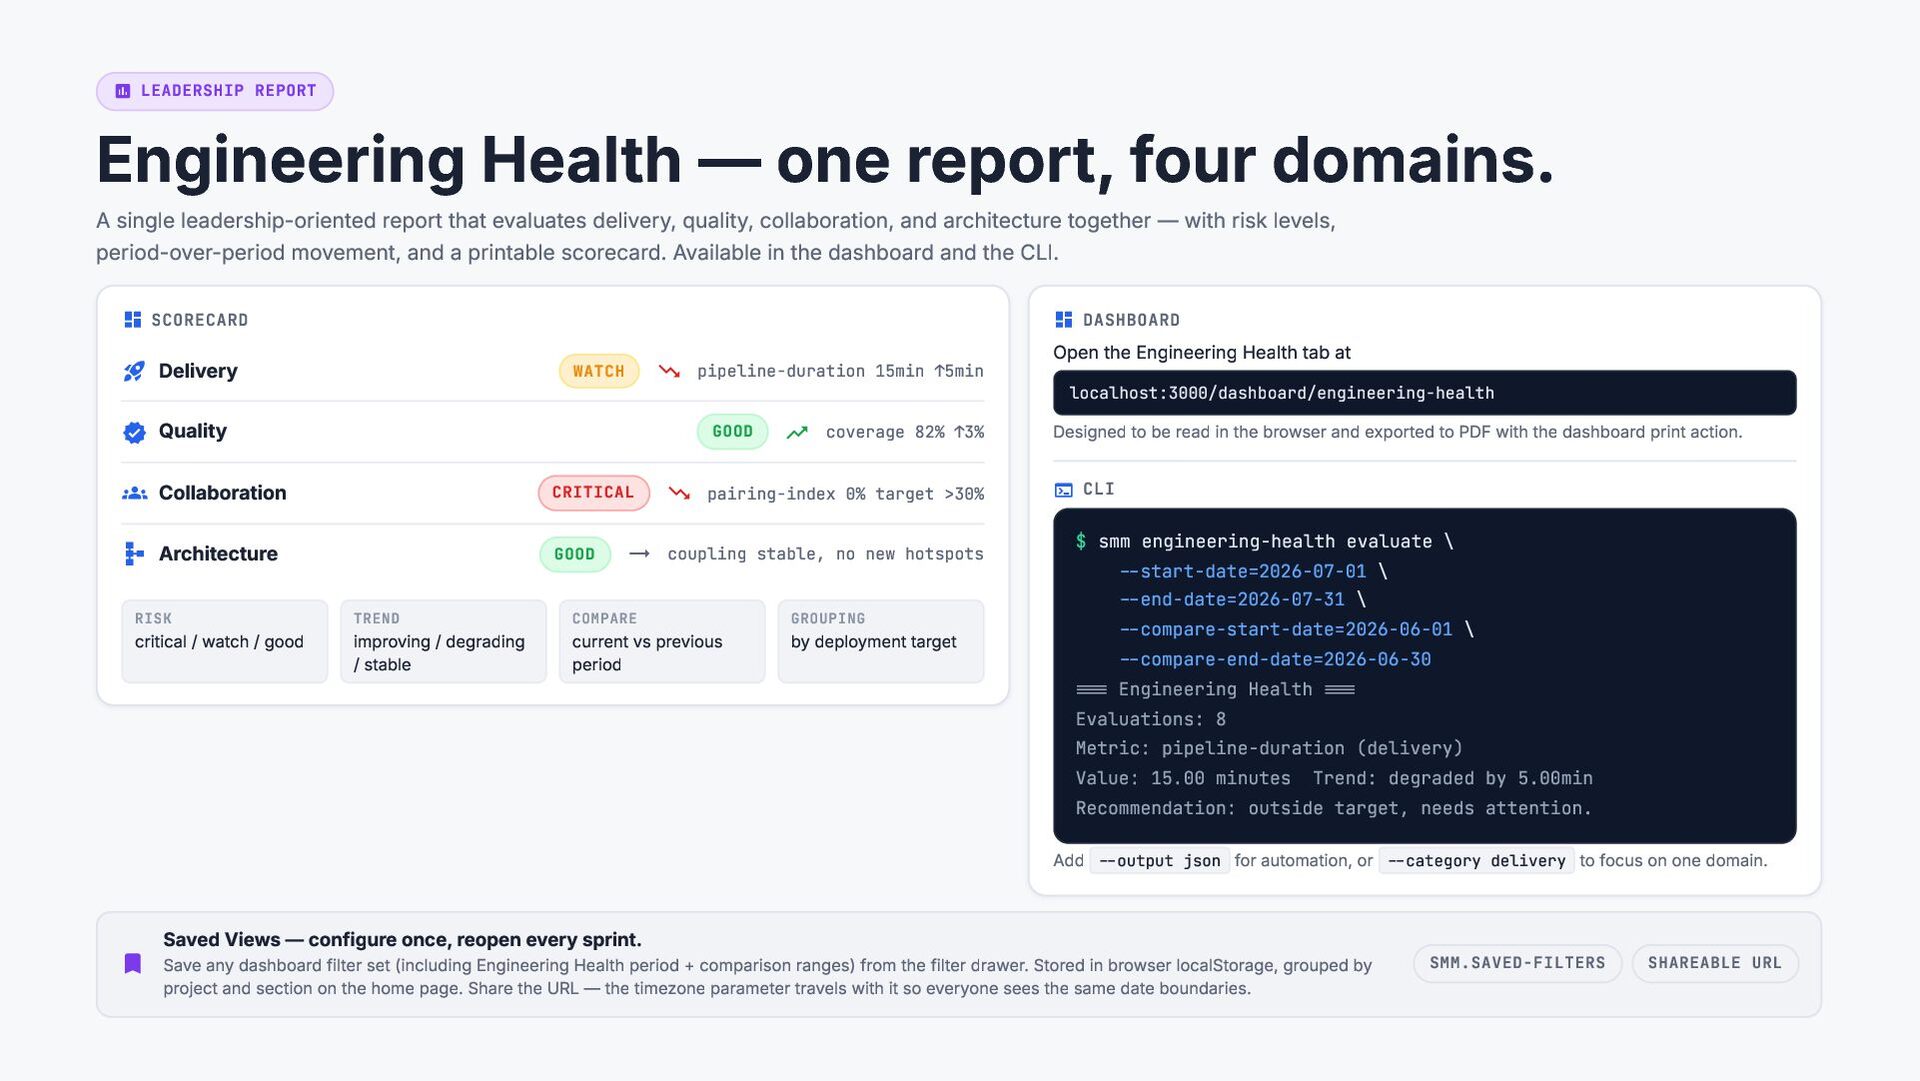
  8. assessment LEADERSHIP REPORT Engineering Health — one report, four domains.

    A single leadership-oriented report that evaluates delivery, quality, collaboration, and architecture together — with risk levels, period-over-period movement, and a printable scorecard. Available in the dashboard and the CLI. dashboard SCORECARD dashboard DASHBOARD rocket_launch Delivery trending_down pipeline-duration 15min ↑5min WATCH verified Quality GOOD groups Collaboration CRITICAL schema Architecture GOOD RISK critical / watch / good TREND improving / degrading / stable trending_up coverage 82% ↑3% trending_down pairing-index 0% target >30% trending_flat coupling stable, no new hotspots COMPARE current vs previous period GROUPING by deployment target Open the Engineering Health tab at localhost:3000/dashboard/engineering-health Designed to be read in the browser and exported to PDF with the dashboard print action. terminal CLI $ smm engineering-health evaluate \ --start-date=2026-07-01 \ --end-date=2026-07-31 \ --compare-start-date=2026-06-01 \ --compare-end-date=2026-06-30 === Engineering Health === Evaluations: 8 Metric: pipeline-duration (delivery) Value: 15.00 minutes Trend: degraded by 5.00min Recommendation: outside target, needs attention. Add --output json for automation, or --category delivery to focus on one domain. Saved Views — configure once, reopen every sprint. bookmark Save any dashboard filter set (including Engineering Health period + comparison ranges) from the filter drawer. Stored in browser localStorage, grouped by project and section on the home page. Share the URL — the timezone parameter travels with it so everyone sees the same date boundaries. SMM.SAVED-FILTERS SHAREABLE URL
  9. auto_awesome WHY IT MATTERS From dashboards to better engineering habits.

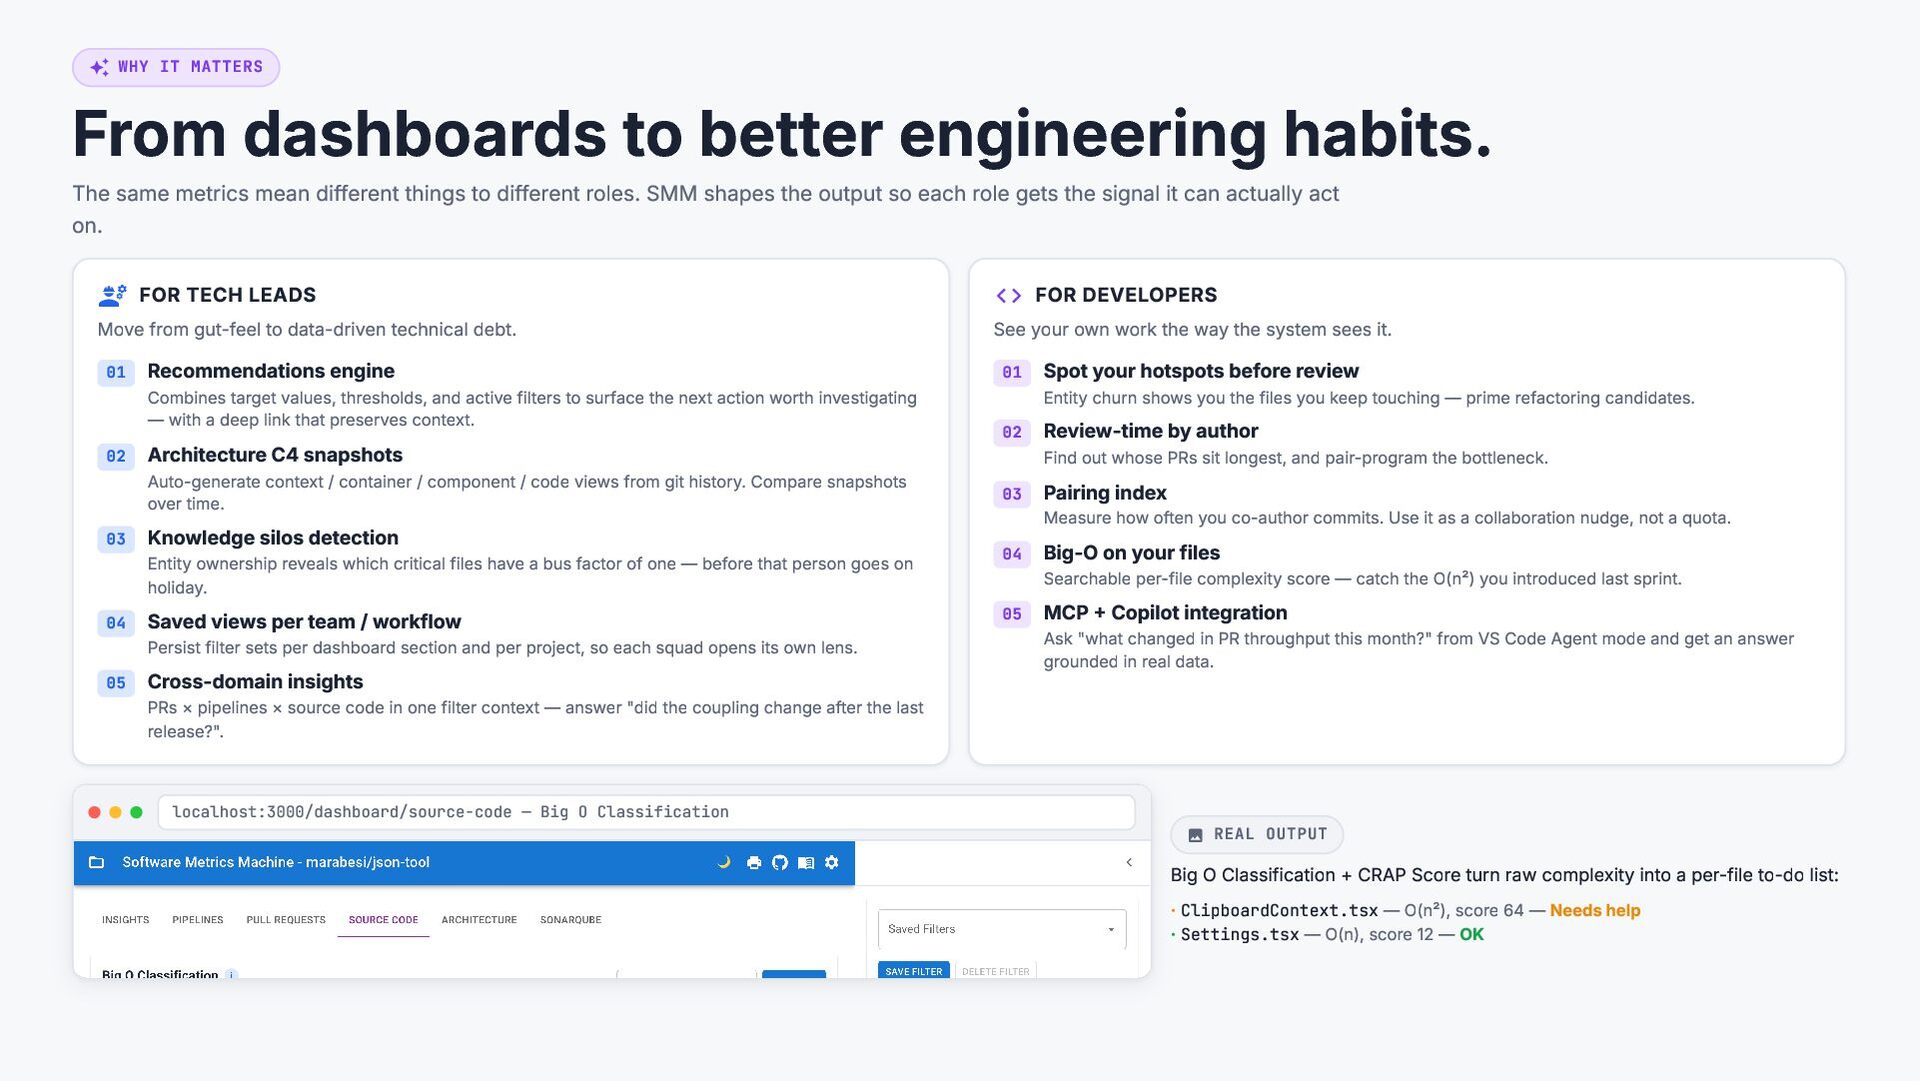
    The same metrics mean different things to different roles. SMM shapes the output so each role gets the signal it can actually act on. engineering FOR TECH LEADS Move from gut-feel to data-driven technical debt. 01 Recommendations engine 02 Architecture C4 snapshots 03 Combines target values, thresholds, and active filters to surface the next action worth investigating — with a deep link that preserves context. Auto-generate context / container / component / code views from git history. Compare snapshots over time. Knowledge silos detection Entity ownership reveals which critical files have a bus factor of one — before that person goes on holiday. 04 Saved views per team / workflow 05 Cross-domain insights Persist filter sets per dashboard section and per project, so each squad opens its own lens. code FOR DEVELOPERS See your own work the way the system sees it. 01 Spot your hotspots before review 02 Review-time by author 03 Pairing index 04 Big-O on your files 05 MCP + Copilot integration Entity churn shows you the files you keep touching — prime refactoring candidates. Find out whose PRs sit longest, and pair-program the bottleneck. Measure how often you co-author commits. Use it as a collaboration nudge, not a quota. Searchable per-file complexity score — catch the O(n²) you introduced last sprint. Ask "what changed in PR throughput this month?" from VS Code Agent mode and get an answer grounded in real data. PRs × pipelines × source code in one filter context — answer "did the coupling change after the last release?". localhost:3000/dashboard/source-code — Big O Classification image REAL OUTPUT Big O Classification + CRAP Score turn raw complexity into a per-file to-do list: · ClipboardContext.tsx — O(n²), score 64 — Needs help · Settings.tsx — O(n), score 12 — OK
  10. flag RECAP Where to find us — and what to

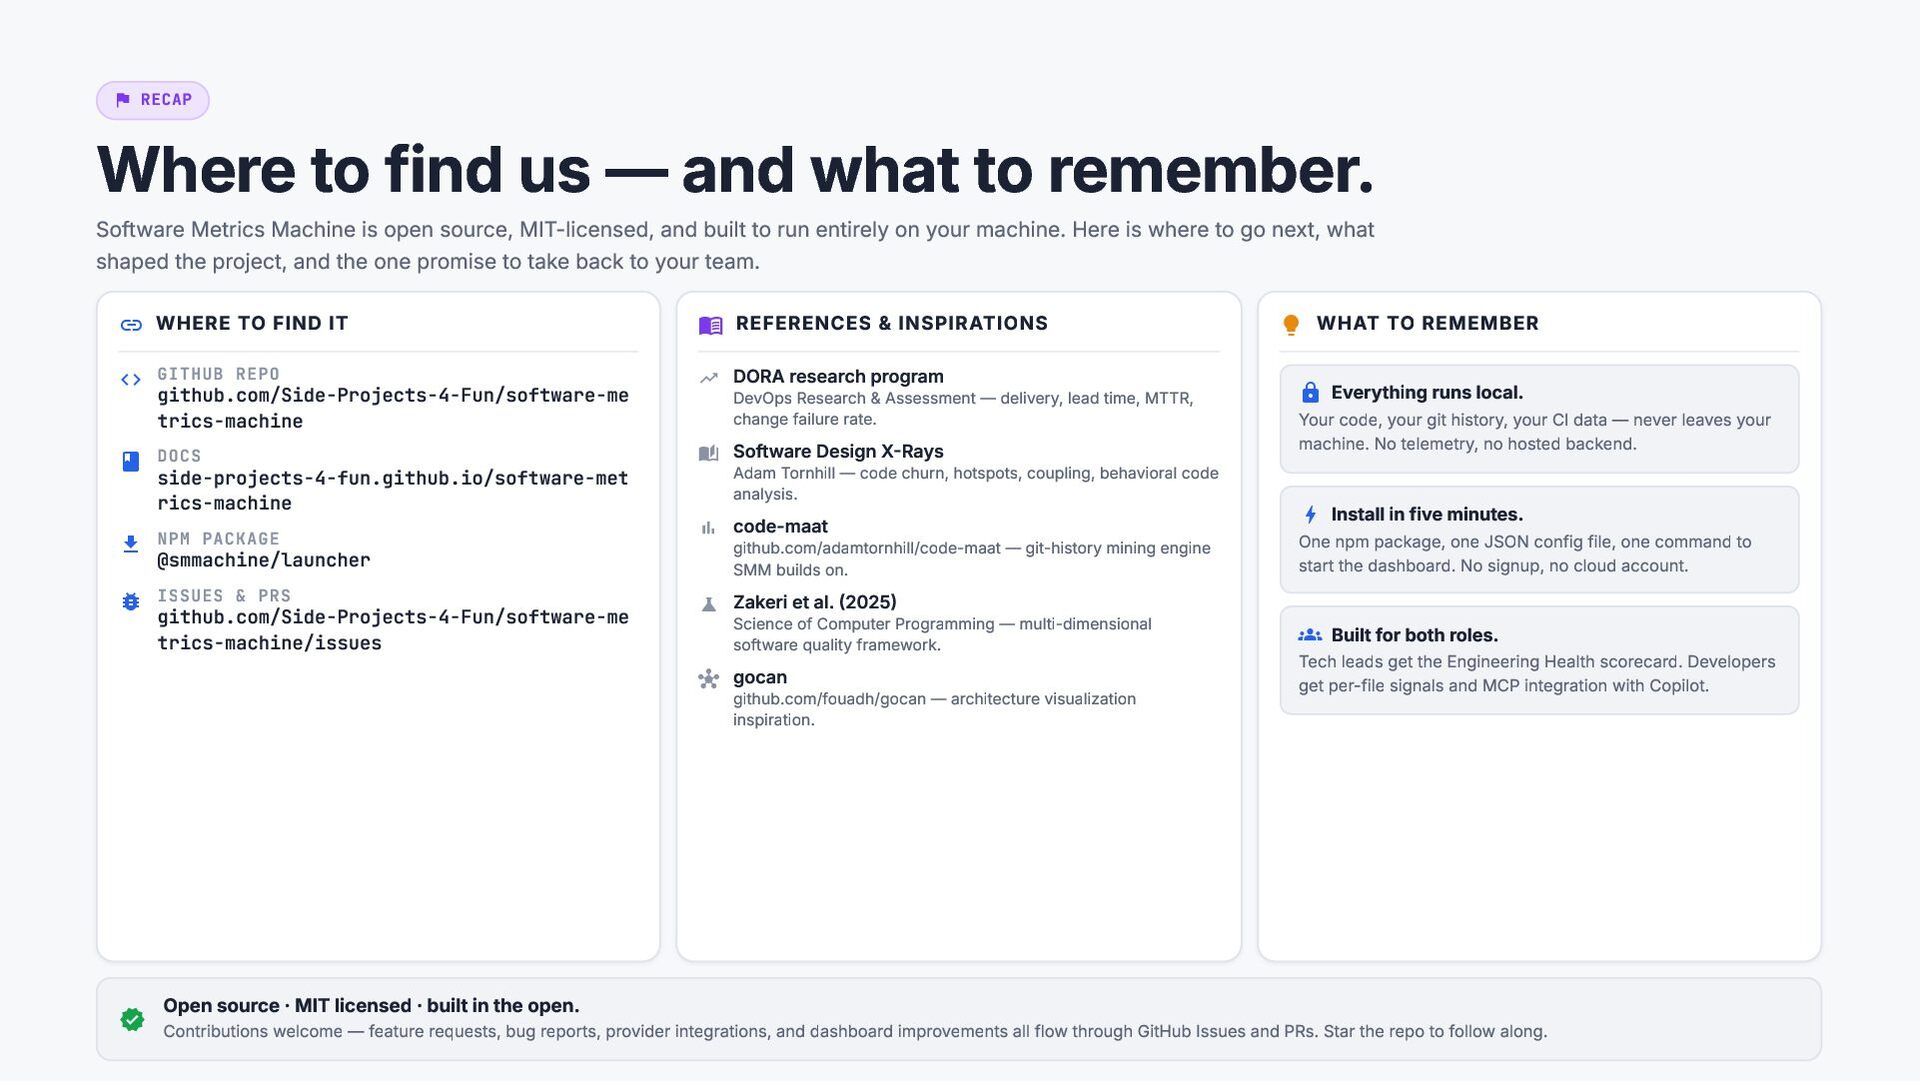
    remember. Software Metrics Machine is open source, MIT-licensed, and built to run entirely on your machine. Here is where to go next, what shaped the project, and the one promise to take back to your team. link WHERE TO FIND IT menu_book REFERENCES & INSPIRATIONS REPO code GITHUB github.com/Side-Projects-4-Fun/software-me trending_up DORA research program DevOps Research & Assessment — delivery, lead time, MTTR, change failure rate. book DOCS side-projects-4-fun.github.io/software-met auto_stories Software Design X-Rays Adam Tornhill — code churn, hotspots, coupling, behavioral code analysis. trics-machine rics-machine NPM PACKAGE download @smmachine/launcher & PRS bug_report ISSUES github.com/Side-Projects-4-Fun/software-me trics-machine/issues bar_chart code-maat github.com/adamtornhill/code-maat — git-history mining engine SMM builds on. science Zakeri et al. (2025) Science of Computer Programming — multi-dimensional software quality framework. hub gocan github.com/fouadh/gocan — architecture visualization inspiration. Open source · MIT licensed · built in the open. lightbulb WHAT TO REMEMBER lock Everything runs local. Your code, your git history, your CI data — never leaves your machine. No telemetry, no hosted backend. bolt Install in five minutes. One npm package, one JSON config file, one command to start the dashboard. No signup, no cloud account. groups Built for both roles. Tech leads get the Engineering Health scorecard. Developers get per-file signals and MCP integration with Copilot. verified Contributions welcome — feature requests, bug reports, provider integrations, and dashboard improvements all flow through GitHub Issues and PRs. Star the repo to follow along.
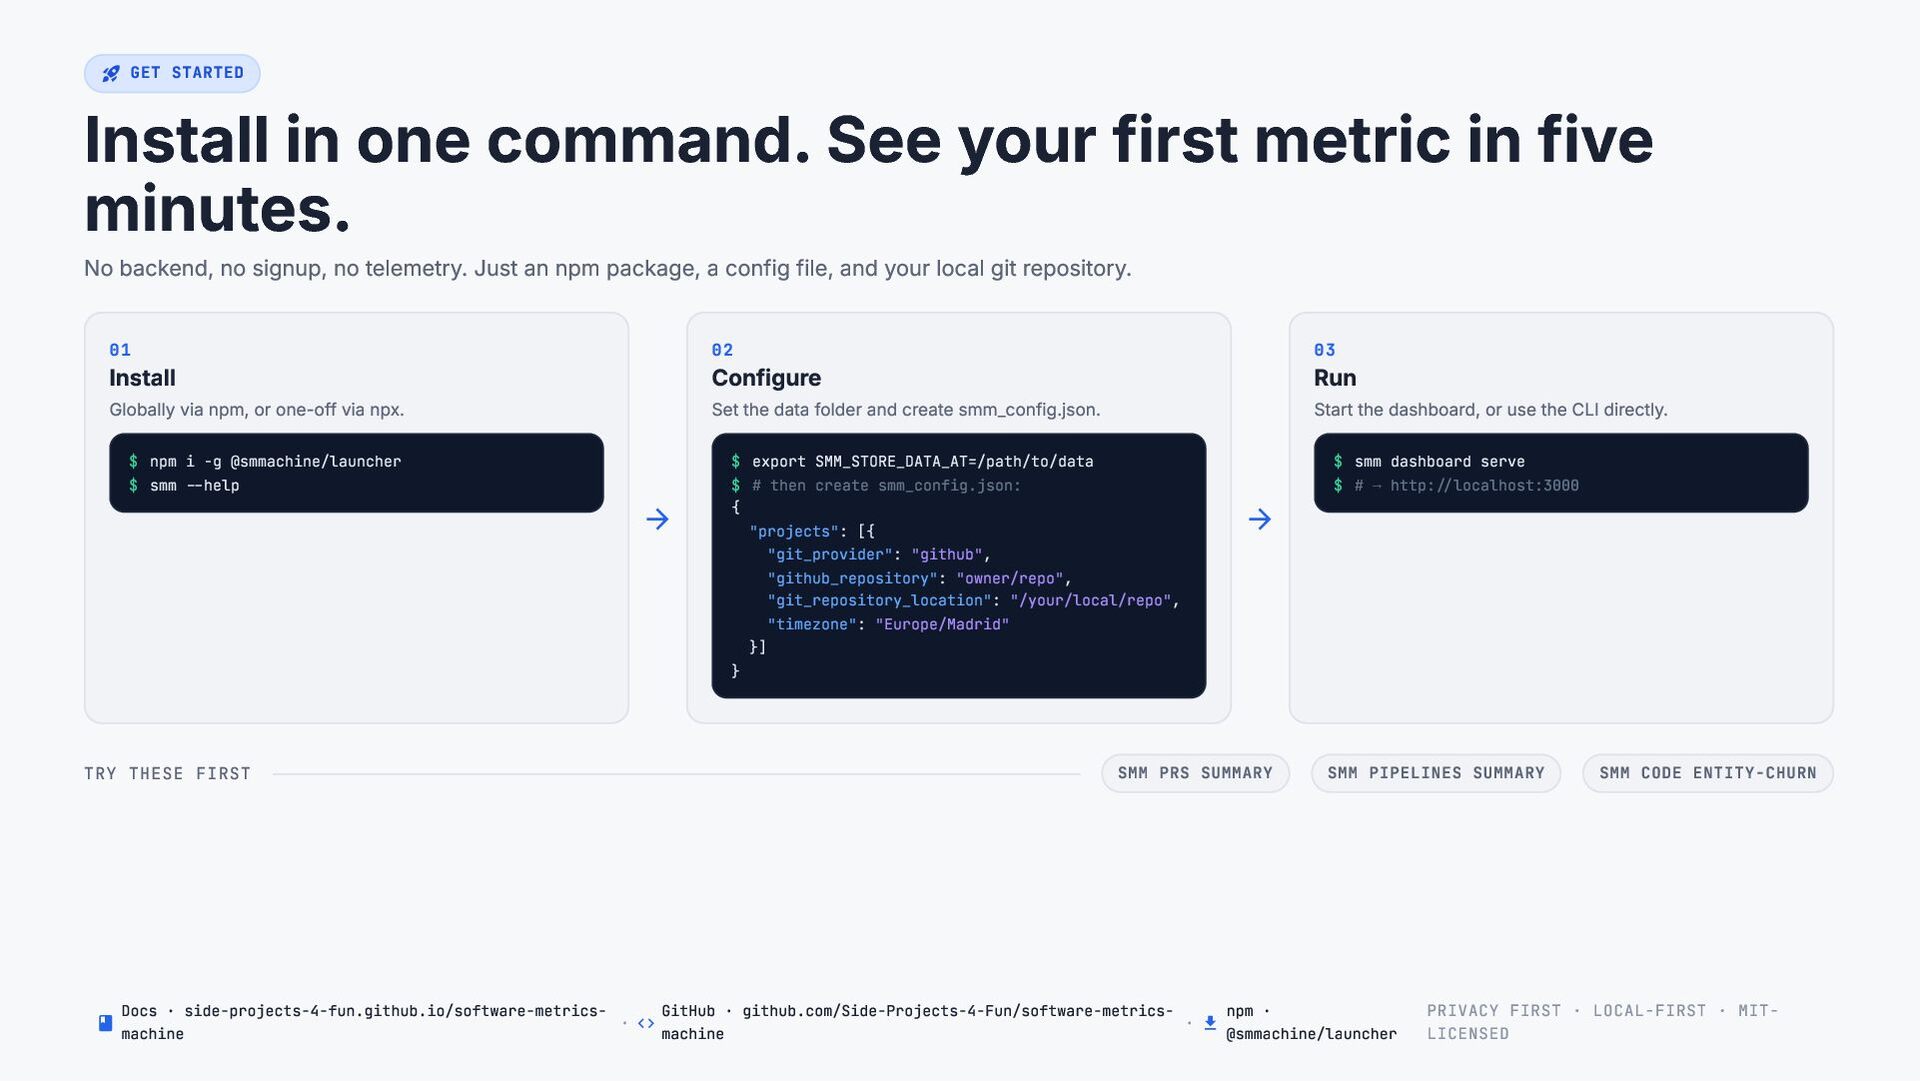
  11. rocket_launch GET STARTED Install in one command. See your first

    metric in five minutes. No backend, no signup, no telemetry. Just an npm package, a config file, and your local git repository. 01 02 03 Globally via npm, or one-off via npx. Set the data folder and create smm_config.json. Start the dashboard, or use the CLI directly. Install Configure $ npm i -g @smmachine/launcher $ smm --help arrow_forward Docs · side-projects-4-fun.github.io/software-metrics- $ export SMM_STORE_DATA_AT=/path/to/data $ # then create smm_config.json: { "projects": [{ "git_provider": "github", "github_repository": "owner/repo", "git_repository_location": "/your/local/repo", "timezone": "Europe/Madrid" }] } $ smm dashboard serve $ # → http://localhost:3000 arrow_forward SMM PRS SUMMARY TRY THESE FIRST book machine Run · code SMM PIPELINES SUMMARY GitHub · github.com/Side-Projects-4-Fun/software-metricsnpm · · download machine @smmachine/launcher SMM CODE ENTITY-CHURN PRIVACY FIRST · LOCAL-FIRST · MITLICENSED