Upgrade to Pro
— share decks privately, control downloads, hide ads and more …
Speaker Deck
Features
Speaker Deck
PRO
Sign in
Sign up for free
Search
Search
Lightning Talk Prometheus
Search
Mattias Gees
March 01, 2018
Programming
69
0
Share
Embed
Copy iframe code
Copy JS code
Copy link
Start on current slide
Lightning Talk Prometheus
Lightning talk I gave internally at Skyscrapers about Prometheus.
Mattias Gees
March 01, 2018
More Decks by Mattias Gees
See All by Mattias Gees
A Cloud Native Journey At Scale (Belgium Kubernetes Meetup)
mattiasgees
0
47
Tarmak, why do we need another Kubernetes provisioner?
mattiasgees
1
270
Pod autoscaling with custom-metrics
mattiasgees
0
78
Terraform workspaces
mattiasgees
0
110
Introduction to Ansible
mattiasgees
0
120
Other Decks in Programming
See All in Programming
『コードを書く以外の』エンジニアリング〜課金基盤移行プロジェクト推進のためのTips4選
yuriko1211
0
510
The Bowling Game - From Imperative to Functional Programming - Part 1
philipschwarz
PRO
0
330
광주소프트웨어마이스터고등학교 DevFest 특강 - 바이브 코딩 시대에서 주니어 개발자로 살아남는 방법
utilforever
1
140
分散システム、なんですぐ死んでしまうん?耐障害性を高めたいあなたのためのレジリエンスパターン入門
mshibuya
7
6.4k
PHP Application における Kubernetes 内 gRPC 通信
ganchiku
0
500
そのテスト、説明できますか?~LWテスト戦略FW~のご紹介
nakahara
0
210
霧の中の代数的エフェクト
funnyycat
1
410
【やさしく解説 設計編 #0】DDDのコード、読めるのに分からない人へ
panda728
PRO
2
270
AI 輔助遺留系統現代化的經驗分享
jame2408
1
1.2k
Performance Engineering for Everyone
elenatanasoiu
0
270
ランチタイムLT会3周年!ランチタイムLT会を3年間続けられたお話
y0hgi
1
140
ソフトウェア設計に溶けるインフラ ― AWS CDK のインフラ認識論
konokenj
2
560
Featured
See All Featured
How Software Deployment tools have changed in the past 20 years
geshan
0
34k
The Art of Programming - Codeland 2020
erikaheidi
57
14k
Save Time (by Creating Custom Rails Generators)
garrettdimon
PRO
32
3.9k
Faster Mobile Websites
deanohume
310
32k
Raft: Consensus for Rubyists
vanstee
141
7.6k
Being A Developer After 40
akosma
91
590k
Introduction to Domain-Driven Design and Collaborative software design
baasie
1
900
Exploring anti-patterns in Rails
aemeredith
3
450
The Curse of the Amulet
leimatthew05
2
13k
Six Lessons from altMBA
skipperchong
29
4.3k
Git: the NoSQL Database
bkeepers
PRO
432
67k
Leveraging Curiosity to Care for An Aging Population
cassininazir
1
400
Transcript
Prometheus Mattias Gees
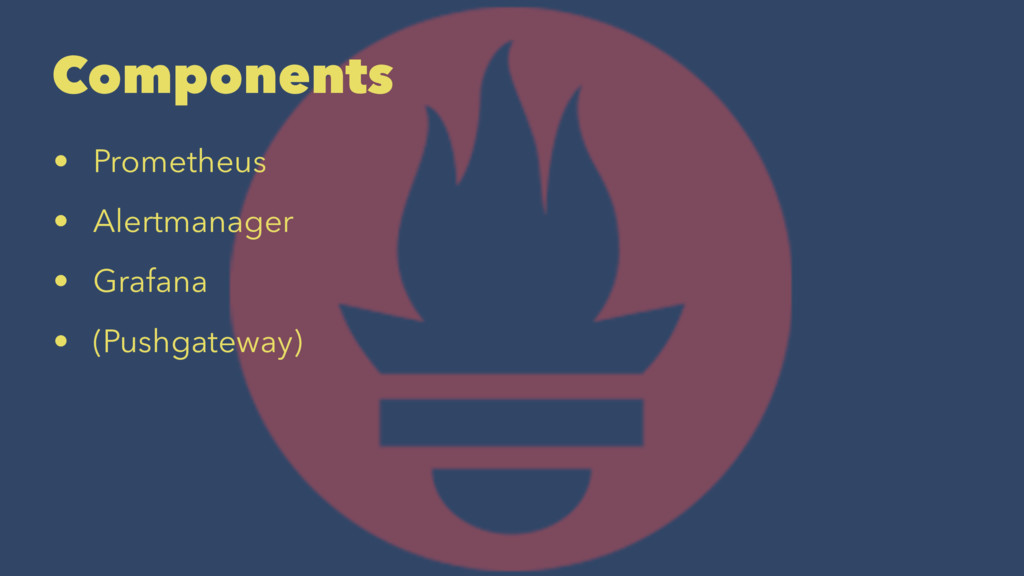
Components • Prometheus • Alertmanager • Grafana • (Pushgateway)
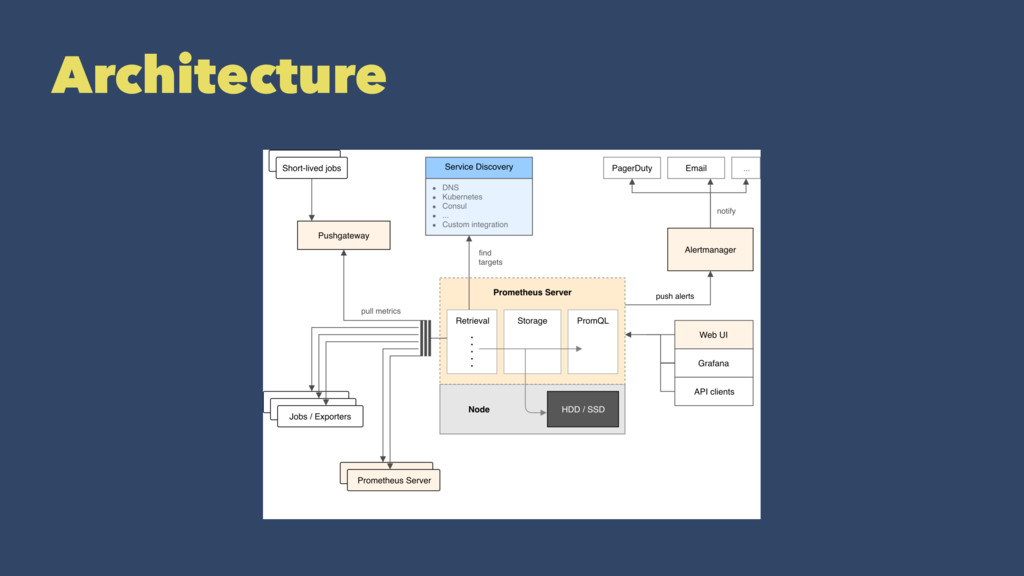
Architecture
Time series database!
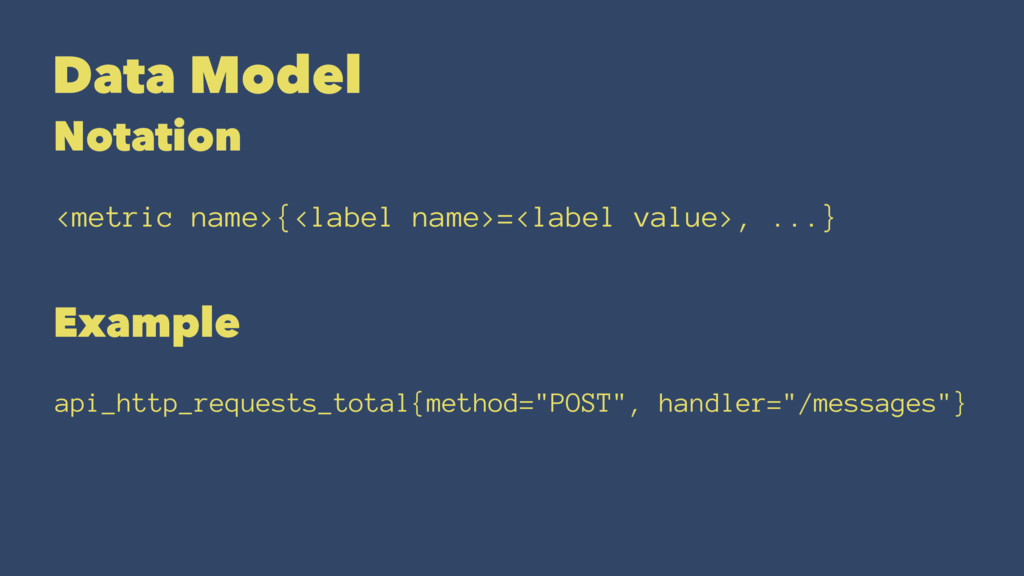
Data Model Notation <metric name>{<label name>=<label value>, ...} Example api_http_requests_total{method="POST",
handler="/messages"}
Metric Types • Counter • Gauge • Histogram • Summary
Metrics gathering /metrics
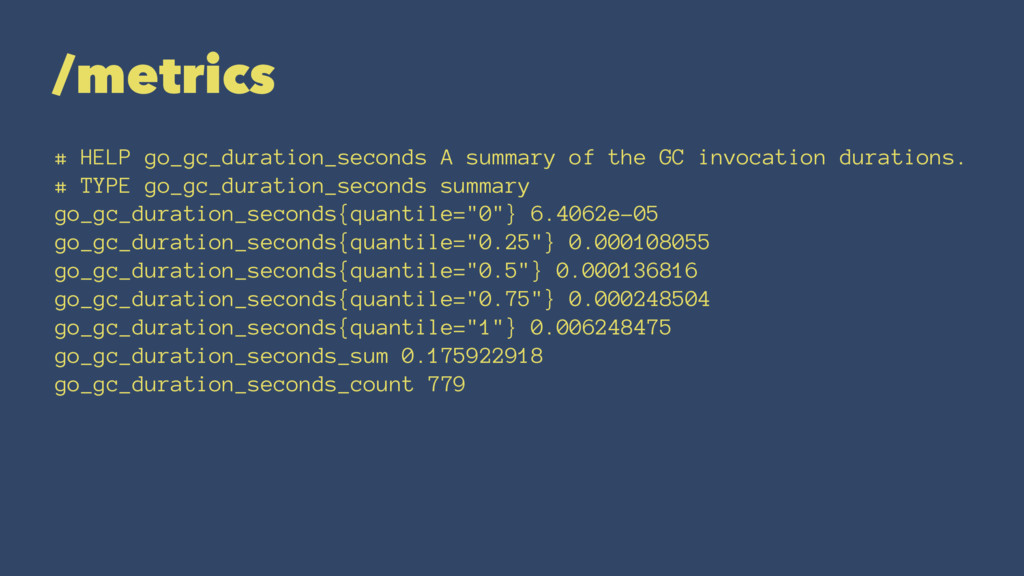
/metrics # HELP go_gc_duration_seconds A summary of the GC invocation
durations. # TYPE go_gc_duration_seconds summary go_gc_duration_seconds{quantile="0"} 6.4062e-05 go_gc_duration_seconds{quantile="0.25"} 0.000108055 go_gc_duration_seconds{quantile="0.5"} 0.000136816 go_gc_duration_seconds{quantile="0.75"} 0.000248504 go_gc_duration_seconds{quantile="1"} 0.006248475 go_gc_duration_seconds_sum 0.175922918 go_gc_duration_seconds_count 779
Push & Pull • Client library • Exporters • Software
directly • Push based
Client library • Implemented in application • Standard metrics (some)
• Custom metrics
Client library Official • Go • Java or Scala •
Python • Ruby
Client library Unofficial • Bash • Node.JS • PHP •
...
Exporters • Converts application metrics to prometheus formatted Metrics •
3rd party applications • Databases, middleware, messaging systems, APIs, logging, ...
Exporters Examples • MySQL • Mongo • Elasticsearch • Ubiquiti
UniFi exporter • RabbitMQ exporter • Apache exporter
Exporters Examples • PHP-FPM exporter • Nginx exporter • AWS
ECS exporter • AWS SQS exporter • Fluentd exporter • Grok exporter
Software directly • Etcd • Kubernetes • Neo4j • ...
Push • Short lived processes • crons • batch •
Pushgateway
Config
Service discovery • Kubernetes • EC2 • DNS • File
• ...
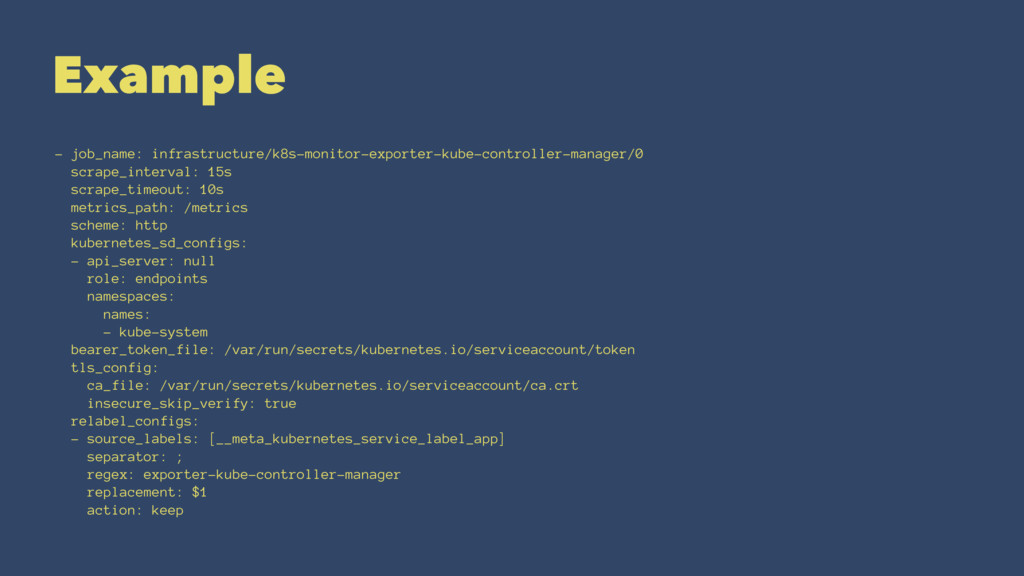
Example - job_name: infrastructure/k8s-monitor-exporter-kube-controller-manager/0 scrape_interval: 15s scrape_timeout: 10s metrics_path: /metrics
scheme: http kubernetes_sd_configs: - api_server: null role: endpoints namespaces: names: - kube-system bearer_token_file: /var/run/secrets/kubernetes.io/serviceaccount/token tls_config: ca_file: /var/run/secrets/kubernetes.io/serviceaccount/ca.crt insecure_skip_verify: true relabel_configs: - source_labels: [__meta_kubernetes_service_label_app] separator: ; regex: exporter-kube-controller-manager replacement: $1 action: keep
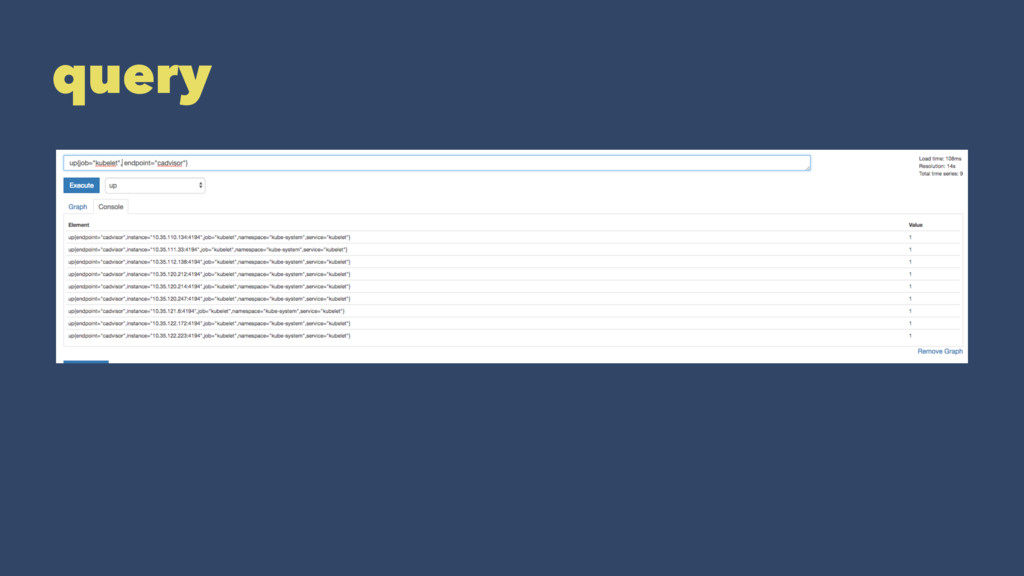
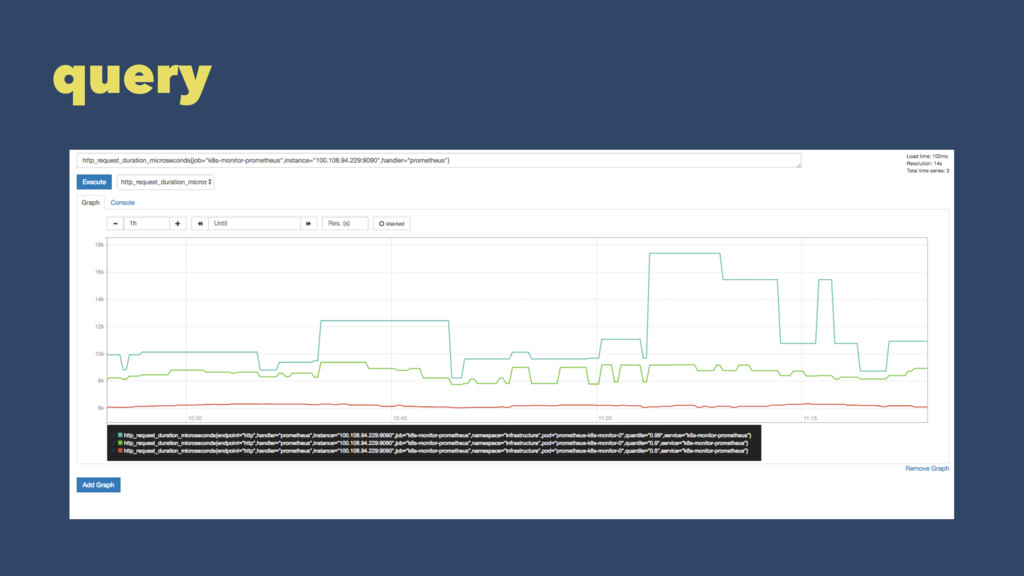
query
query
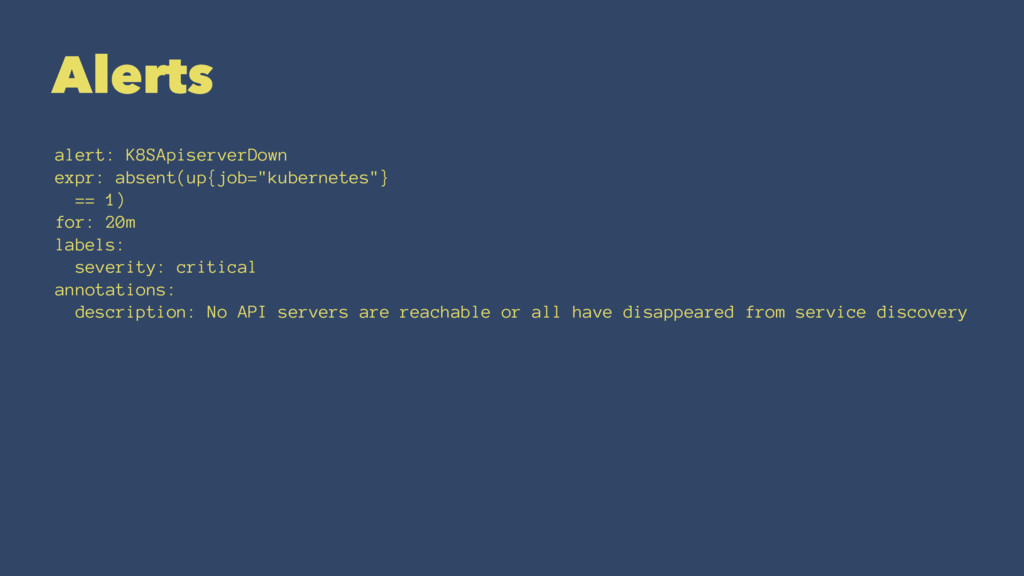
Alerts alert: K8SApiserverDown expr: absent(up{job="kubernetes"} == 1) for: 20m labels:
severity: critical annotations: description: No API servers are reachable or all have disappeared from service discovery
Alertmanager
Alertmanager • Global config • Route • Receivers • Templates
Alertmanager Route route: receiver: opsgenie group_by: - job routes: -
receiver: slack match: severity: warning - receiver: opsgenieproxy match: alertname: DeadMansSwitch group_wait: 1s group_interval: 1s repeat_interval: 1s group_wait: 30s group_interval: 5m repeat_interval: 12h
Alertmanager Receivers receivers: - name: opsgenie opsgenie_configs: - send_resolved: true
api_key: <secret> api_host: https://api.opsgenie.com/ message: '{{ template "opsgenie.default.message" . }}' description: '{{ template "opsgenie.default.description" . }}' source: '{{ template "opsgenie.default.source" . }}' tags: sla_test,kubernetes,client_skyscrapers - name: opsgenieproxy webhook_configs: - send_resolved: false url: http://k8s-monitor-opsgenie-heartbeat-proxy/proxy - name: slack slack_configs: - send_resolved: true api_url: <secret> username: skyscrapers-test color: '{{ if eq .Status "firing" }}danger{{ else }}good{{ end }}' title: '{{ template "slack.default.title" . }}' title_link: '{{ template "slack.default.titlelink" . }}' pretext: '{{ template "slack.default.pretext" . }}' text: '{{ template "slack.default.text" . }}' fallback: '{{ template "slack.default.fallback" . }}' icon_emoji: '{{ template "slack.default.iconemoji" . }}' icon_url: '{{ template "slack.default.iconurl" . }}'
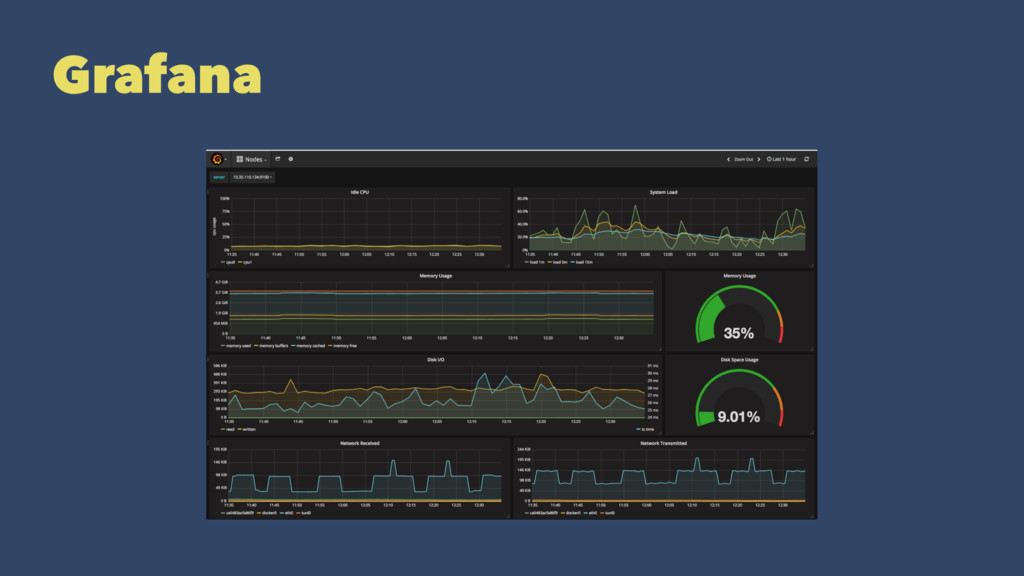
Grafana
Grafana
Others • Federation • Storage • Recording rules • Kubernetes
Questions?
More information https://prometheus.io/ Docs are good ;)