Upgrade to Pro — share decks privately, control downloads, hide ads and more …

Soil conditions for the best turf today

Micah Woods
November 06, 2019

Soil conditions for the best turf today

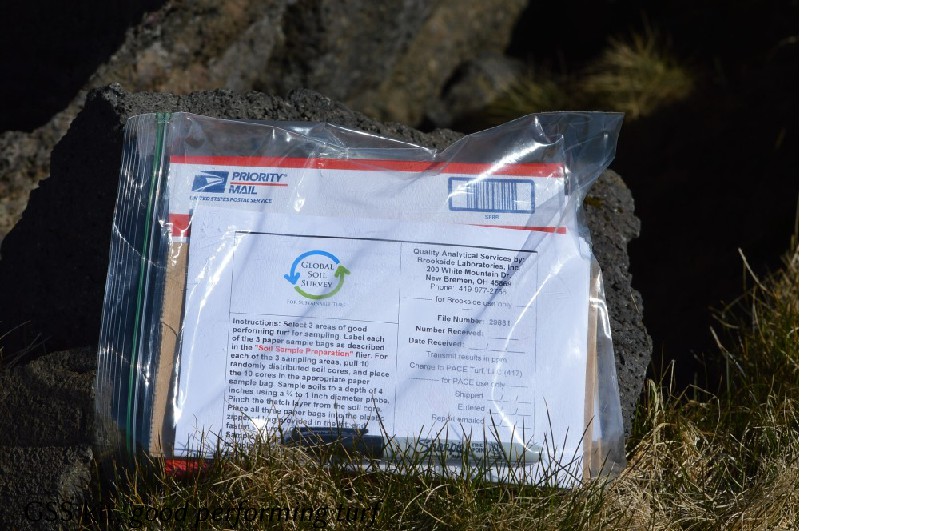
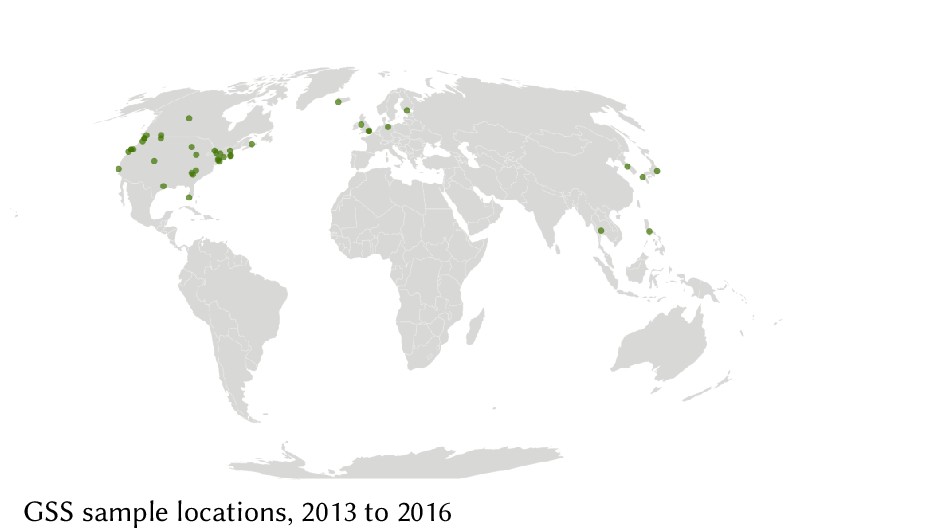
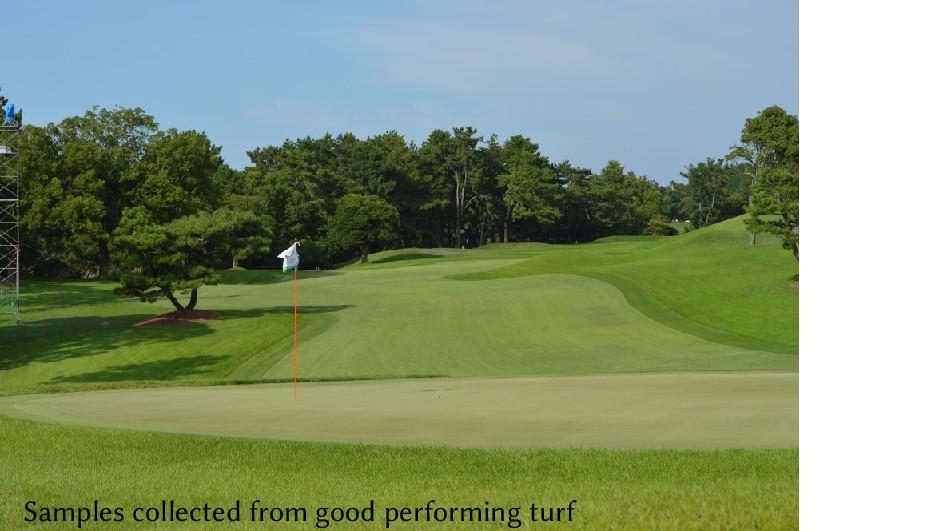
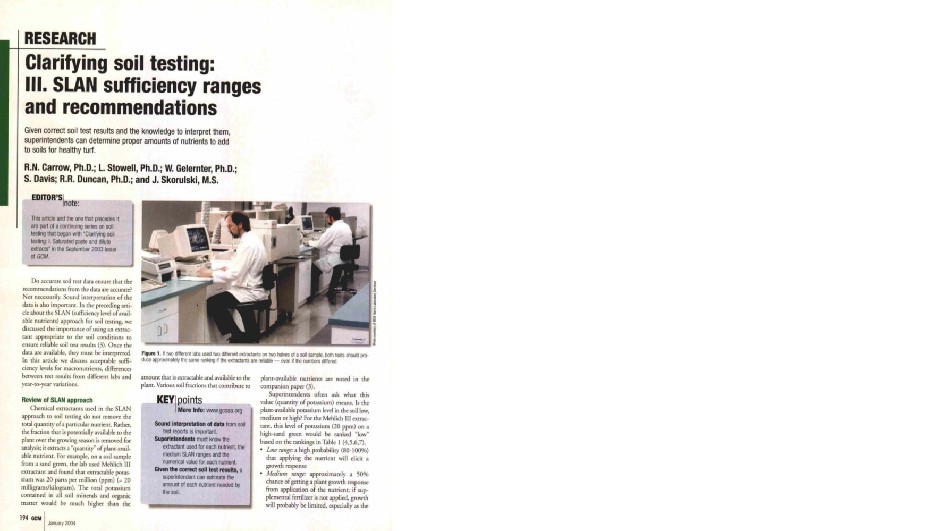
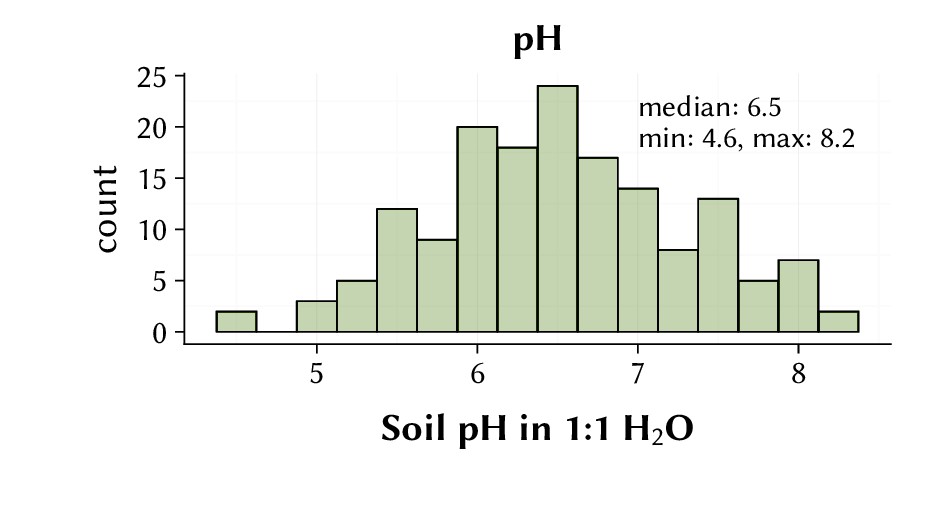
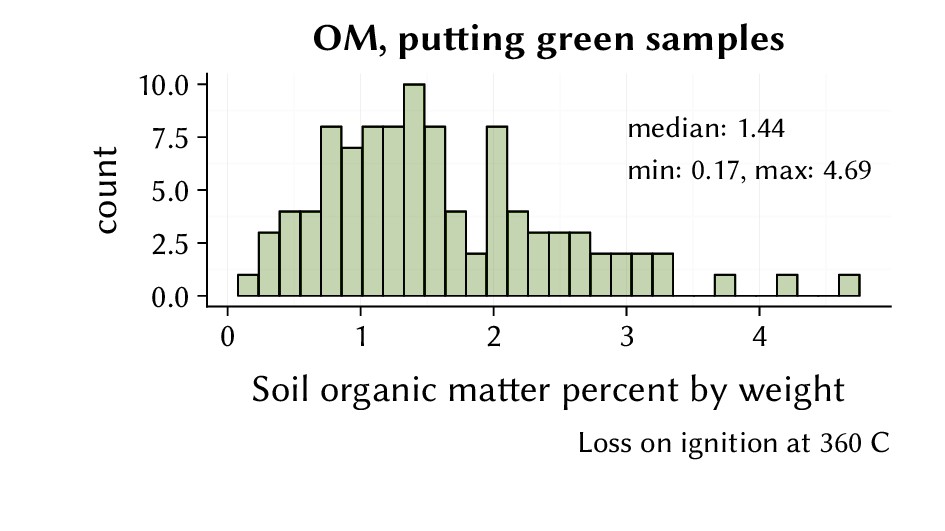
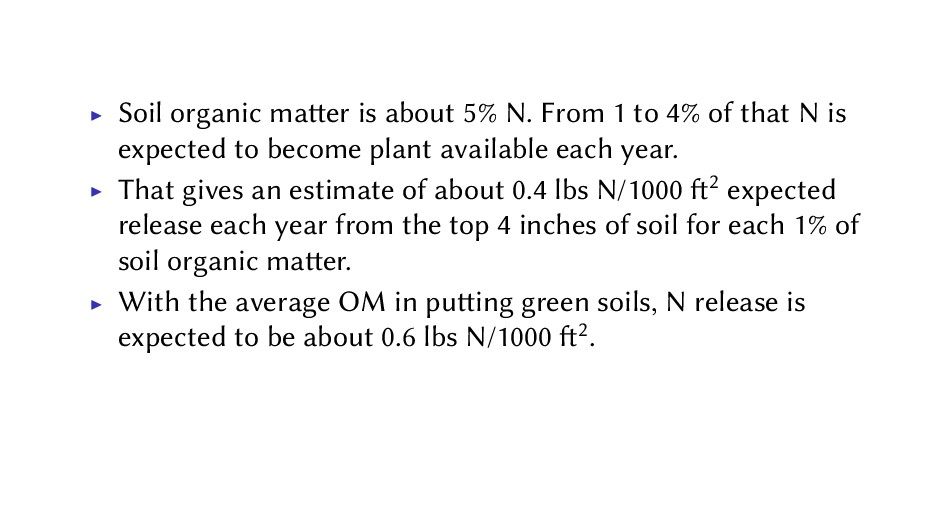
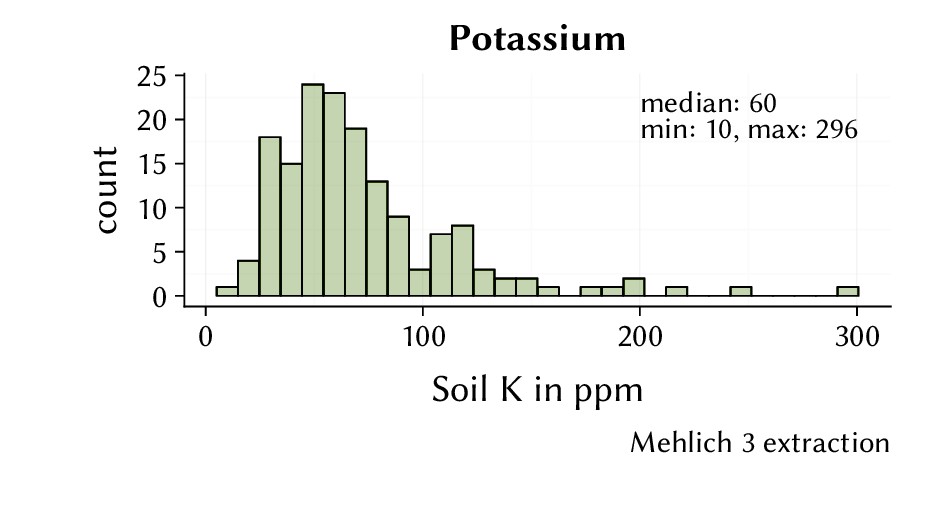
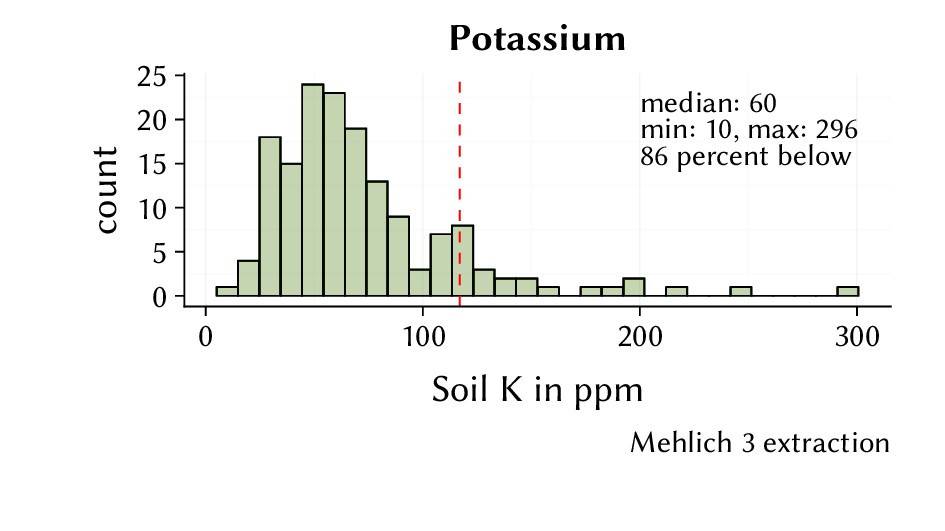
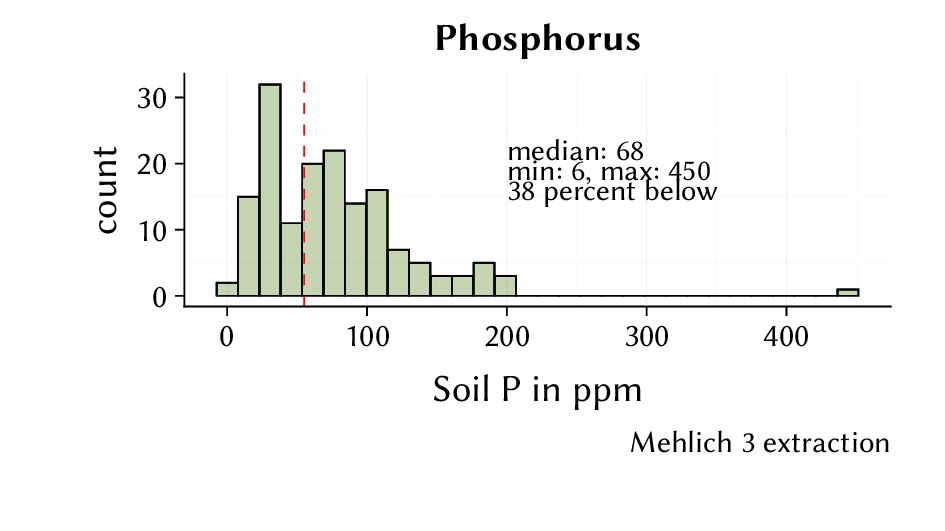
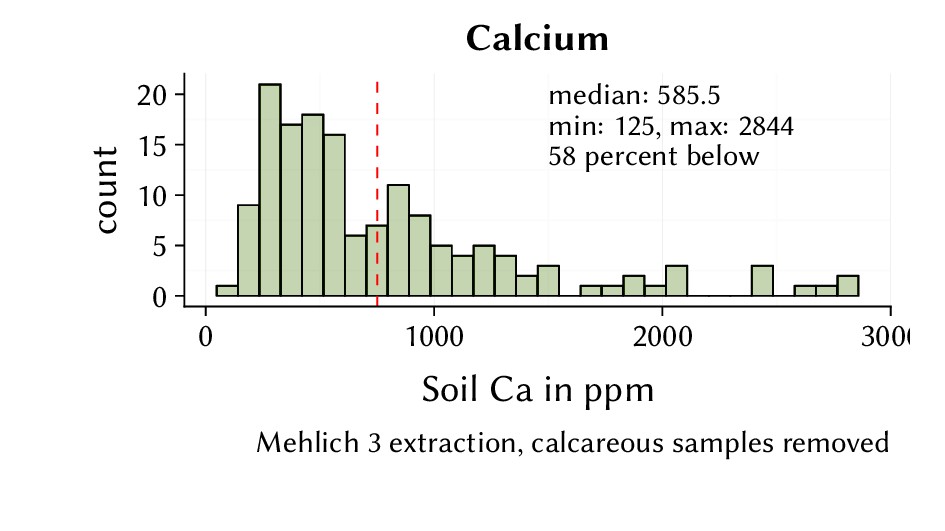
These slides were used in my presentation at the Oregon GCSA fall meeting. With Larry Stowell and Wendy Gelernter from PACE Turf, I helped to conduct the Global Soil Survey (GSS). This project invited turfgrass managers from around the world to submit samples from good-performing turf at their facilities. Based on an analysis of the properties of these samples, I have many interesting things to explain and to suggest about turfgrass nutrient management.

This is a different project than the well-known MLSN, although I’ve heard some people use the GSS and MLSN interchangeably. I explain exactly what the GSS is, what the results were, how the results compare to MLSN, and what the implications are for fine turf management in the current era.

Micah Woods

November 06, 2019
Tweet

More Decks by Micah Woods

Other Decks in Science

Transcript

  1. What kind of soils produce the best turf today? Micah

    Woods Chief Scientist Asian Turfgrass Center www.asianturfgrass.com November 6, 2019
  2. 1. Which data will we look at? 2. How will

    we look at the data? 3. Implications for pH, OM, K, P, Ca, Mg, salinity, micronutrients, and N
  3. 87 92 86 81 87 83 86 91 86 84

    82 84 86 88 90 92 18 hole score 10 random golf scores
  4. 82 84 86 88 90 92 18 hole score Dotplot

    of 10 random golf scores
  5. 0 1 2 3 80 82 84 86 88 90

    92 18 hole score count bin width = 1 Histogram of 10 random golf scores
  6. 0 1 2 3 4 5 80 82 84 86

    88 90 92 94 18 hole score count bin width = 3 Histogram of 10 random golf scores
  7. 87 92 86 81 87 83 86 91 86 84

    88 86 81 84 87 86 87 80 88 81 81 89 87 89 75 81 86 85 87 81 90 82 83 84 87 94 84 92 81 85 88 93 80 83 82 81 92 85 79 89 81 83 87 80 96 79 83 82 87 84 86 82 85 89 88 87 81 76 86 84 91 82 84 81 74 78 84 81 83 91 88 87 91 84 86 88 83 87 87 87 86 89 81 78 82 78 91 89 90 83 74 76 78 80 82 84 86 88 90 92 94 96 18 hole score 100 random golf scores
  8. 74 76 78 80 82 84 86 88 90 92

    94 96 18 hole score Dotplot of 100 random golf scores
  9. 0 5 10 74 76 78 80 82 84 86

    88 90 92 94 96 18 hole score count bin width = 1 Histogram of 100 random golf scores
  10. 0 10 20 30 74 76 78 80 82 84

    86 88 90 92 94 96 98 18 hole score count bin width = 3 Histogram of 100 random golf scores
  11. median: 6.5 min: 4.6, max: 8.2 0 5 10 15

    20 25 5 6 7 8 Soil pH in 1:1 H2O count pH
  12. median: 1.76 min: 0.17, max: 10.15 0 5 10 15

    20 0.0 2.5 5.0 7.5 10.0 Soil organic ma er percent by weight count OM, all samples Loss on ignition at 360 C
  13. median: 1.44 min: 0.17, max: 4.69 0.0 2.5 5.0 7.5

    10.0 0 1 2 3 4 Soil organic ma er percent by weight count OM, pu ing green samples Loss on ignition at 360 C
  14. ▶ Soil organic matter is about 5% N. From 1

    to 4% of that N is expected to become plant available each year. ▶ That gives an estimate of about 0.4 lbs N/1000 ft2 expected release each year from the top 4 inches of soil for each 1% of soil organic matter. ▶ With the average OM in putting green soils, N release is expected to be about 0.6 lbs N/1000 ft2.
  15. median: 60 min: 10, max: 296 0 5 10 15

    20 25 0 100 200 300 Soil K in ppm count Potassium Mehlich 3 extraction
  16. median: 60 min: 10, max: 296 86 percent below 0

    5 10 15 20 25 0 100 200 300 Soil K in ppm count Potassium Mehlich 3 extraction
  17. median: 68 min: 6, max: 450 38 percent below 0

    10 20 30 0 100 200 300 400 Soil P in ppm count Phosphorus Mehlich 3 extraction
  18. median: 585.5 min: 125, max: 2844 58 percent below 0

    5 10 15 20 0 1000 2000 3000 Soil Ca in ppm count Calcium Mehlich 3 extraction, calcareous samples removed
  19. median: 74 min: 23, max: 516 79 percent below 0

    10 20 30 0 100 200 300 400 500 Soil Mg in ppm count Magnesium Mehlich 3 extraction
  20. median: 0.66 min: 0.5, max: 1.5 100 percent below 0

    10 20 30 40 0.0 0.5 1.0 1.5 2.0 Soil salinity (EC) in dS/m count Soil salinity saturated paste equivalent from 1:2 soil:water
  21. median: 6.7 min: 0, max: 26 98 percent below 0

    5 10 15 20 25 0 10 20 Nitrate + ammonium in ppm count Available nitrogen
  22. Micronutrient median values • Iron: 198 ppm • Manganese: 27

    ppm • Zinc: 6 ppm • Copper: 3 ppm • Boron: 0.4 ppm