area from which a retail centre will attract its customers. • Our objective was to estimate retail catchment areas at small area level (LSOA) based on retail centre attractiveness while considering the position of a retail centre within a hierarchy of other retail centres.
Development of the parameters of the model i.e. an indicator of retail centre attractiveness and a measure of distance. • Development of the huff-tools library in R. • Model testing.
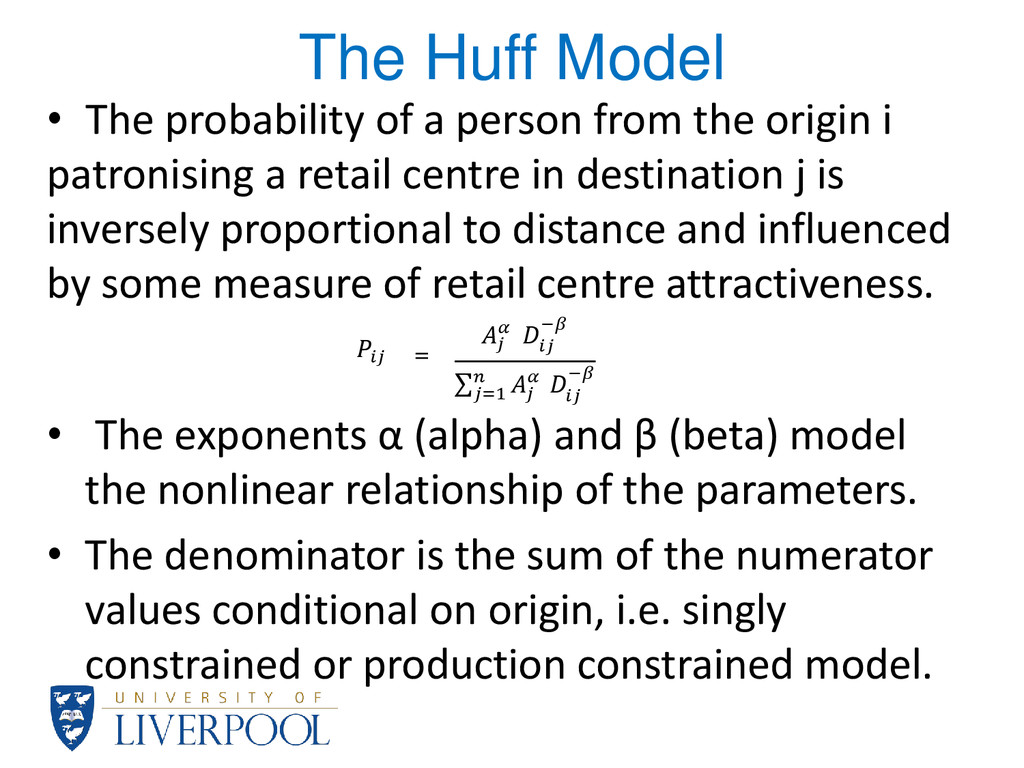
the origin i patronising a retail centre in destination j is inversely proportional to distance and influenced by some measure of retail centre attractiveness. = − − =1 • The exponents α (alpha) and β (beta) model the nonlinear relationship of the parameters. • The denominator is the sum of the numerator values conditional on origin, i.e. singly constrained or production constrained model.
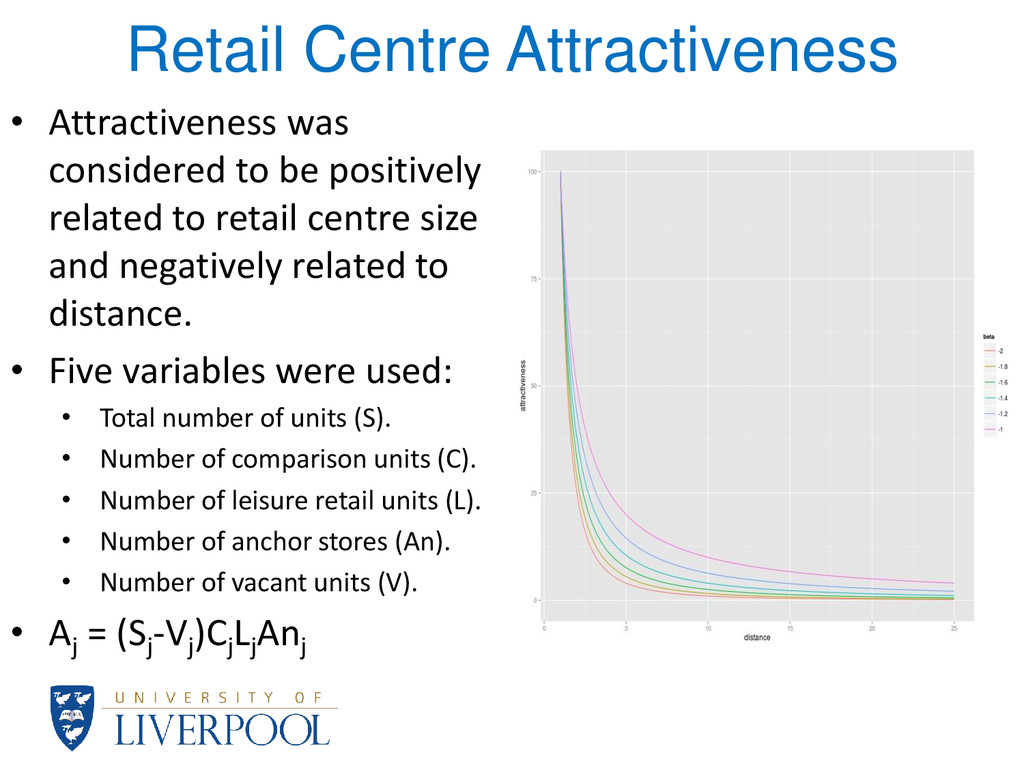
related to retail centre size and negatively related to distance. • Five variables were used: • Total number of units (S). • Number of comparison units (C). • Number of leisure retail units (L). • Number of anchor stores (An). • Number of vacant units (V). • Aj = (Sj -Vj )Cj Lj Anj
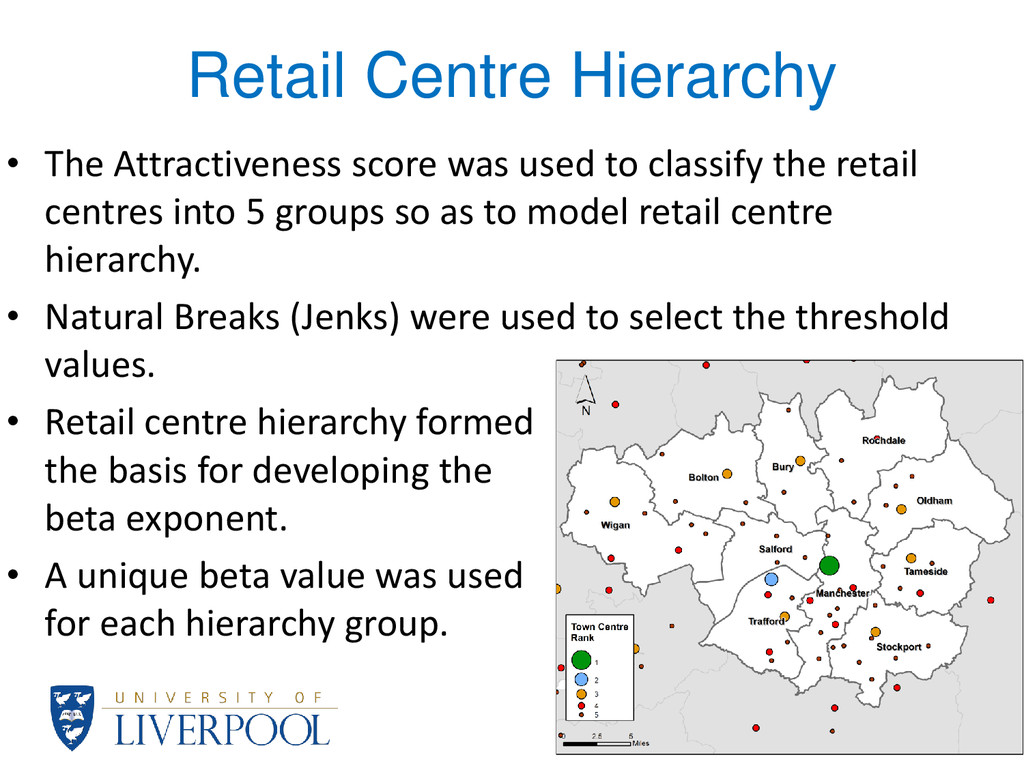
classify the retail centres into 5 groups so as to model retail centre hierarchy. • Natural Breaks (Jenks) were used to select the threshold values. • Retail centre hierarchy formed the basis for developing the beta exponent. • A unique beta value was used for each hierarchy group.
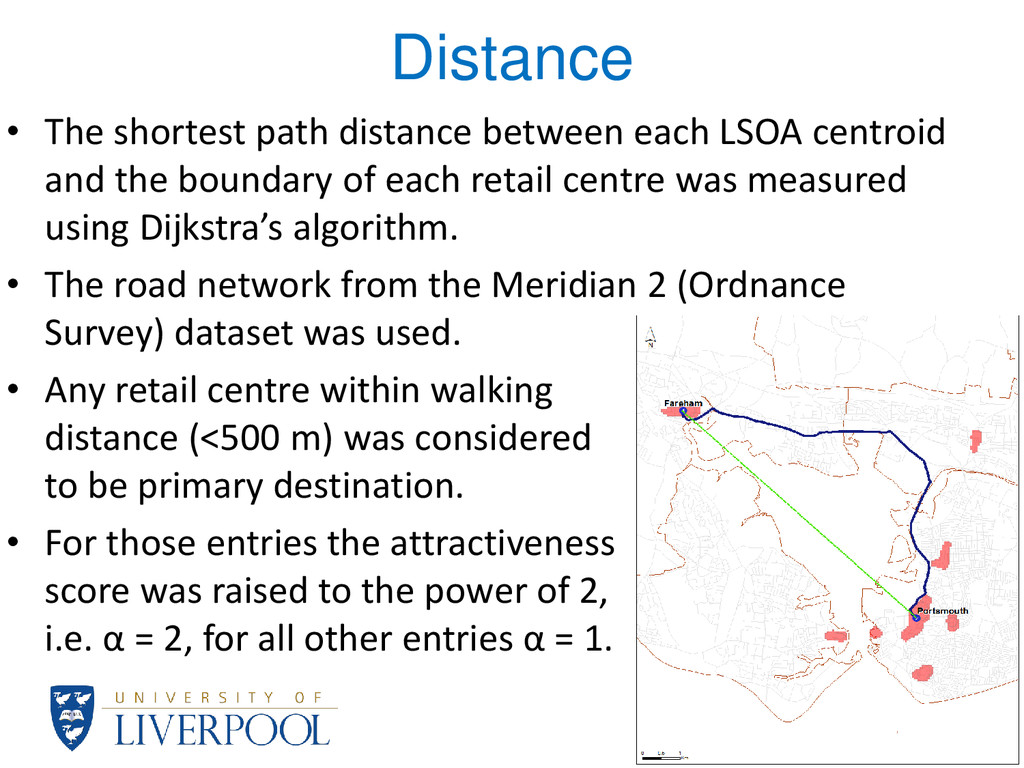
and the boundary of each retail centre was measured using Dijkstra’s algorithm. • The road network from the Meridian 2 (Ordnance Survey) dataset was used. • Any retail centre within walking distance (<500 m) was considered to be primary destination. • For those entries the attractiveness score was raised to the power of 2, i.e. α = 2, for all other entries α = 1.
the R programming language and the huff-tools library was developed which is publicly available in the CDRC GitHub repository(1). • The huff-tools library provides functions to: • Clean the road network from self-connected parts using the Breadth-First-Search algorithm. • Calculate the shortest path and Euclidean distance. • Calculate the Huff probabilities. • Select and extract catchment areas based on the Huff probabilities. (1) https://github.com/ESRC-CDRC/huff
the following beta values (in decreasing hierarchical order): • -1.2, -1.4, -1.6, -1.8, -2.0 • Model 1 was applied by increasing all beta values by 0.1. • Model 2 was applied by decreasing beta values by -0.1. • Model 3 had a fixed alpha value for all entries equal to 1. • Model 4 used the distance to the retail centre centroid. • For model comparison the total and primary catchment area of each retail centre were used. • Total catchment area includes LSOAs where the Huff probability is higher towards a particular retail centre while for primary catchments the Huff probability is >0.5.
primary catchment area are decreasing across all groups of retail centres. This might be due to greater competition and cannibalisation of the Huff probabilities as attractiveness decays at a slower rate over distance. • The catchment area increases as β decreases by -0.1, most likely due to reduced competition among the retail centres as attractiveness decays at a faster rate over distance. • By setting α=1 the catchment area of smaller retail centres is reduced.
model using data of actual patronage probability. • A mixed effects regression model with a random slope conditional on hierarchy level could be used to estimate different beta values for each hierarchy level. • Model selection could also be used to verify whether a simpler model might perform better e.g. a model with 4 levels of hierarchy instead of 5.