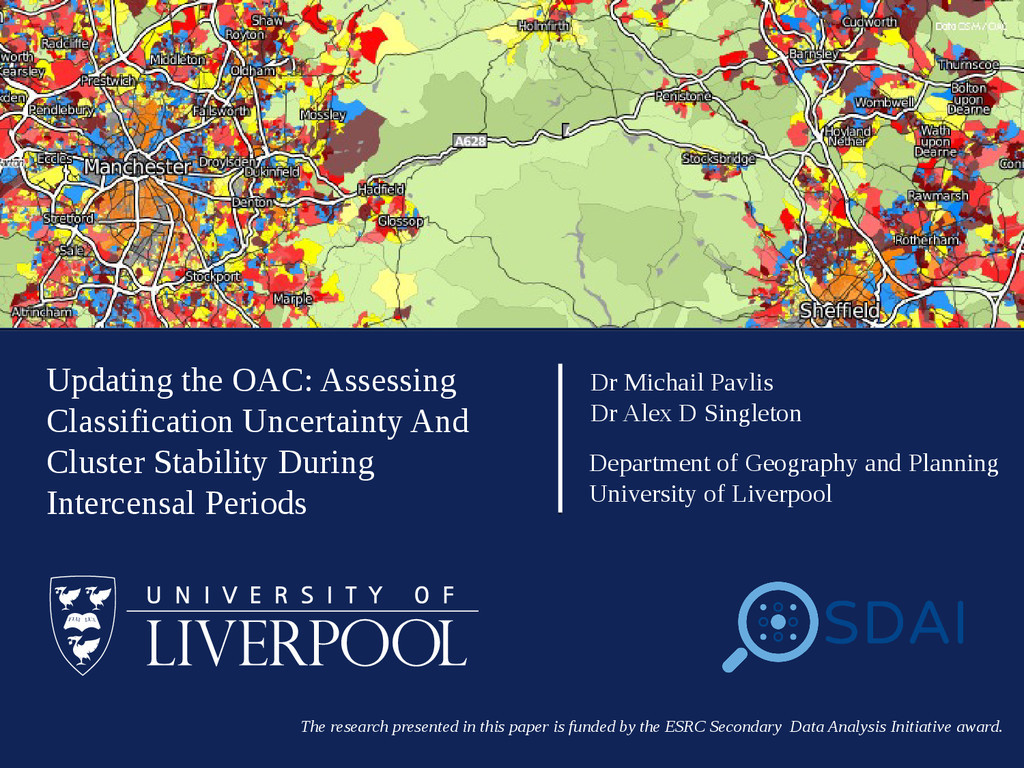
and Planning University of Liverpool Updating the OAC: Assessing Classification Uncertainty And Cluster Stability During Intercensal Periods The research presented in this paper is funded by the ESRC Secondary Data Analysis Initiative award.
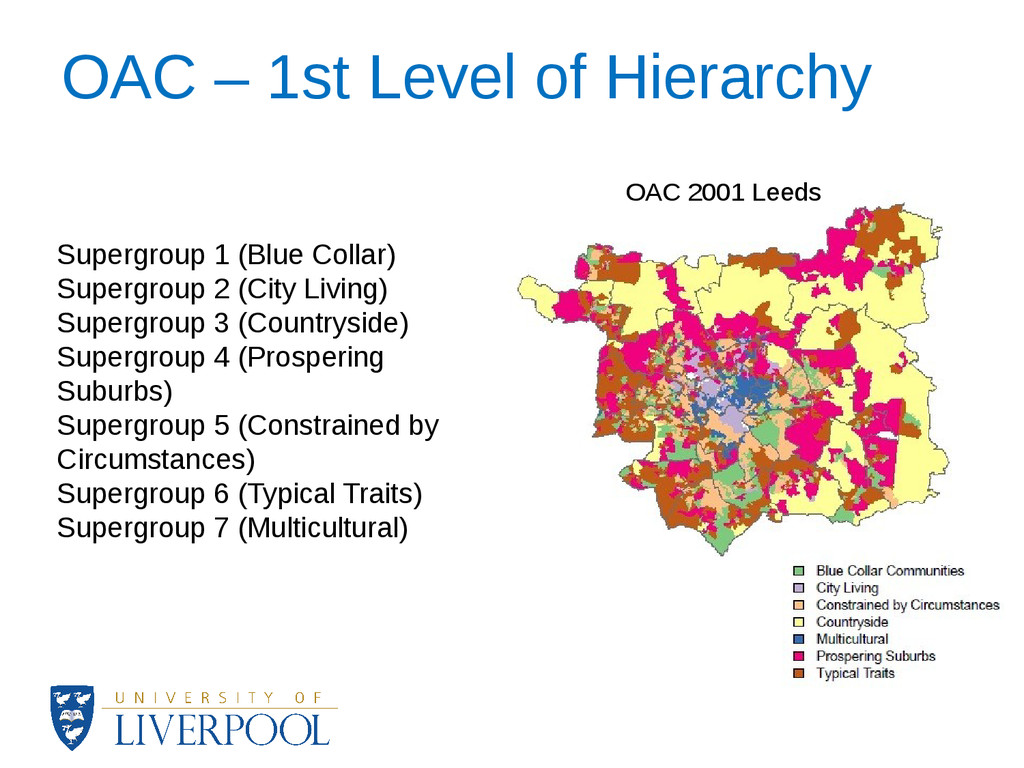
the socio-spatial structure of small geographical areas. • The Output Area Classification (OAC) is the most widely used open-source geodemographic classification in the UK. • It was developed using forty one variables from the 2001 UK census with the k-means cluster analysis. • The OAC typology comprises a three-tier of aggregate levels of clusters, i.e. seven supergroups, twenty one groups and fifty two subgroups.
classification to be updated during intercensal periods using more recent data. • Assumes that the characteristics of neighbourhoods do not change rapidly • However, temporal change and uncertainty has been found to be neither uniform in degree nor in distribution in England and Wales [1]. • The overall aim of the analysis was to develop a methodology to update the OAC by producing intercensal estimates of the OAC variables. [1] Gale C.G. and Longley, P.A. (2013) Temporal Uncertainty in a Small Area Open Geodemographic Classification. Transactions in GIS. 17(4) 563-588.
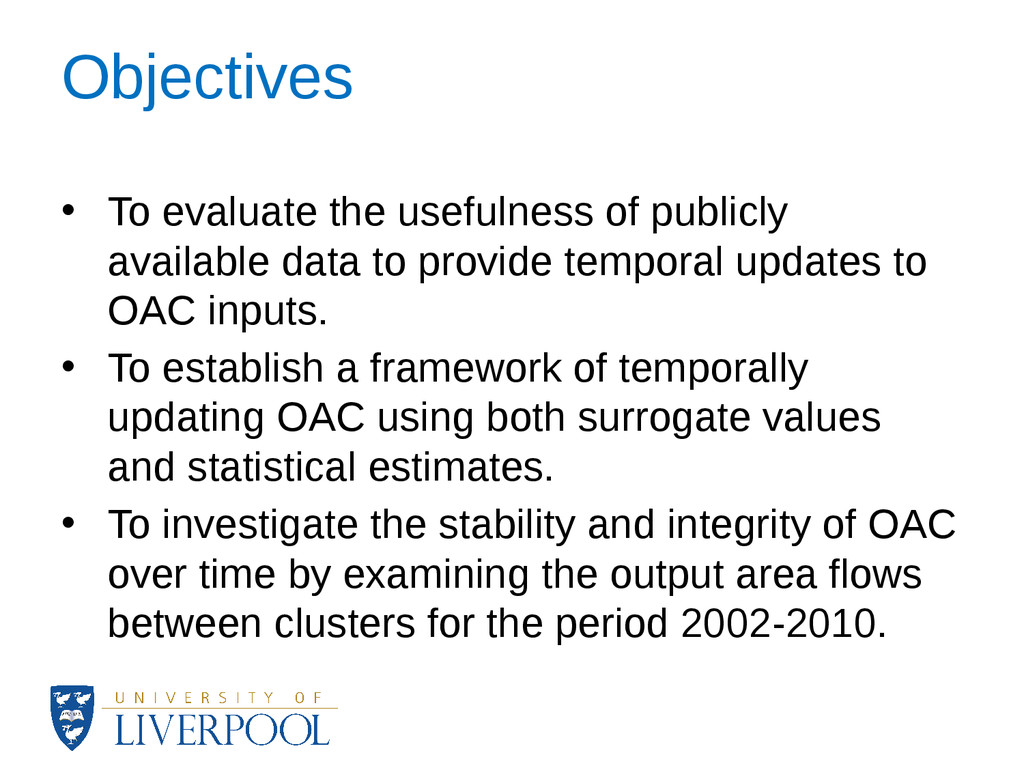
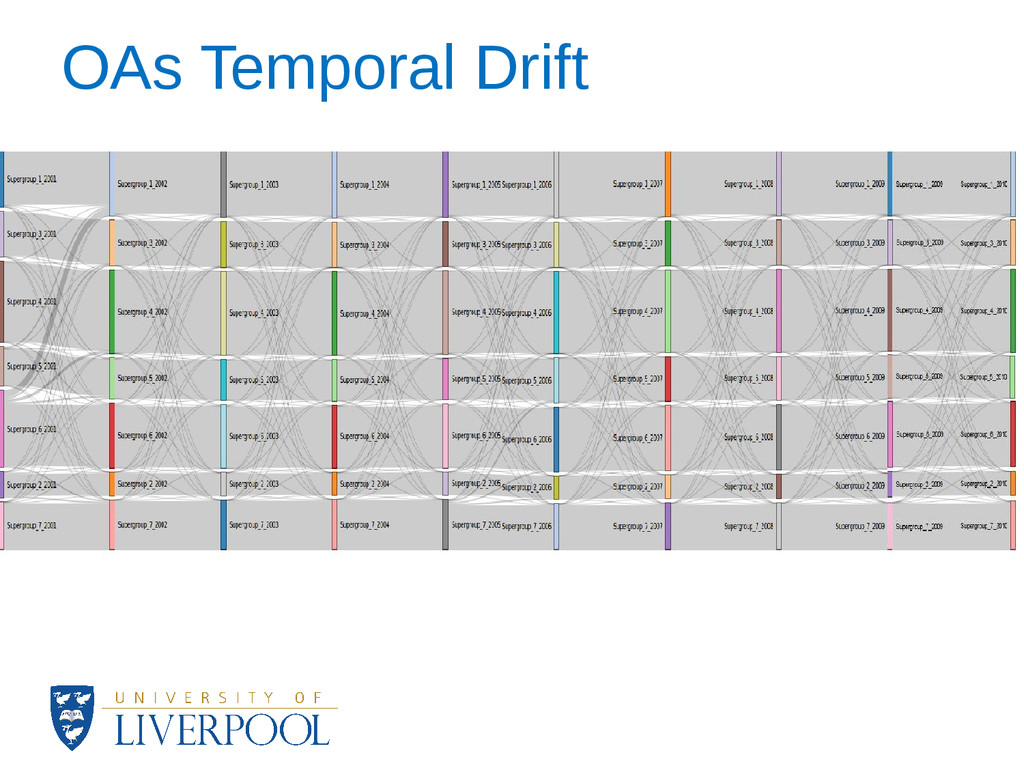
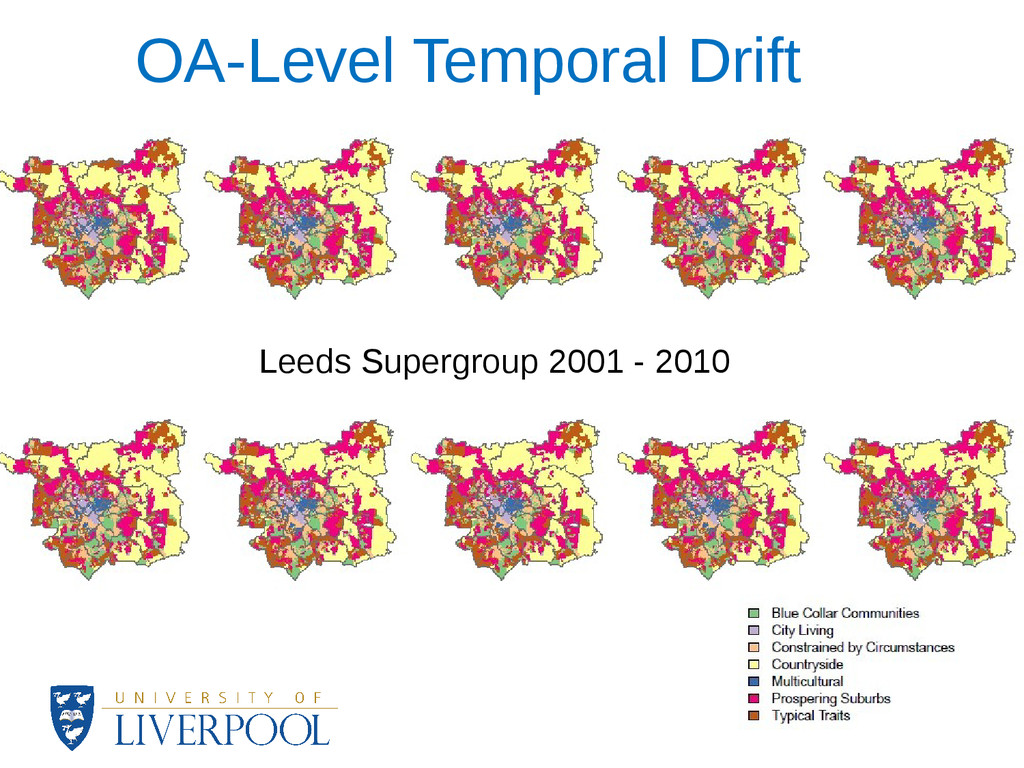
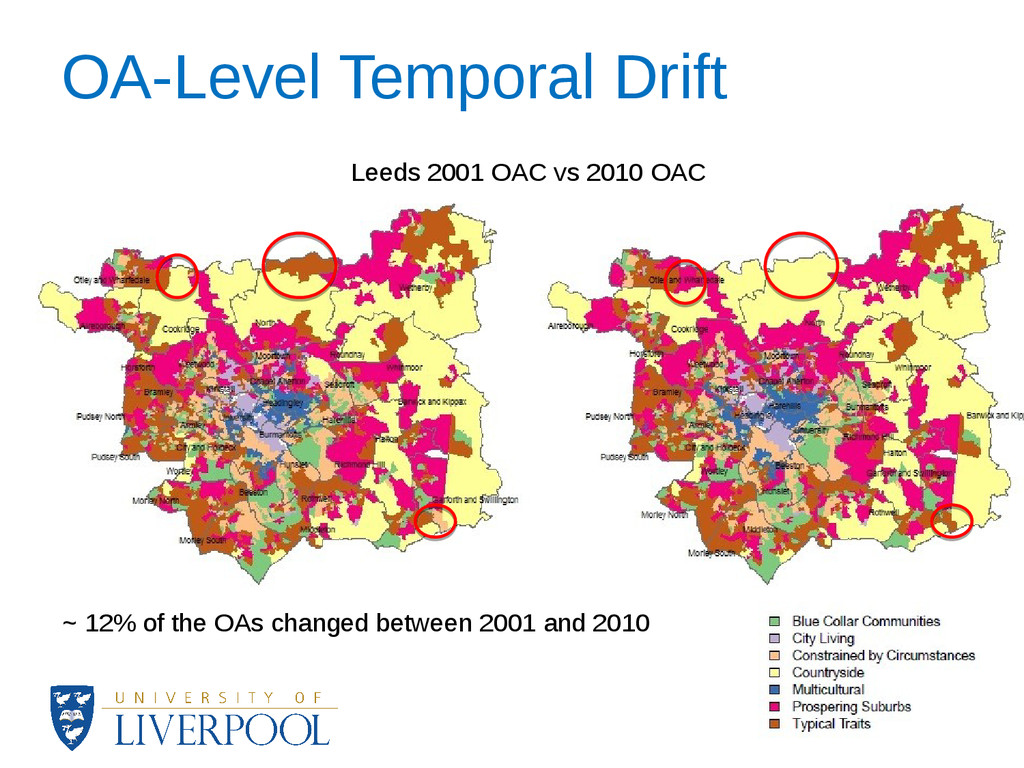
to provide temporal updates to OAC inputs. • To establish a framework of temporally updating OAC using both surrogate values and statistical estimates. • To investigate the stability and integrity of OAC over time by examining the output area flows between clusters for the period 2002-2010.
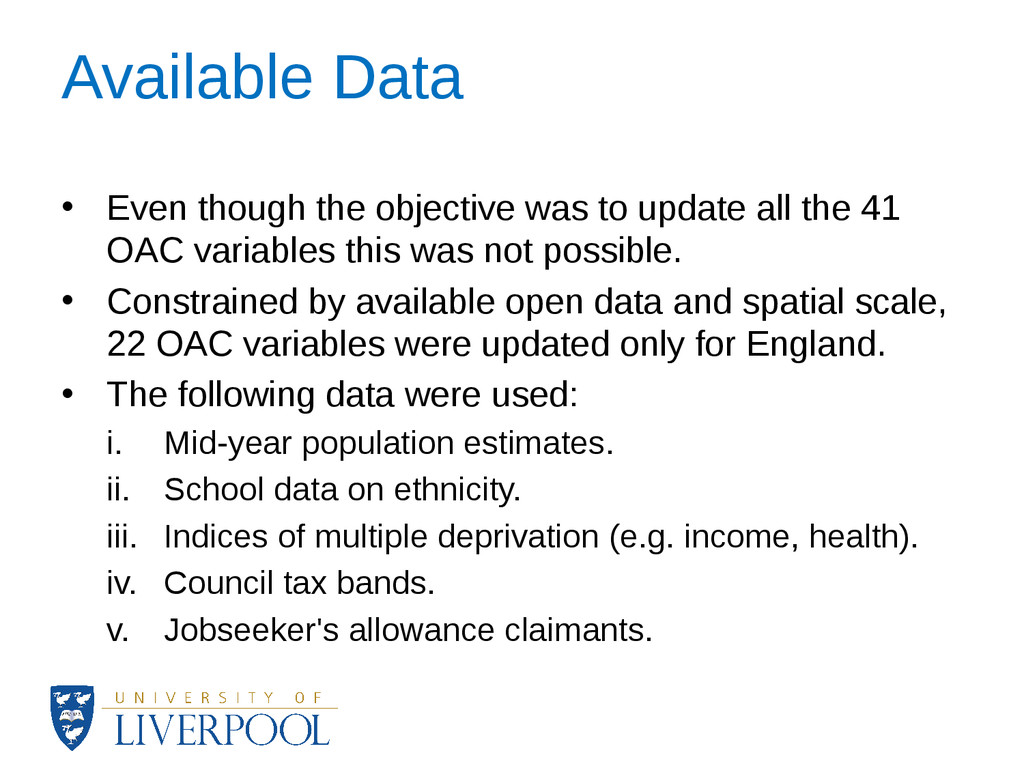
all the 41 OAC variables this was not possible. • Constrained by available open data and spatial scale, 22 OAC variables were updated only for England. • The following data were used: i. Mid-year population estimates. ii. School data on ethnicity. iii. Indices of multiple deprivation (e.g. income, health). iv. Council tax bands. v. Jobseeker's allowance claimants.
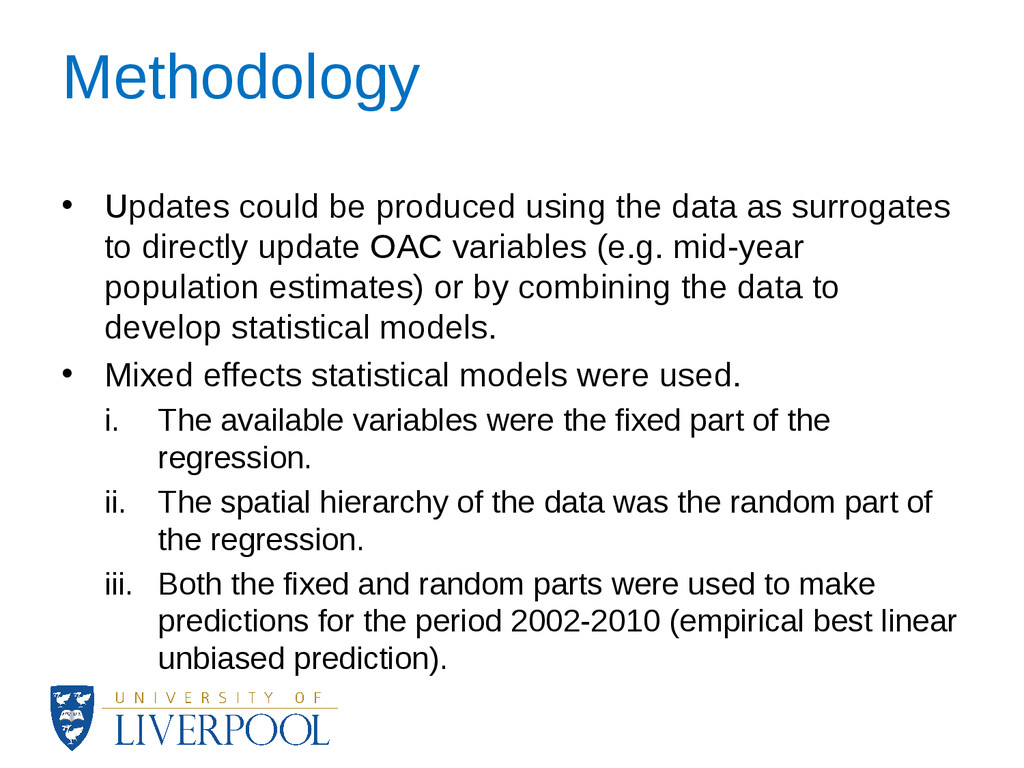
surrogates to directly update OAC variables (e.g. mid-year population estimates) or by combining the data to develop statistical models. • Mixed effects statistical models were used. i. The available variables were the fixed part of the regression. ii. The spatial hierarchy of the data was the random part of the regression. iii. Both the fixed and random parts were used to make predictions for the period 2002-2010 (empirical best linear unbiased prediction).
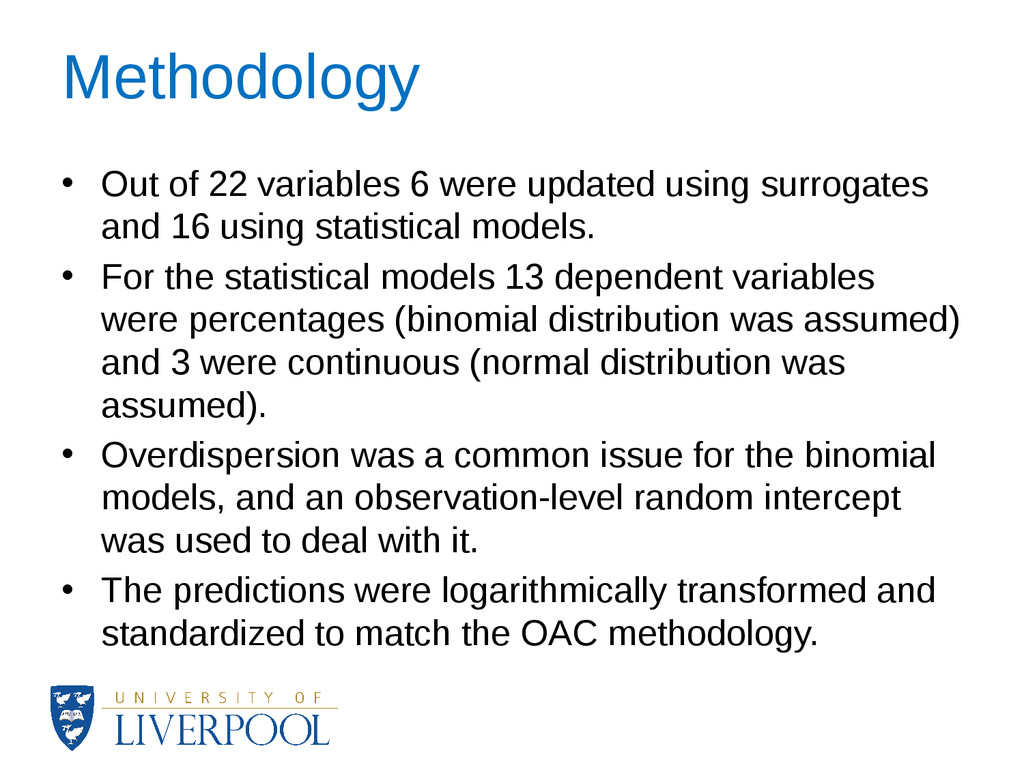
surrogates and 16 using statistical models. • For the statistical models 13 dependent variables were percentages (binomial distribution was assumed) and 3 were continuous (normal distribution was assumed). • Overdispersion was a common issue for the binomial models, and an observation-level random intercept was used to deal with it. • The predictions were logarithmically transformed and standardized to match the OAC methodology.
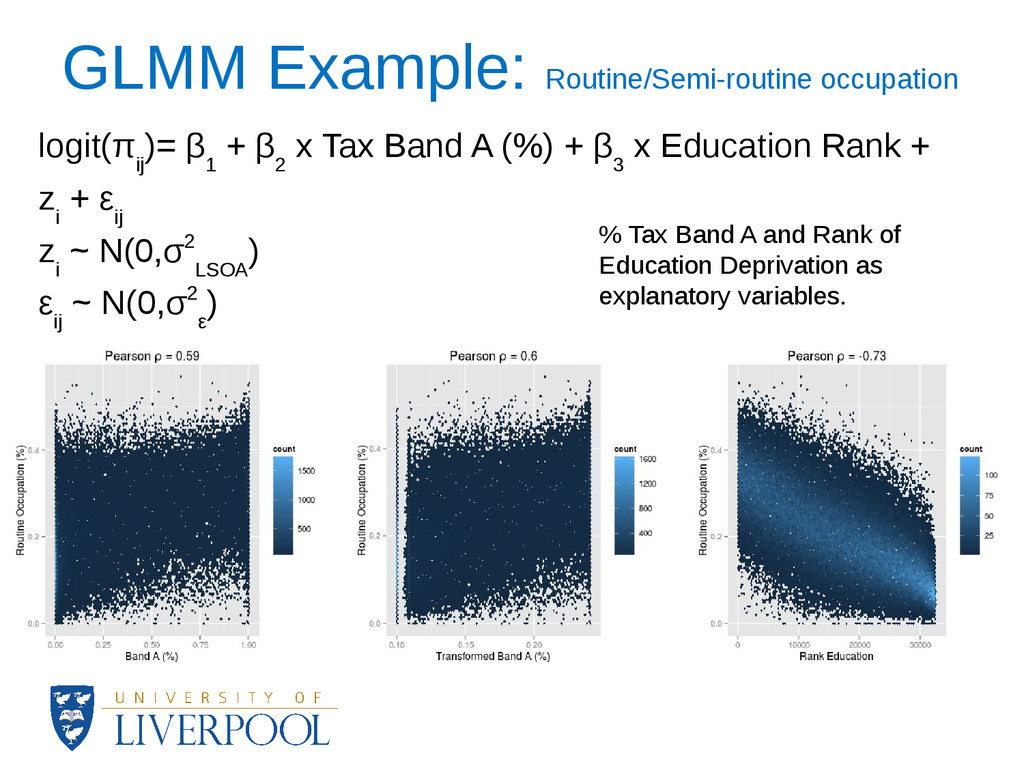
β 2 x Tax Band A (%) + β 3 x Education Rank + z i + ε ij z i ~ N(0,σ2 LSOA ) ε ij ~ N(0,σ2 ε ) % Tax Band A and Rank of Education Deprivation as explanatory variables.
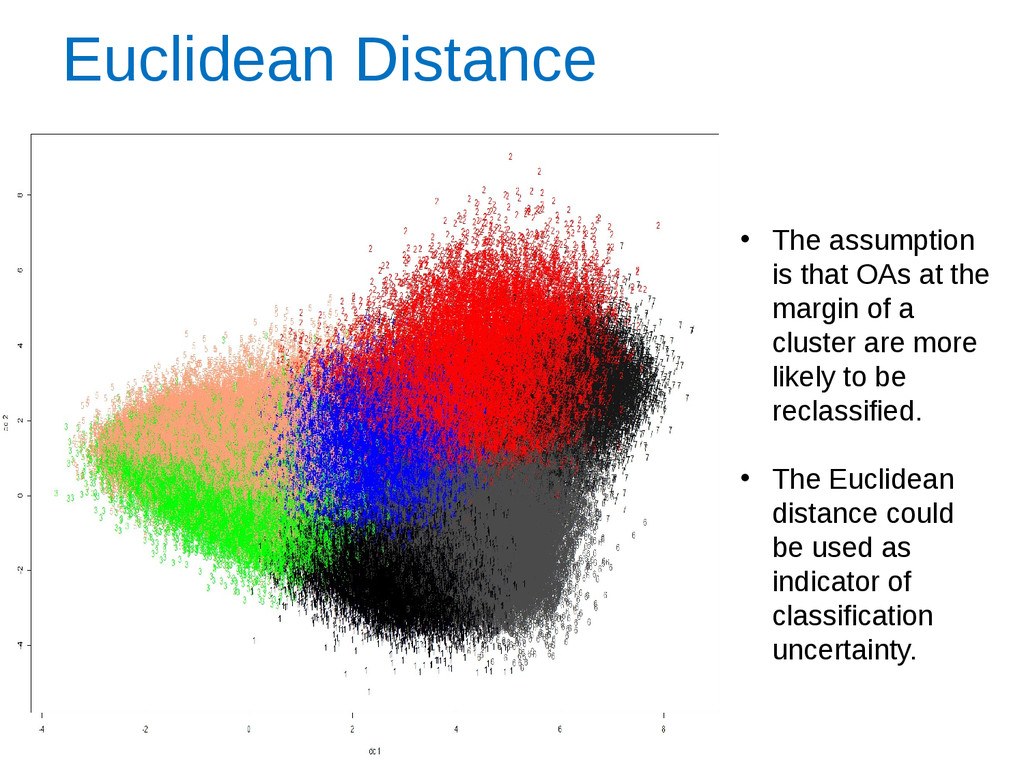
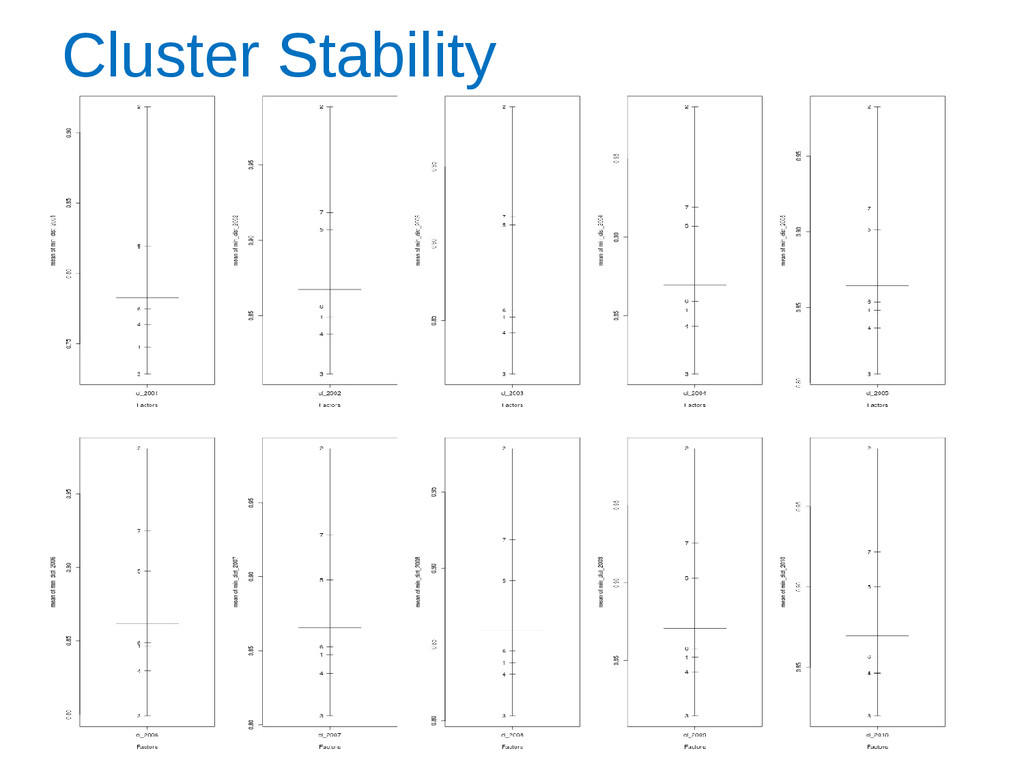
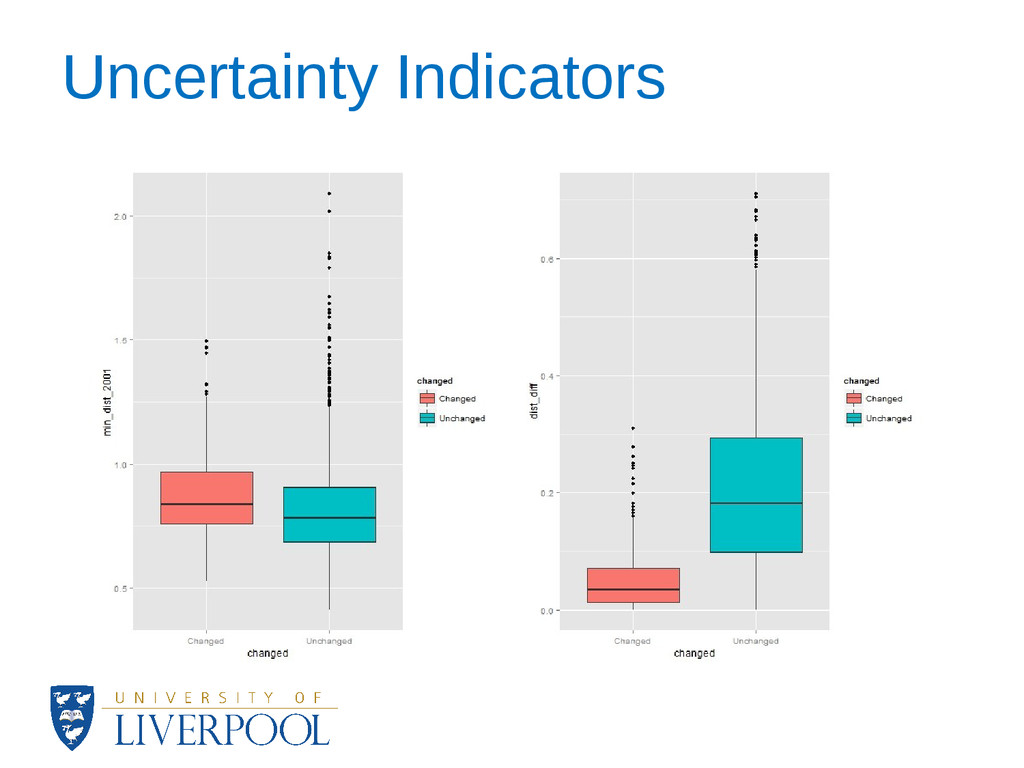
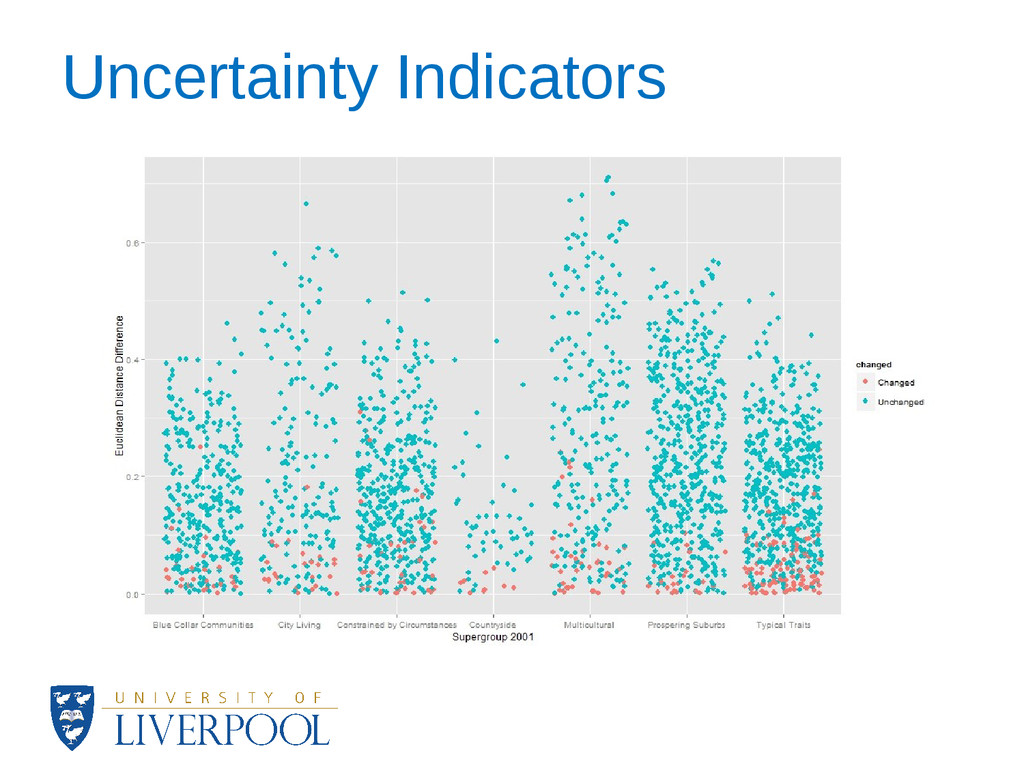
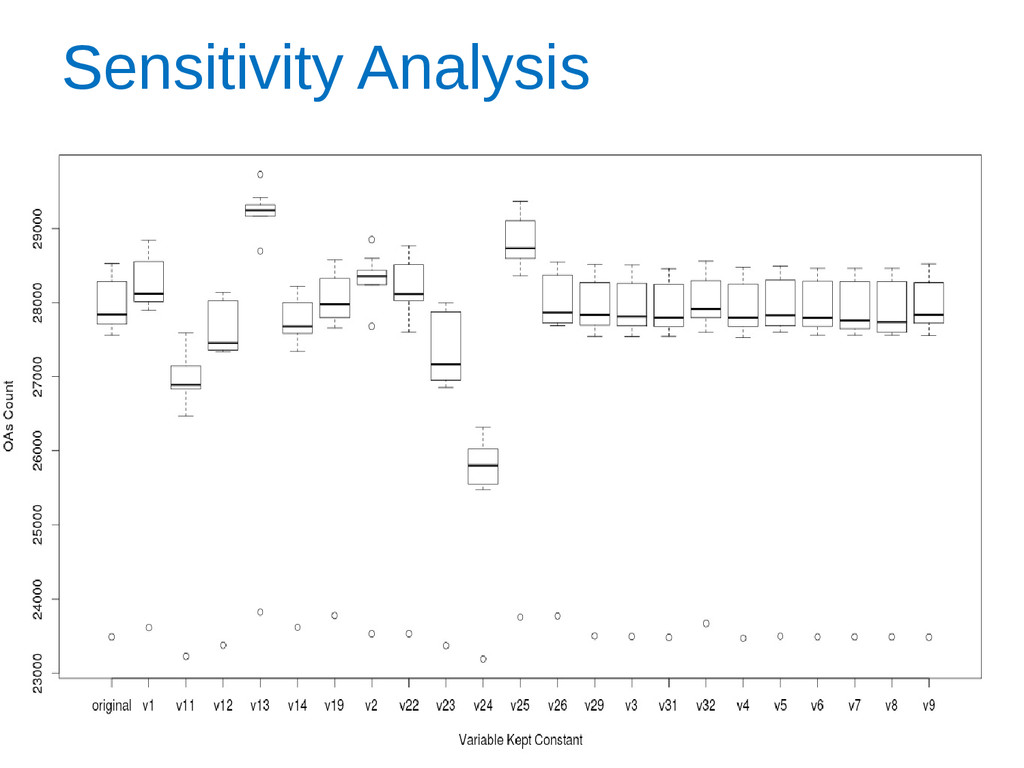
how close to the margin of a cluster an area assignment is. • At the cluster level, data visualisation techniques showed major patterns of change and revealed the stability of the OAC during 2002-2010. • A complete update of the OAC is not yet possible for all of the variables and this could have an effect on the results of the analysis. • Sensitivity analysis also showed the most significant variables for each cluster.