Upgrade to Pro — share decks privately, control downloads, hide ads and more …

Bennington Multifamily Portfolio Investment Mem...

Avatar for Michael Gilman Michael Gilman
June 08, 2023
170

Bennington Multifamily Portfolio Investment Memo - 506(c)

Cross Mountain Capital (the “Sponsor” and “Fund Manager) is pleased to offer the opportunity for investors to participate in the New England Income Multifamily Fund - The Bennington Portfolio. This Off-market portfolio was sources from the largest holder of real estate in the town of Bennington, a picturesque town with a .4% vacancy rate on the border of NY and VT, where we have not had the opportunity to buy assets at scale until now where we have been able to establish a relationship with the largest property owner in Bennington who is looking to retire.

The portfolio was previously professionally managed and is fully occupied with strong in-place cash flow, which will allow for distributions starting in the first quarter following closing There is also room for rent growth and we expect to hit north of 10% cash on cash returns to investors before a refinance, where we will target a return of capital of ~50 and continue to cash-flow north of 8% per year until sale.

This region has a paucity of professional investors because of the difficulty of managing and executing in a remote market where the average sized multi family is a 4plex. At the same time, the region has benefited from historic growth since Covid putting incredible pressure on inventory and limited to nonexistent new construction place significant organic growth pressure on real estate values. Cross Mountain Capital and its wholly owned property manager and construction company has been a pioneer in this region for the last decade bringing double digit cash on cash returns and realized IRRs over 50% to investors. We currently operate over 300 units in Vermont (over 1,000 combined across markets) with a buy and hold long term strategy for perpetual high cash flow.

Avatar for Michael Gilman

Michael Gilman

June 08, 2023

Transcript

  1. NEW ENGLAND HIGH INCOME MULTIFAMILY FUND New England High Income

    Multifamily Fund EXECUTIVE INVESTMENT SUMMARY
  2. NEW ENGLAND HIGH INCOME MULTIFAMILY FUND CONTENTS Investment Summary Market

    Business Plan Asset Detail and Photos Financials Comparables Our Team Appendix A: Who We Are Appendix B: Local Market Case Studies 2 3 8 13 18 24 29 35 46 52
  3. NEW ENGLAND HIGH INCOME MULTIFAMILY FUND INVESTMENT SUMMARY 4 OPPORTUNITY

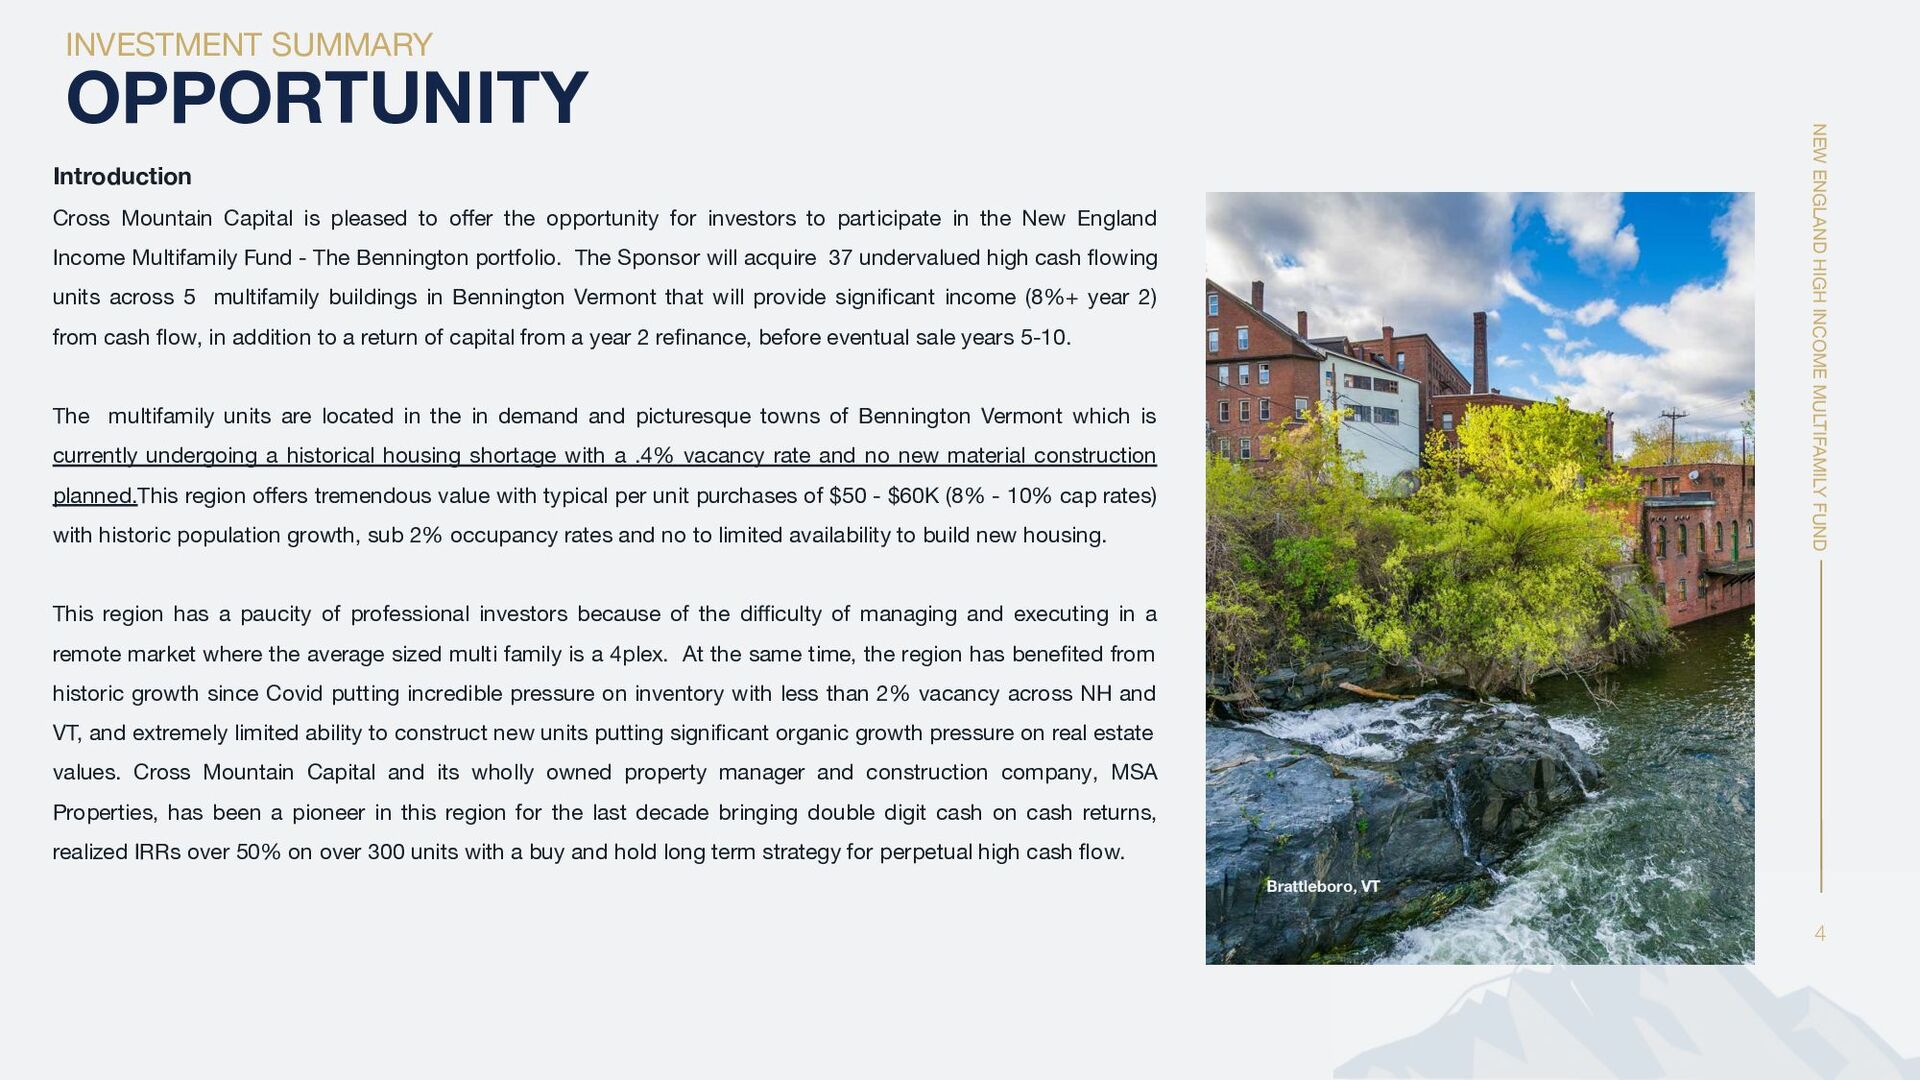
    Introduction Cross Mountain Capital is pleased to offer the opportunity for investors to participate in the New England Income Multifamily Fund - The Bennington portfolio. The Sponsor will acquire 37 undervalued high cash flowing units across 5 multifamily buildings in Bennington Vermont that will provide significant income (8%+ year 2) from cash flow, in addition to a return of capital from a year 2 refinance, before eventual sale years 5-10. The multifamily units are located in the in demand and picturesque towns of Bennington Vermont which is currently undergoing a historical housing shortage with a .4% vacancy rate and no new material construction planned.This region offers tremendous value with typical per unit purchases of $50 - $60K (8% - 10% cap rates) with historic population growth, sub 2% occupancy rates and no to limited availability to build new housing. This region has a paucity of professional investors because of the difficulty of managing and executing in a remote market where the average sized multi family is a 4plex. At the same time, the region has benefited from historic growth since Covid putting incredible pressure on inventory with less than 2% vacancy across NH and VT, and extremely limited ability to construct new units putting significant organic growth pressure on real estate values. Cross Mountain Capital and its wholly owned property manager and construction company, MSA Properties, has been a pioneer in this region for the last decade bringing double digit cash on cash returns, realized IRRs over 50% on over 300 units with a buy and hold long term strategy for perpetual high cash flow. Brattleboro, VT
  4. NEW ENGLAND HIGH INCOME MULTIFAMILY FUND INVESTMENT SUMMARY 5 EXPECTED

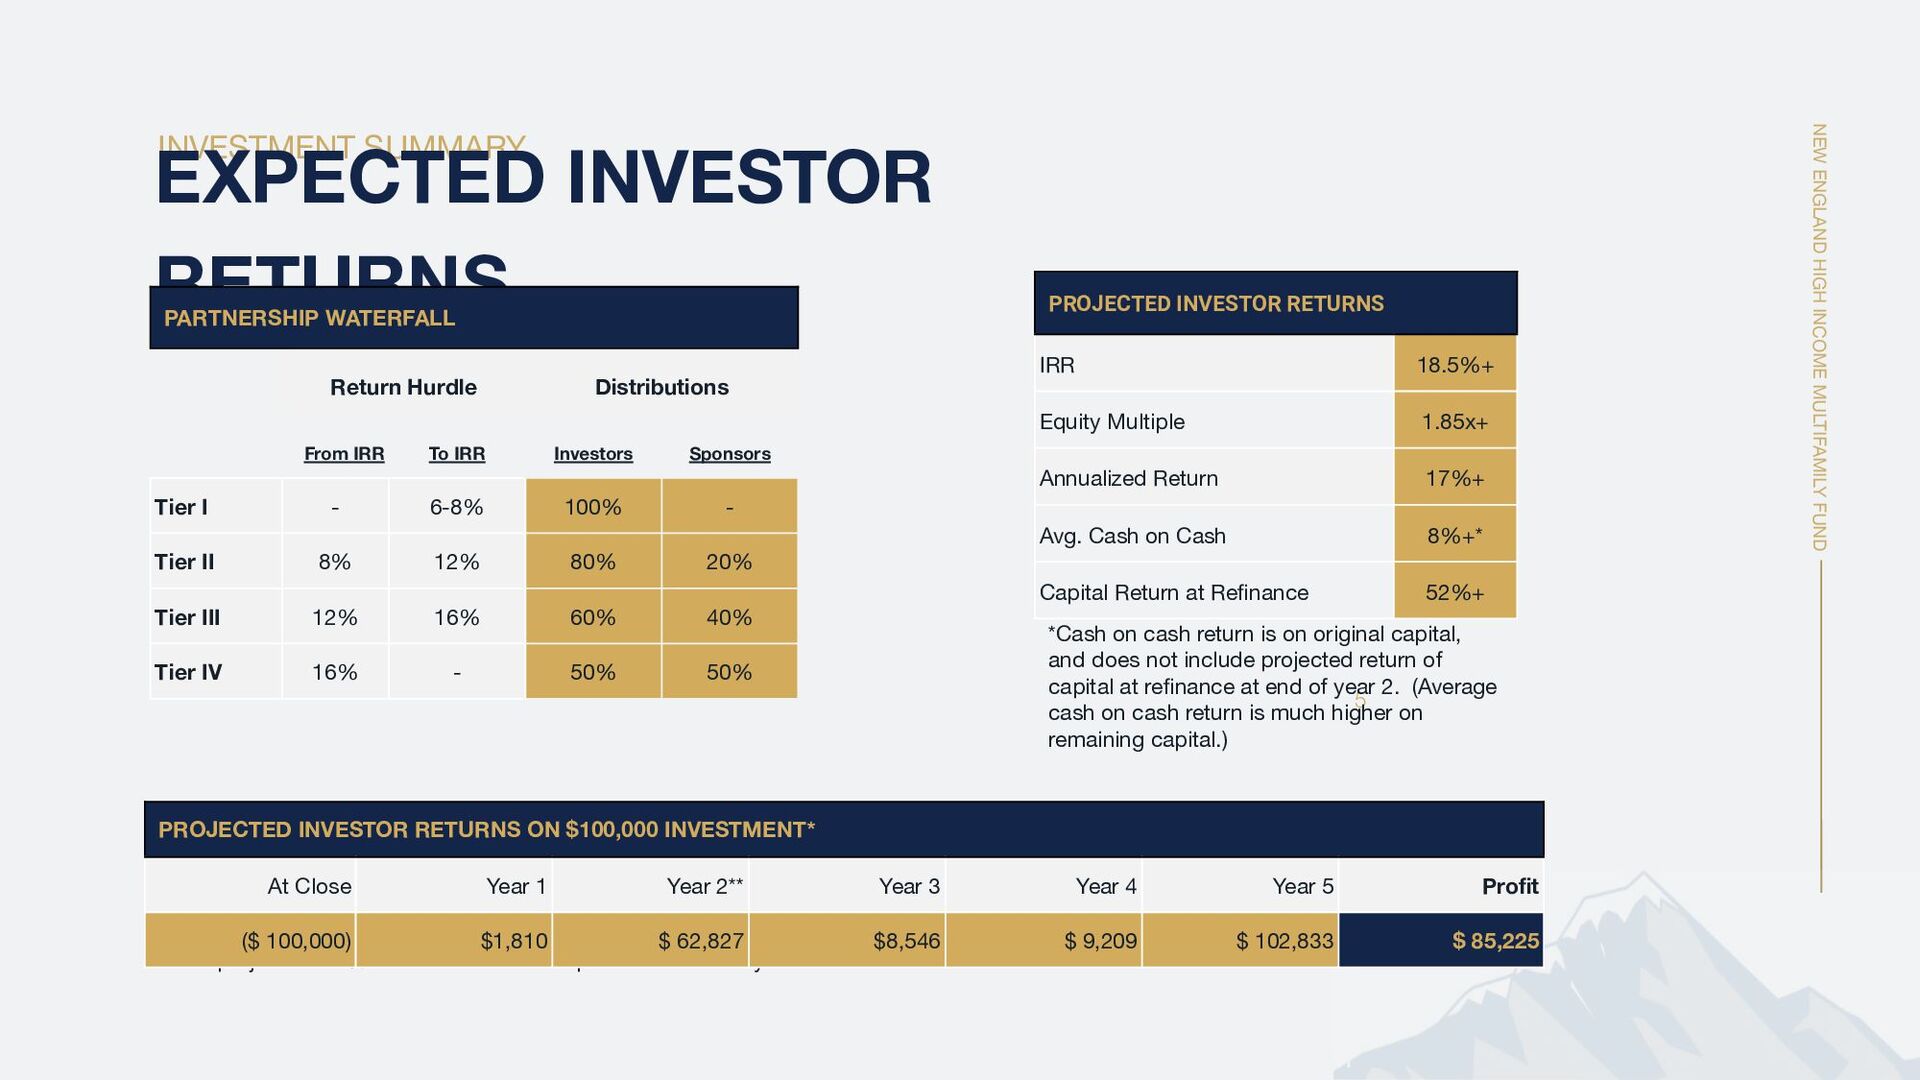
    INVESTOR RETURNS Whetstone Brewery, Brattleboro, VT *All projected returns are net of fees paid to sponsor, which can be found on p.22 **We project a ~52% return of invested capital at the end of year 2 with refinance. PARTNERSHIP WATERFALL Return Hurdle Distributions From IRR To IRR Investors Sponsors Tier I - 6-8% 100% - Tier II 8% 12% 80% 20% Tier III 12% 16% 60% 40% Tier IV 16% - 50% 50% PROJECTED INVESTOR RETURNS IRR 18.5%+ Equity Multiple 1.85x+ Annualized Return 17%+ Avg. Cash on Cash 8%+* Capital Return at Refinance 52%+ PROJECTED INVESTOR RETURNS ON $100,000 INVESTMENT* At Close Year 1 Year 2** Year 3 Year 4 Year 5 Profit ($ 100,000) $1,810 $ 62,827 $8,546 $ 9,209 $ 102,833 $ 85,225 *Cash on cash return is on original capital, and does not include projected return of capital at refinance at end of year 2. (Average cash on cash return is much higher on remaining capital.)

  5. NEW ENGLAND HIGH INCOME MULTIFAMILY FUND NE Income Fund -

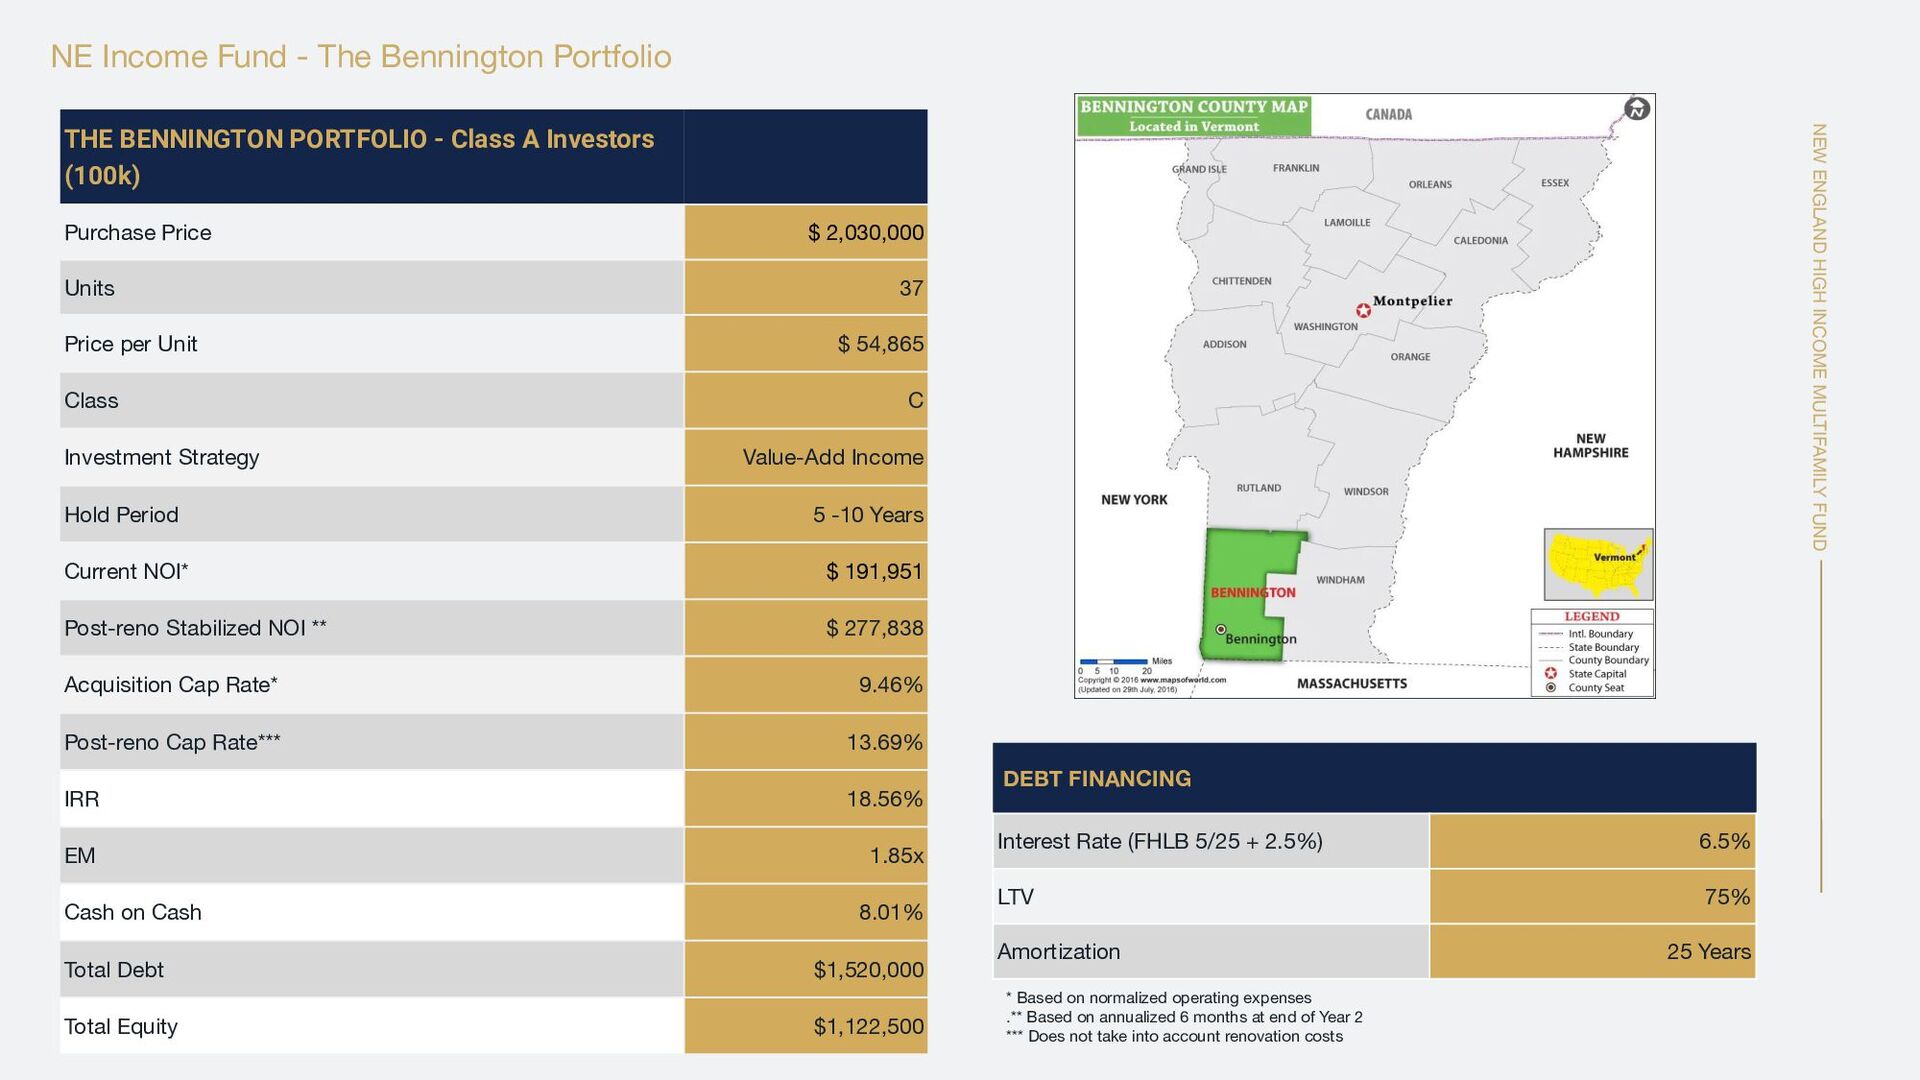
    The Bennington Portfolio THE BENNINGTON PORTFOLIO - Class A Investors (100k) Purchase Price $ 2,030,000 Units 37 Price per Unit $ 54,865 Class C Investment Strategy Value-Add Income Hold Period 5 -10 Years Current NOI* $ 191,951 Post-reno Stabilized NOI ** $ 277,838 Acquisition Cap Rate* 9.46% Post-reno Cap Rate*** 13.69% IRR 18.56% EM 1.85x Cash on Cash 8.01% Total Debt $1,520,000 Total Equity $1,122,500 * Based on normalized operating expenses .** Based on annualized 6 months at end of Year 2 *** Does not take into account renovation costs DEBT FINANCING Interest Rate (FHLB 5/25 + 2.5%) 6.5% LTV 75% Amortization 25 Years
  6. NEW ENGLAND HIGH INCOME MULTIFAMILY FUND 7 Off-Market Opportunity with

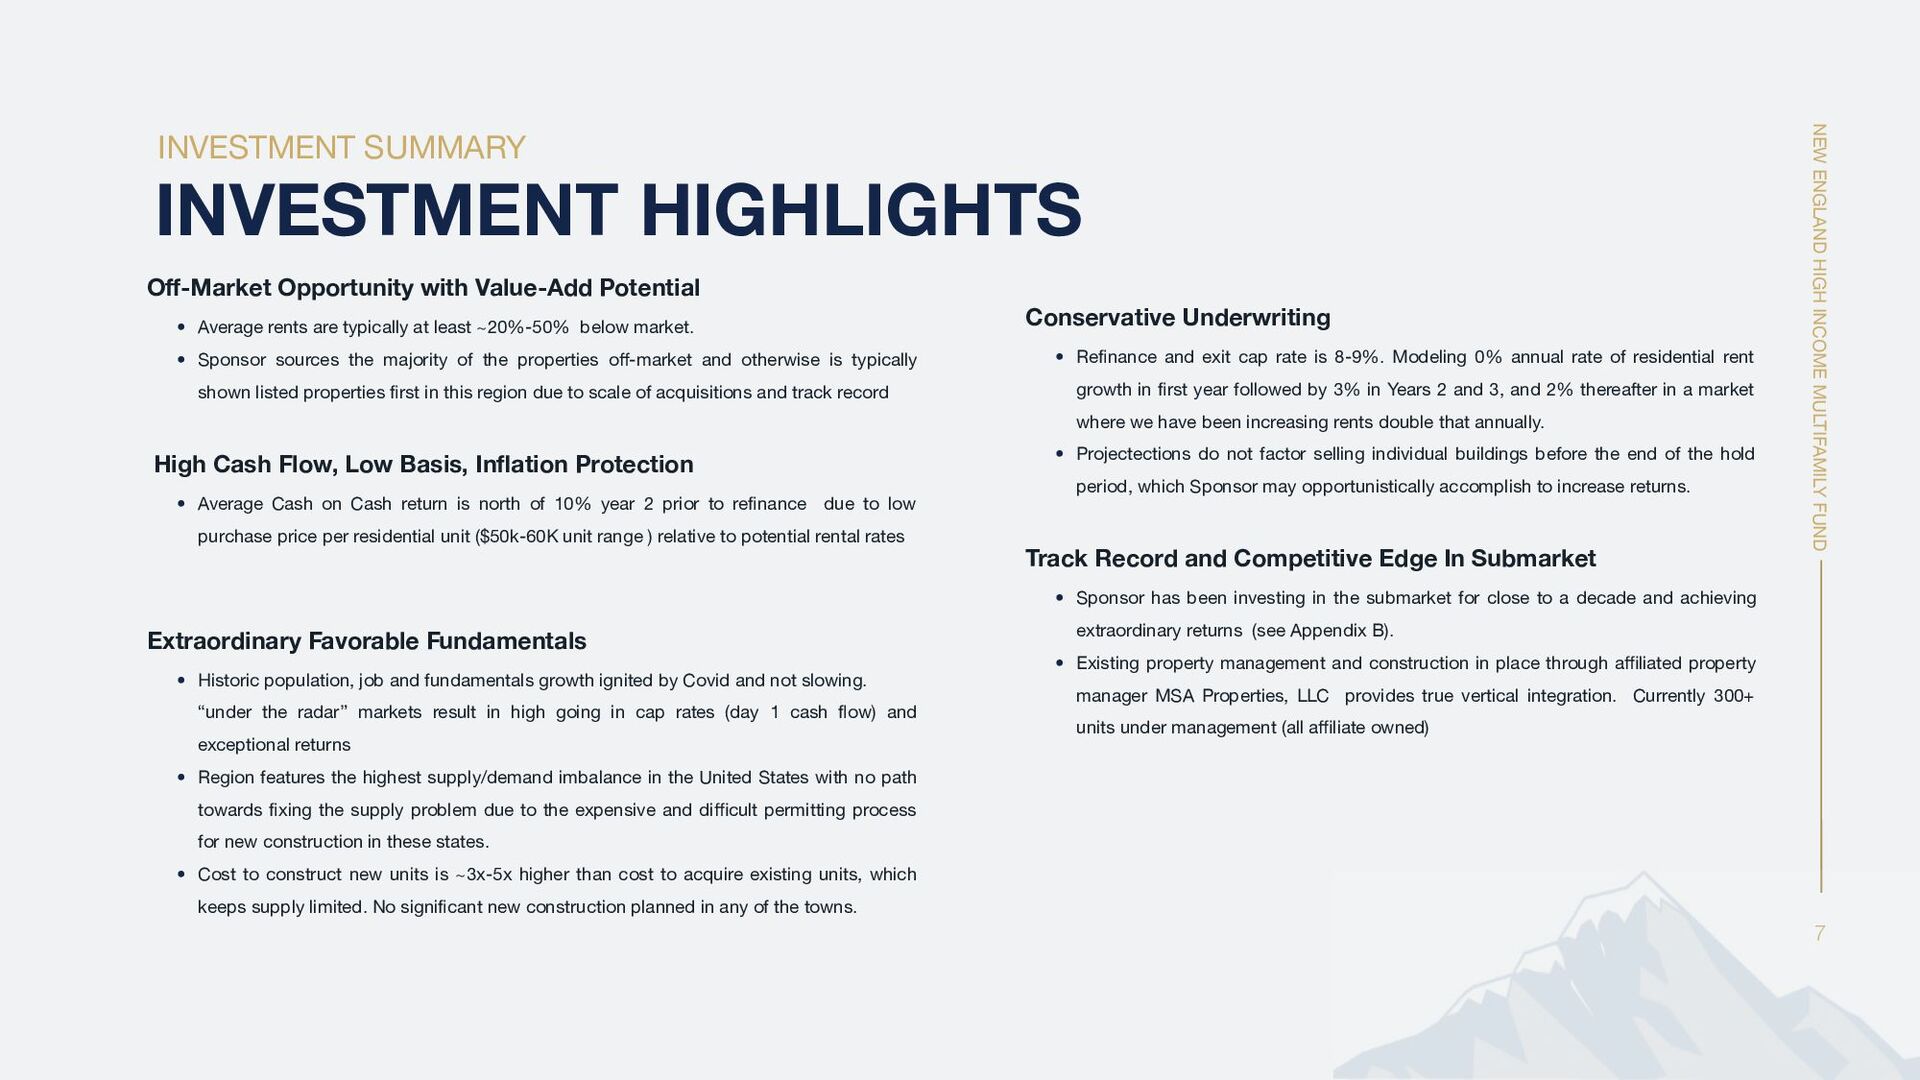
    Value-Add Potential • Average rents are typically at least ~20%-50% below market. • Sponsor sources the majority of the properties off-market and otherwise is typically shown listed properties first in this region due to scale of acquisitions and track record High Cash Flow, Low Basis, Inflation Protection • Average Cash on Cash return is north of 10% year 2 prior to refinance due to low purchase price per residential unit ($50k-60K unit range ) relative to potential rental rates Extraordinary Favorable Fundamentals • Historic population, job and fundamentals growth ignited by Covid and not slowing. “under the radar” markets result in high going in cap rates (day 1 cash flow) and exceptional returns • Region features the highest supply/demand imbalance in the United States with no path towards fixing the supply problem due to the expensive and difficult permitting process for new construction in these states. • Cost to construct new units is ~3x-5x higher than cost to acquire existing units, which keeps supply limited. No significant new construction planned in any of the towns. Conservative Underwriting • Refinance and exit cap rate is 8-9%. Modeling 0% annual rate of residential rent growth in first year followed by 3% in Years 2 and 3, and 2% thereafter in a market where we have been increasing rents double that annually. • Projectections do not factor selling individual buildings before the end of the hold period, which Sponsor may opportunistically accomplish to increase returns. Track Record and Competitive Edge In Submarket • Sponsor has been investing in the submarket for close to a decade and achieving extraordinary returns (see Appendix B). • Existing property management and construction in place through affiliated property manager MSA Properties, LLC provides true vertical integration. Currently 300+ units under management (all affiliate owned) INVESTMENT HIGHLIGHTS INVESTMENT SUMMARY
  7. NEW ENGLAND HIGH INCOME MULTIFAMILY FUND The effects of the

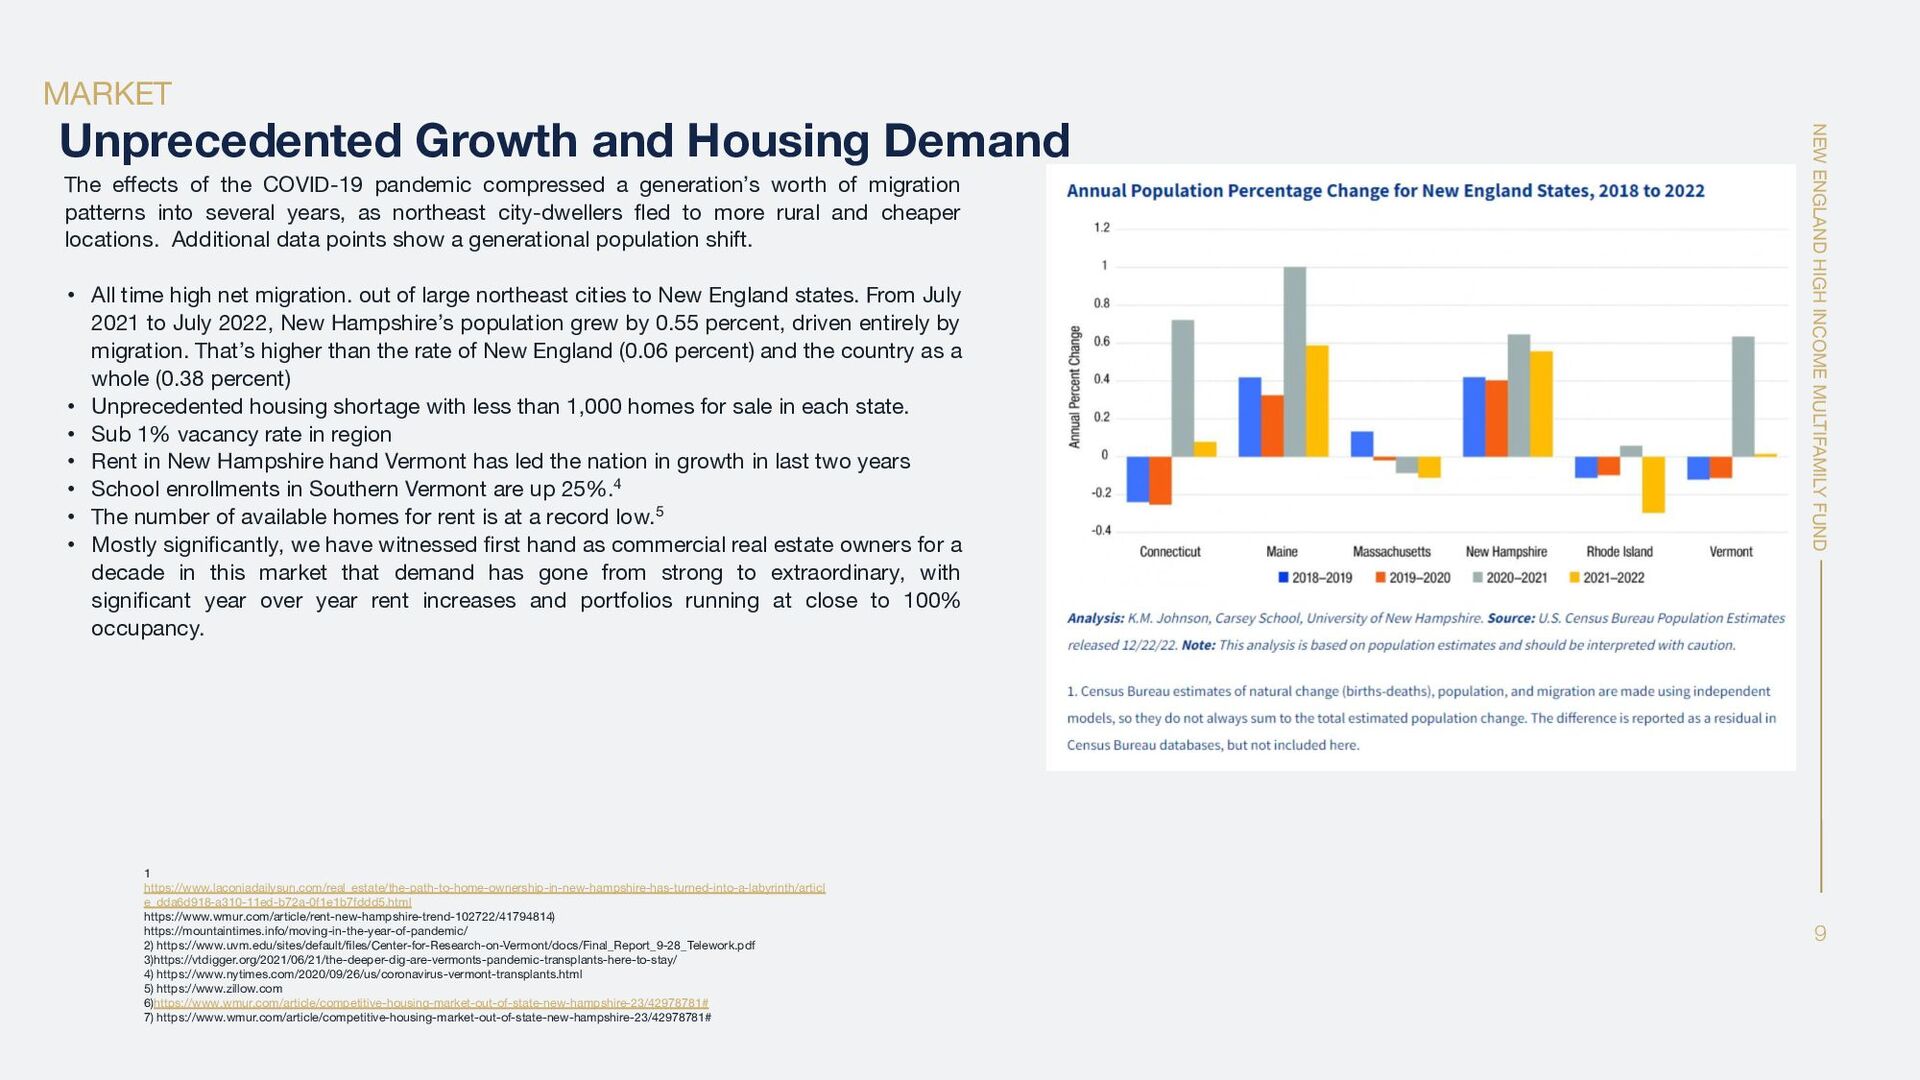
    COVID-19 pandemic compressed a generation’s worth of migration patterns into several years, as northeast city-dwellers fled to more rural and cheaper locations. Additional data points show a generational population shift. • All time high net migration. out of large northeast cities to New England states. From July 2021 to July 2022, New Hampshire’s population grew by 0.55 percent, driven entirely by migration. That’s higher than the rate of New England (0.06 percent) and the country as a whole (0.38 percent) • Unprecedented housing shortage with less than 1,000 homes for sale in each state. • Sub 1% vacancy rate in region • Rent in New Hampshire hand Vermont has led the nation in growth in last two years • School enrollments in Southern Vermont are up 25%.4 • The number of available homes for rent is at a record low.5 • Mostly significantly, we have witnessed first hand as commercial real estate owners for a decade in this market that demand has gone from strong to extraordinary, with significant year over year rent increases and portfolios running at close to 100% occupancy. 9 1 https://www.laconiadailysun.com/real_estate/the-path-to-home-ownership-in-new-hampshire-has-turned-into-a-labyrinth/articl e_dda6d918-a310-11ed-b72a-0f1e1b7fddd5.html https://www.wmur.com/article/rent-new-hampshire-trend-102722/41794814) https://mountaintimes.info/moving-in-the-year-of-pandemic/ 2) https://www.uvm.edu/sites/default/files/Center-for-Research-on-Vermont/docs/Final_Report_9-28_Telework.pdf 3)https://vtdigger.org/2021/06/21/the-deeper-dig-are-vermonts-pandemic-transplants-here-to-stay/ 4) https://www.nytimes.com/2020/09/26/us/coronavirus-vermont-transplants.html 5) https://www.zillow.com 6)https://www.wmur.com/article/competitive-housing-market-out-of-state-new-hampshire-23/42978781# 7) https://www.wmur.com/article/competitive-housing-market-out-of-state-new-hampshire-23/42978781# MARKET Unprecedented Growth and Housing Demand
  8. NEW ENGLAND HIGH INCOME MULTIFAMILY FUND The effects of the

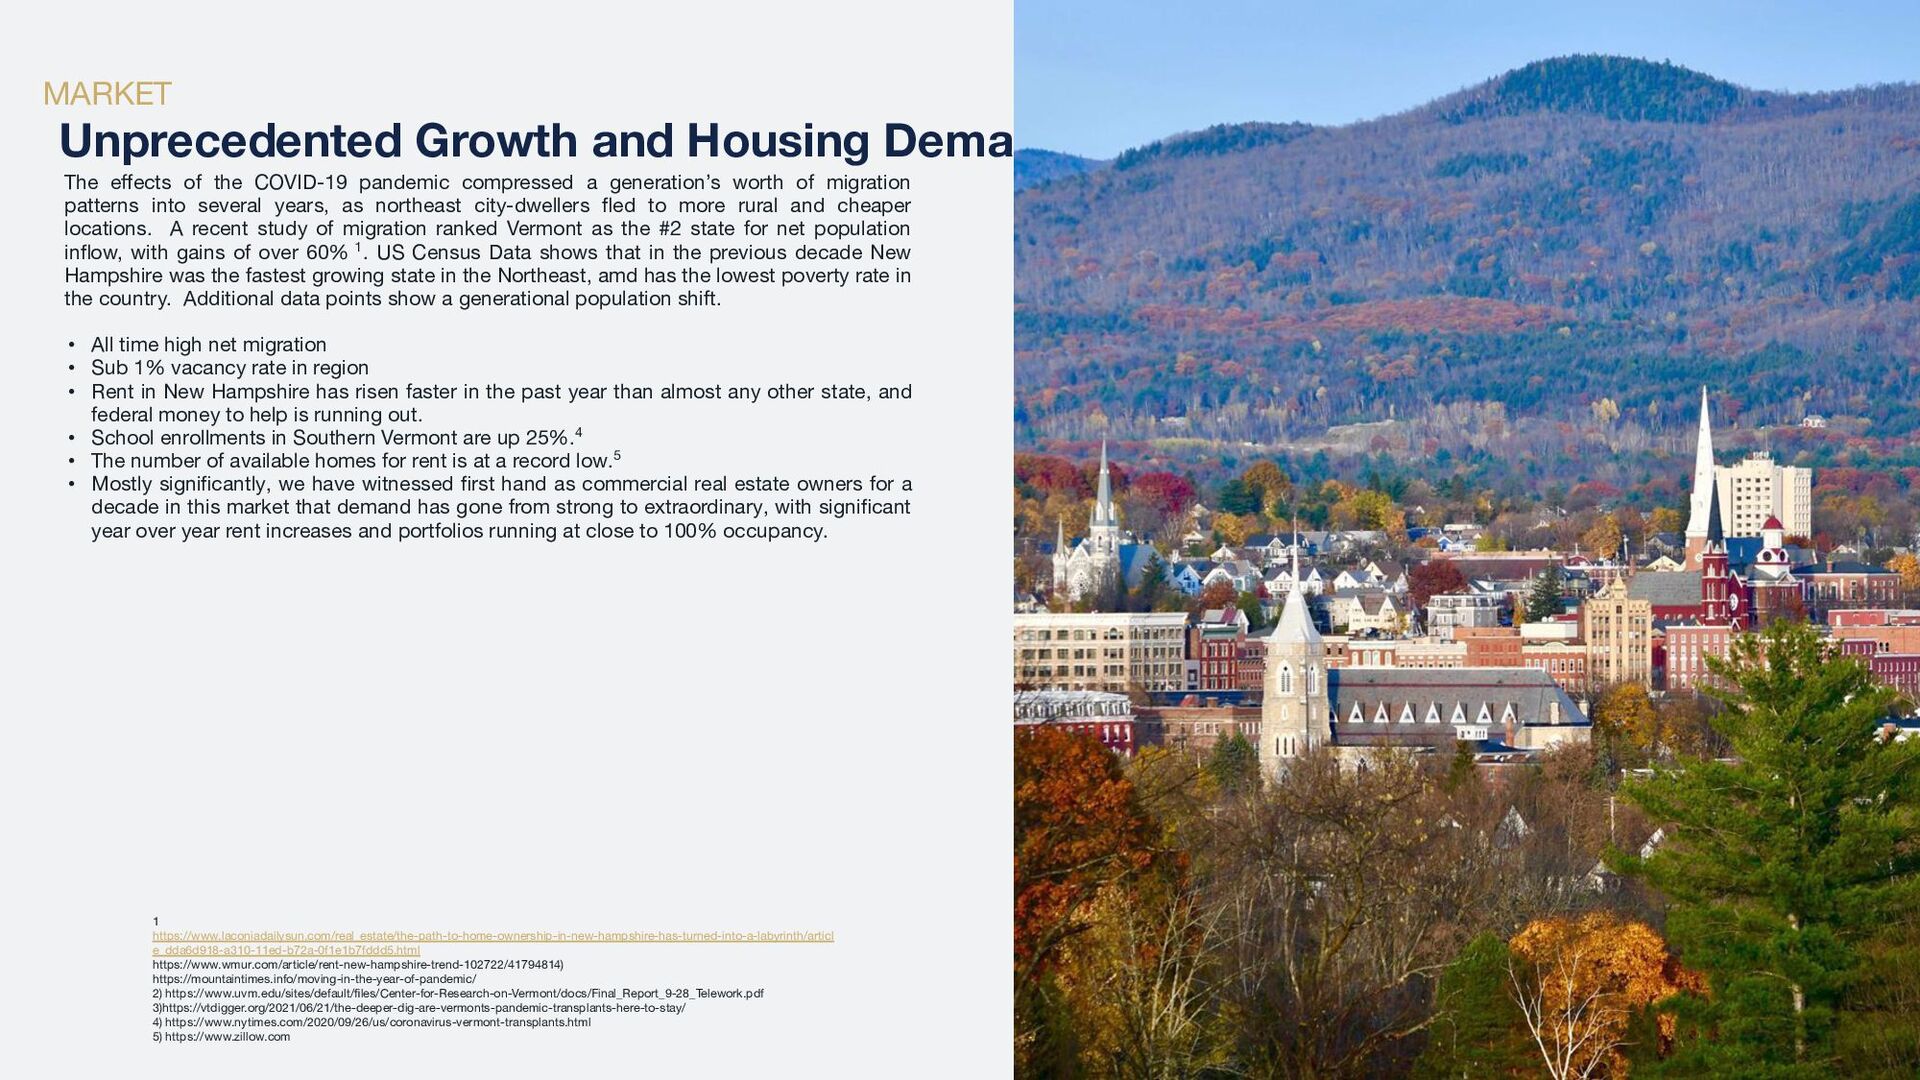
    COVID-19 pandemic compressed a generation’s worth of migration patterns into several years, as northeast city-dwellers fled to more rural and cheaper locations. A recent study of migration ranked Vermont as the #2 state for net population inflow, with gains of over 60% 1. US Census Data shows that in the previous decade New Hampshire was the fastest growing state in the Northeast, amd has the lowest poverty rate in the country. Additional data points show a generational population shift. • All time high net migration • Sub 1% vacancy rate in region • Rent in New Hampshire has risen faster in the past year than almost any other state, and federal money to help is running out. • School enrollments in Southern Vermont are up 25%.4 • The number of available homes for rent is at a record low.5 • Mostly significantly, we have witnessed first hand as commercial real estate owners for a decade in this market that demand has gone from strong to extraordinary, with significant year over year rent increases and portfolios running at close to 100% occupancy. 10 1 https://www.laconiadailysun.com/real_estate/the-path-to-home-ownership-in-new-hampshire-has-turned-into-a-labyrinth/articl e_dda6d918-a310-11ed-b72a-0f1e1b7fddd5.html https://www.wmur.com/article/rent-new-hampshire-trend-102722/41794814) https://mountaintimes.info/moving-in-the-year-of-pandemic/ 2) https://www.uvm.edu/sites/default/files/Center-for-Research-on-Vermont/docs/Final_Report_9-28_Telework.pdf 3)https://vtdigger.org/2021/06/21/the-deeper-dig-are-vermonts-pandemic-transplants-here-to-stay/ 4) https://www.nytimes.com/2020/09/26/us/coronavirus-vermont-transplants.html 5) https://www.zillow.com MARKET Unprecedented Growth and Housing Demand
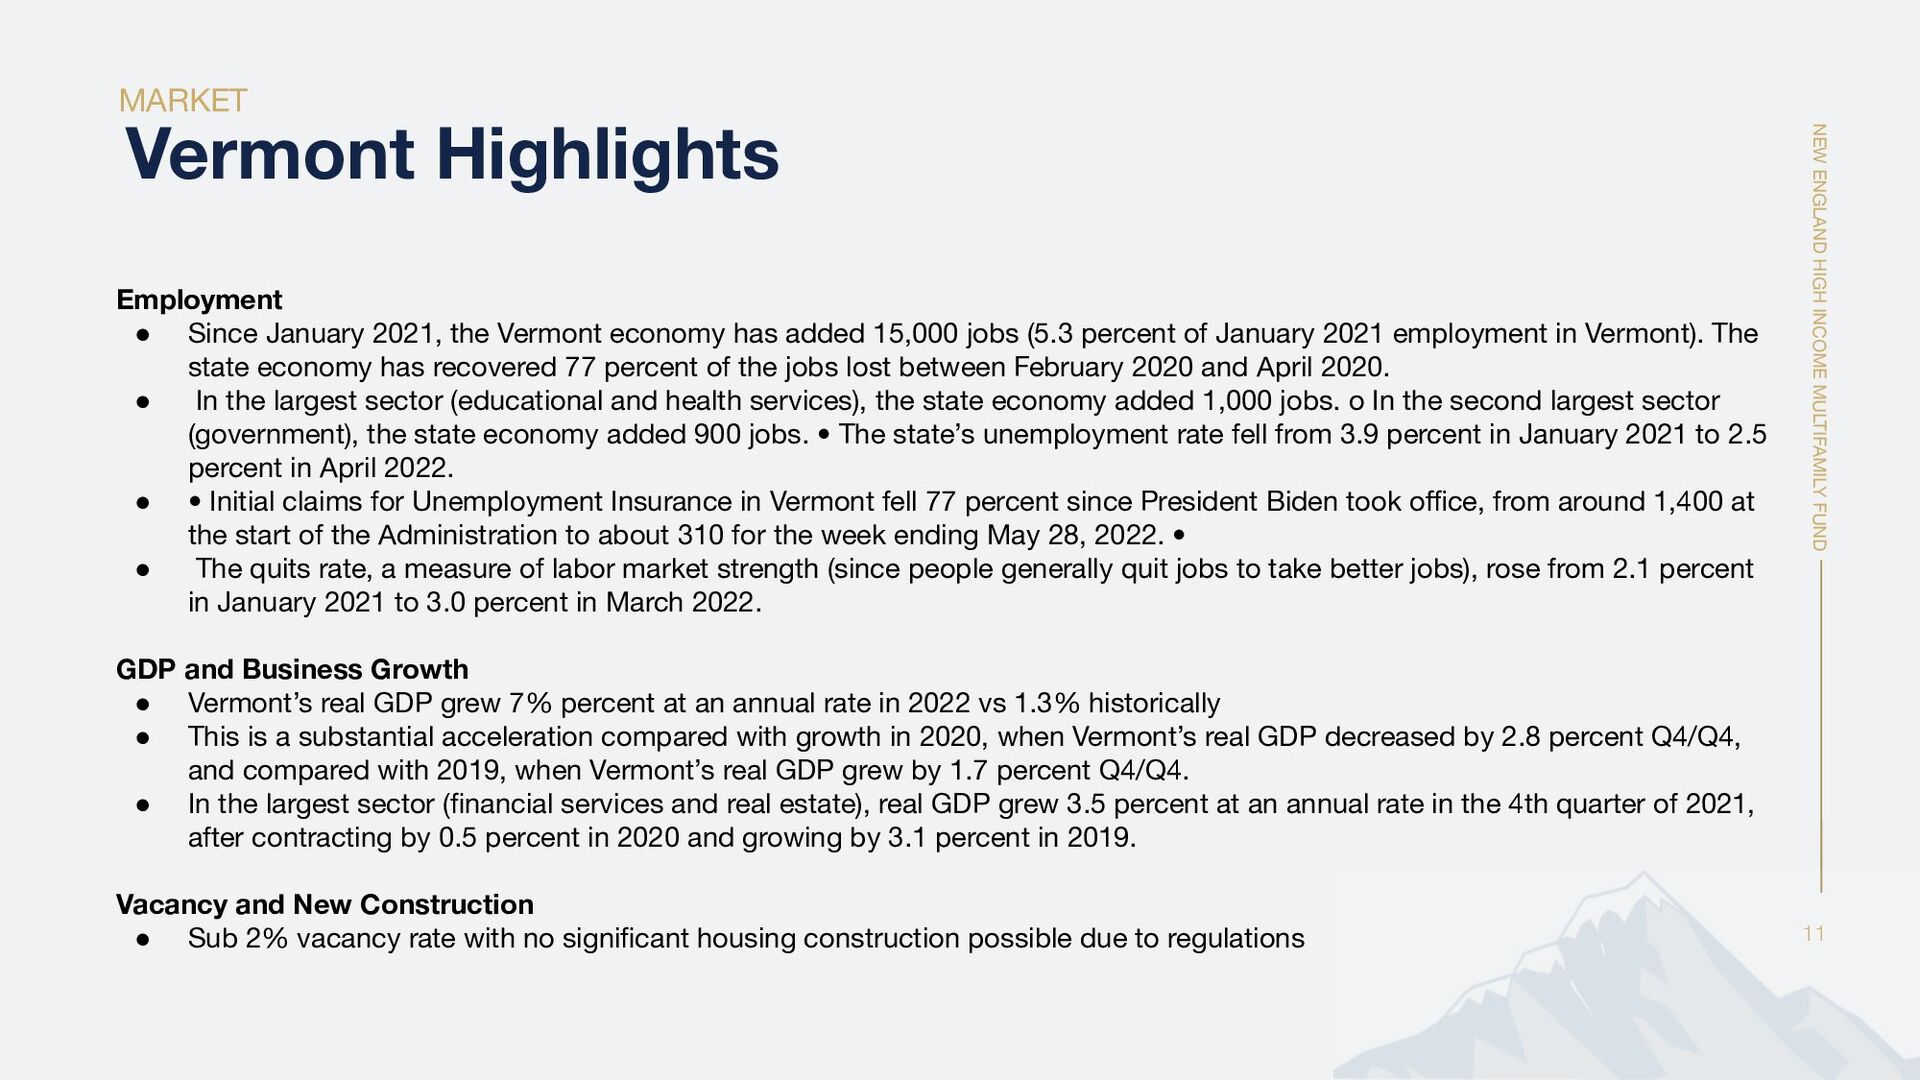
  9. NEW ENGLAND HIGH INCOME MULTIFAMILY FUND 11 MARKET Vermont Highlights

    Employment • Since January 2021, the Vermont economy has added 15,000 jobs (5.3 percent of January 2021 employment in Vermont). The state economy has recovered 77 percent of the jobs lost between February 2020 and April 2020. • In the largest sector (educational and health services), the state economy added 1,000 jobs. o In the second largest sector (government), the state economy added 900 jobs. • The state’s unemployment rate fell from 3.9 percent in January 2021 to 2.5 percent in April 2022. • • Initial claims for Unemployment Insurance in Vermont fell 77 percent since President Biden took office, from around 1,400 at the start of the Administration to about 310 for the week ending May 28, 2022. • • The quits rate, a measure of labor market strength (since people generally quit jobs to take better jobs), rose from 2.1 percent in January 2021 to 3.0 percent in March 2022. GDP and Business Growth • Vermont’s real GDP grew 7% percent at an annual rate in 2022 vs 1.3% historically • This is a substantial acceleration compared with growth in 2020, when Vermont’s real GDP decreased by 2.8 percent Q4/Q4, and compared with 2019, when Vermont’s real GDP grew by 1.7 percent Q4/Q4. • In the largest sector (financial services and real estate), real GDP grew 3.5 percent at an annual rate in the 4th quarter of 2021, after contracting by 0.5 percent in 2020 and growing by 3.1 percent in 2019. Vacancy and New Construction • Sub 2% vacancy rate with no significant housing construction possible due to regulations
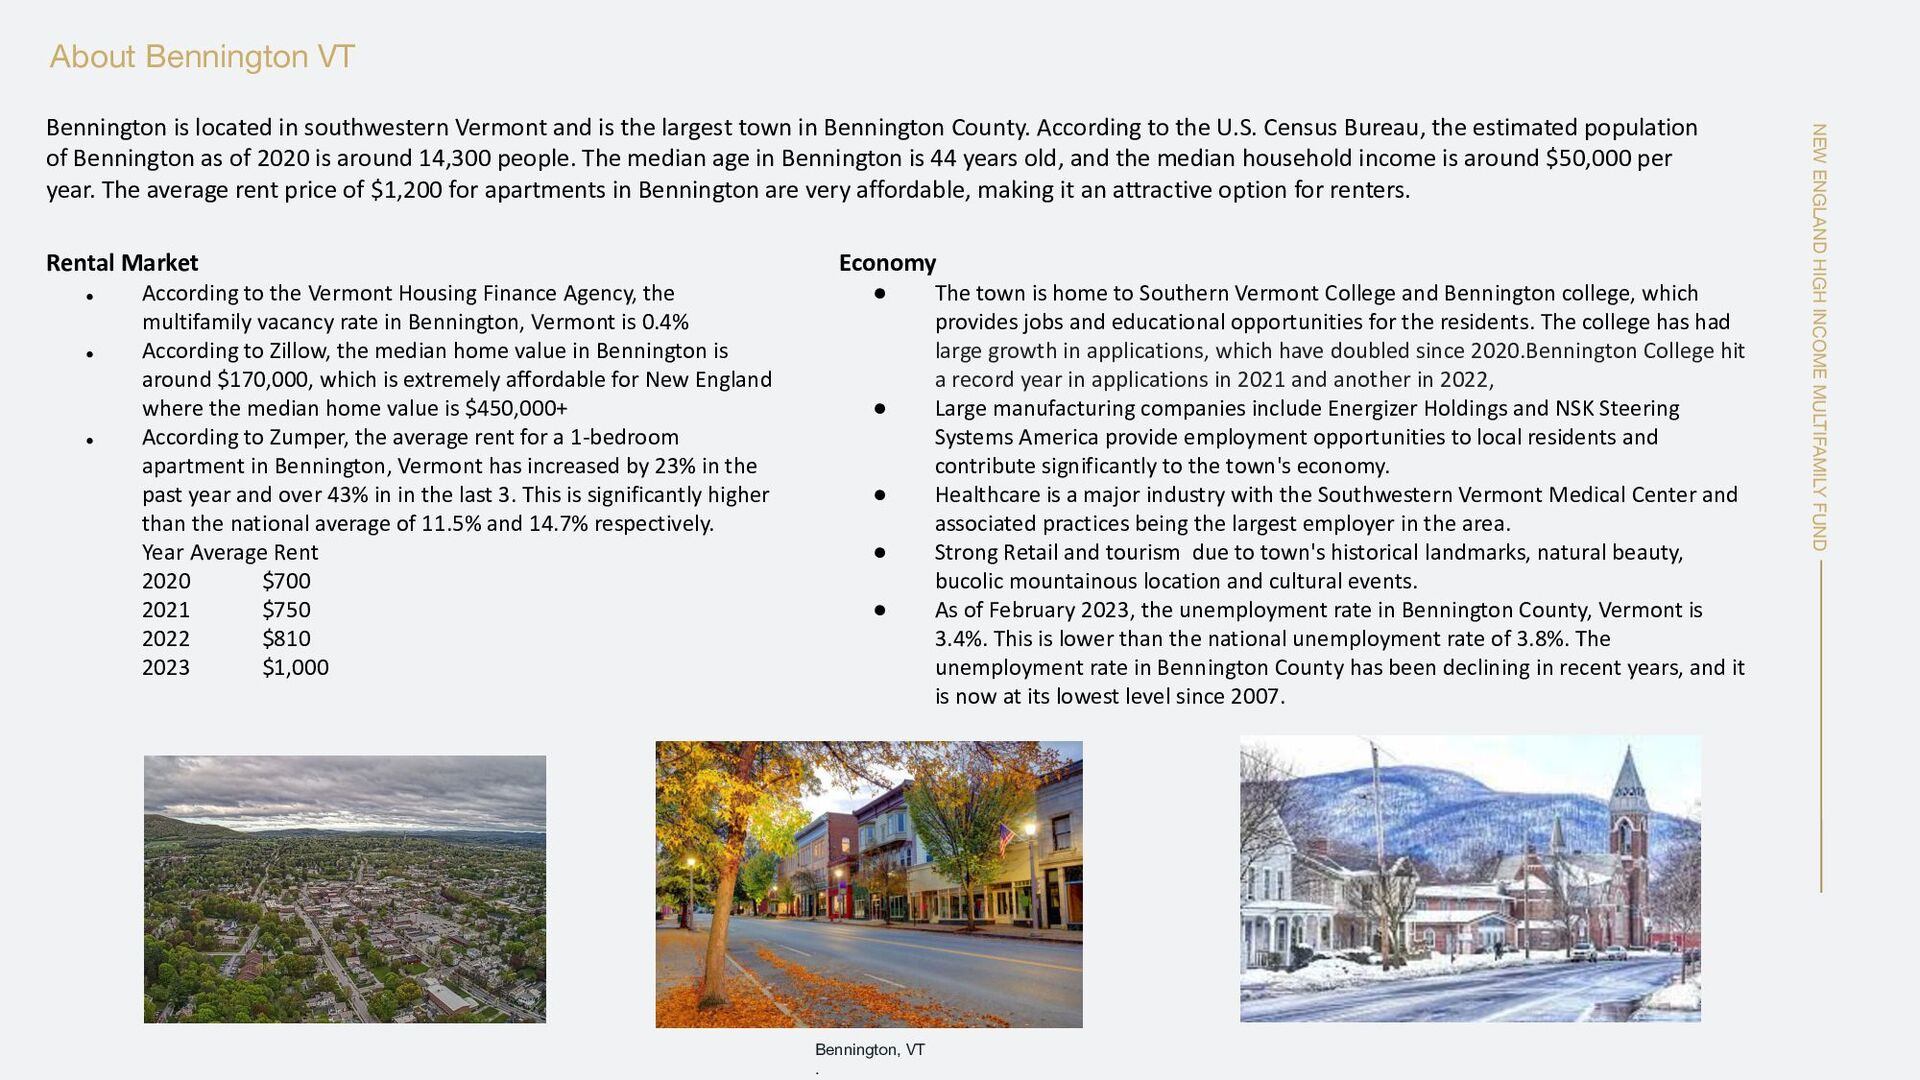
  10. NEW ENGLAND HIGH INCOME MULTIFAMILY FUND About Bennington VT Bennington,

    VT . Bennington is located in southwestern Vermont and is the largest town in Bennington County. According to the U.S. Census Bureau, the estimated population of Bennington as of 2020 is around 14,300 people. The median age in Bennington is 44 years old, and the median household income is around $50,000 per year. The average rent price of $1,200 for apartments in Bennington are very affordable, making it an attractive option for renters. Rental Market • According to the Vermont Housing Finance Agency, the multifamily vacancy rate in Bennington, Vermont is 0.4% • According to Zillow, the median home value in Bennington is around $170,000, which is extremely affordable for New England where the median home value is $450,000+ • According to Zumper, the average rent for a 1-bedroom apartment in Bennington, Vermont has increased by 23% in the past year and over 43% in in the last 3. This is significantly higher than the national average of 11.5% and 14.7% respectively. Year Average Rent 2020 $700 2021 $750 2022 $810 2023 $1,000 Economy • The town is home to Southern Vermont College and Bennington college, which provides jobs and educational opportunities for the residents. The college has had large growth in applications, which have doubled since 2020.Bennington College hit a record year in applications in 2021 and another in 2022, • Large manufacturing companies include Energizer Holdings and NSK Steering Systems America provide employment opportunities to local residents and contribute significantly to the town's economy. • Healthcare is a major industry with the Southwestern Vermont Medical Center and associated practices being the largest employer in the area. • Strong Retail and tourism due to town's historical landmarks, natural beauty, bucolic mountainous location and cultural events. • As of February 2023, the unemployment rate in Bennington County, Vermont is 3.4%. This is lower than the national unemployment rate of 3.8%. The unemployment rate in Bennington County has been declining in recent years, and it is now at its lowest level since 2007.
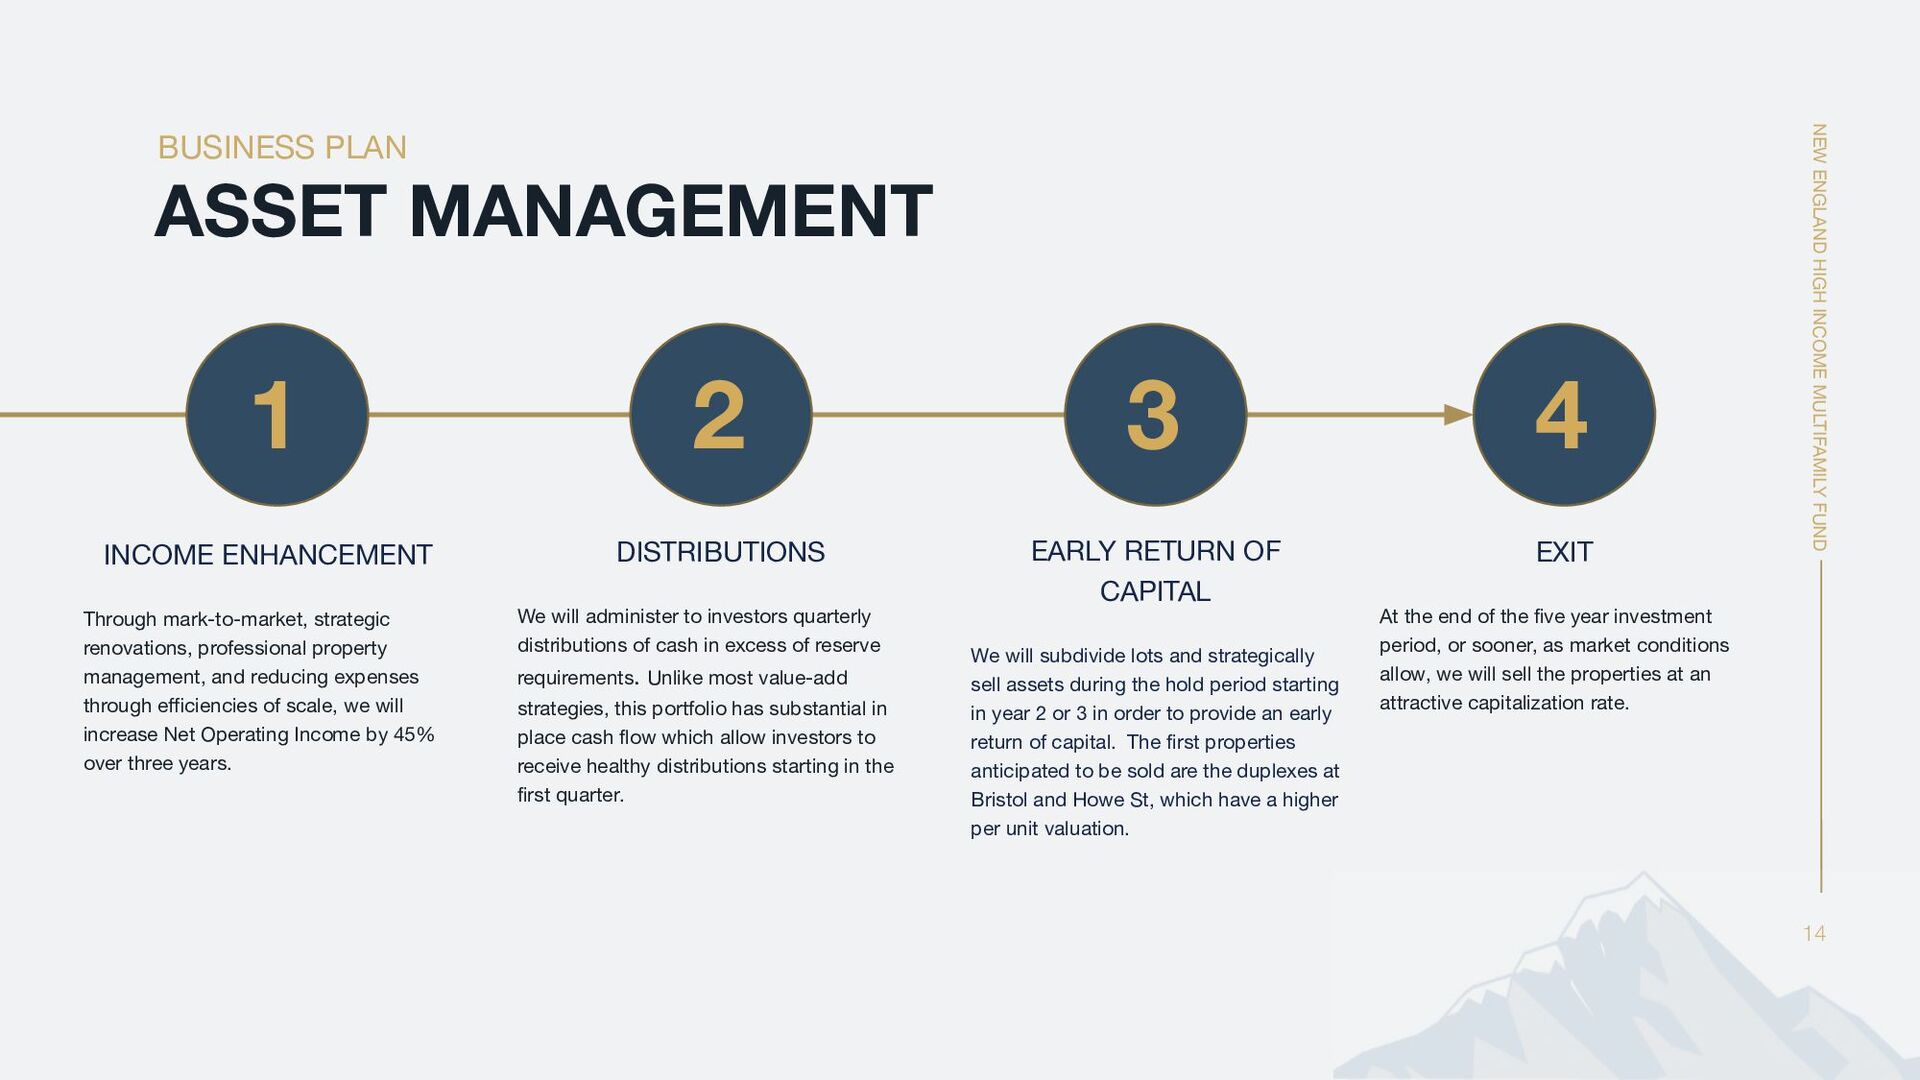
  11. NEW ENGLAND HIGH INCOME MULTIFAMILY FUND ASSET MANAGEMENT BUSINESS PLAN

    INCOME ENHANCEMENT Through mark-to-market, strategic renovations, professional property management, and reducing expenses through efficiencies of scale, we will increase Net Operating Income by 45% over three years. DISTRIBUTIONS We will administer to investors quarterly distributions of cash in excess of reserve requirements. Unlike most value-add strategies, this portfolio has substantial in place cash flow which allow investors to receive healthy distributions starting in the first quarter. EARLY RETURN OF CAPITAL We will subdivide lots and strategically sell assets during the hold period starting in year 2 or 3 in order to provide an early return of capital. The first properties anticipated to be sold are the duplexes at Bristol and Howe St, which have a higher per unit valuation. EXIT At the end of the five year investment period, or sooner, as market conditions allow, we will sell the properties at an attractive capitalization rate. 14 1 2 3 4
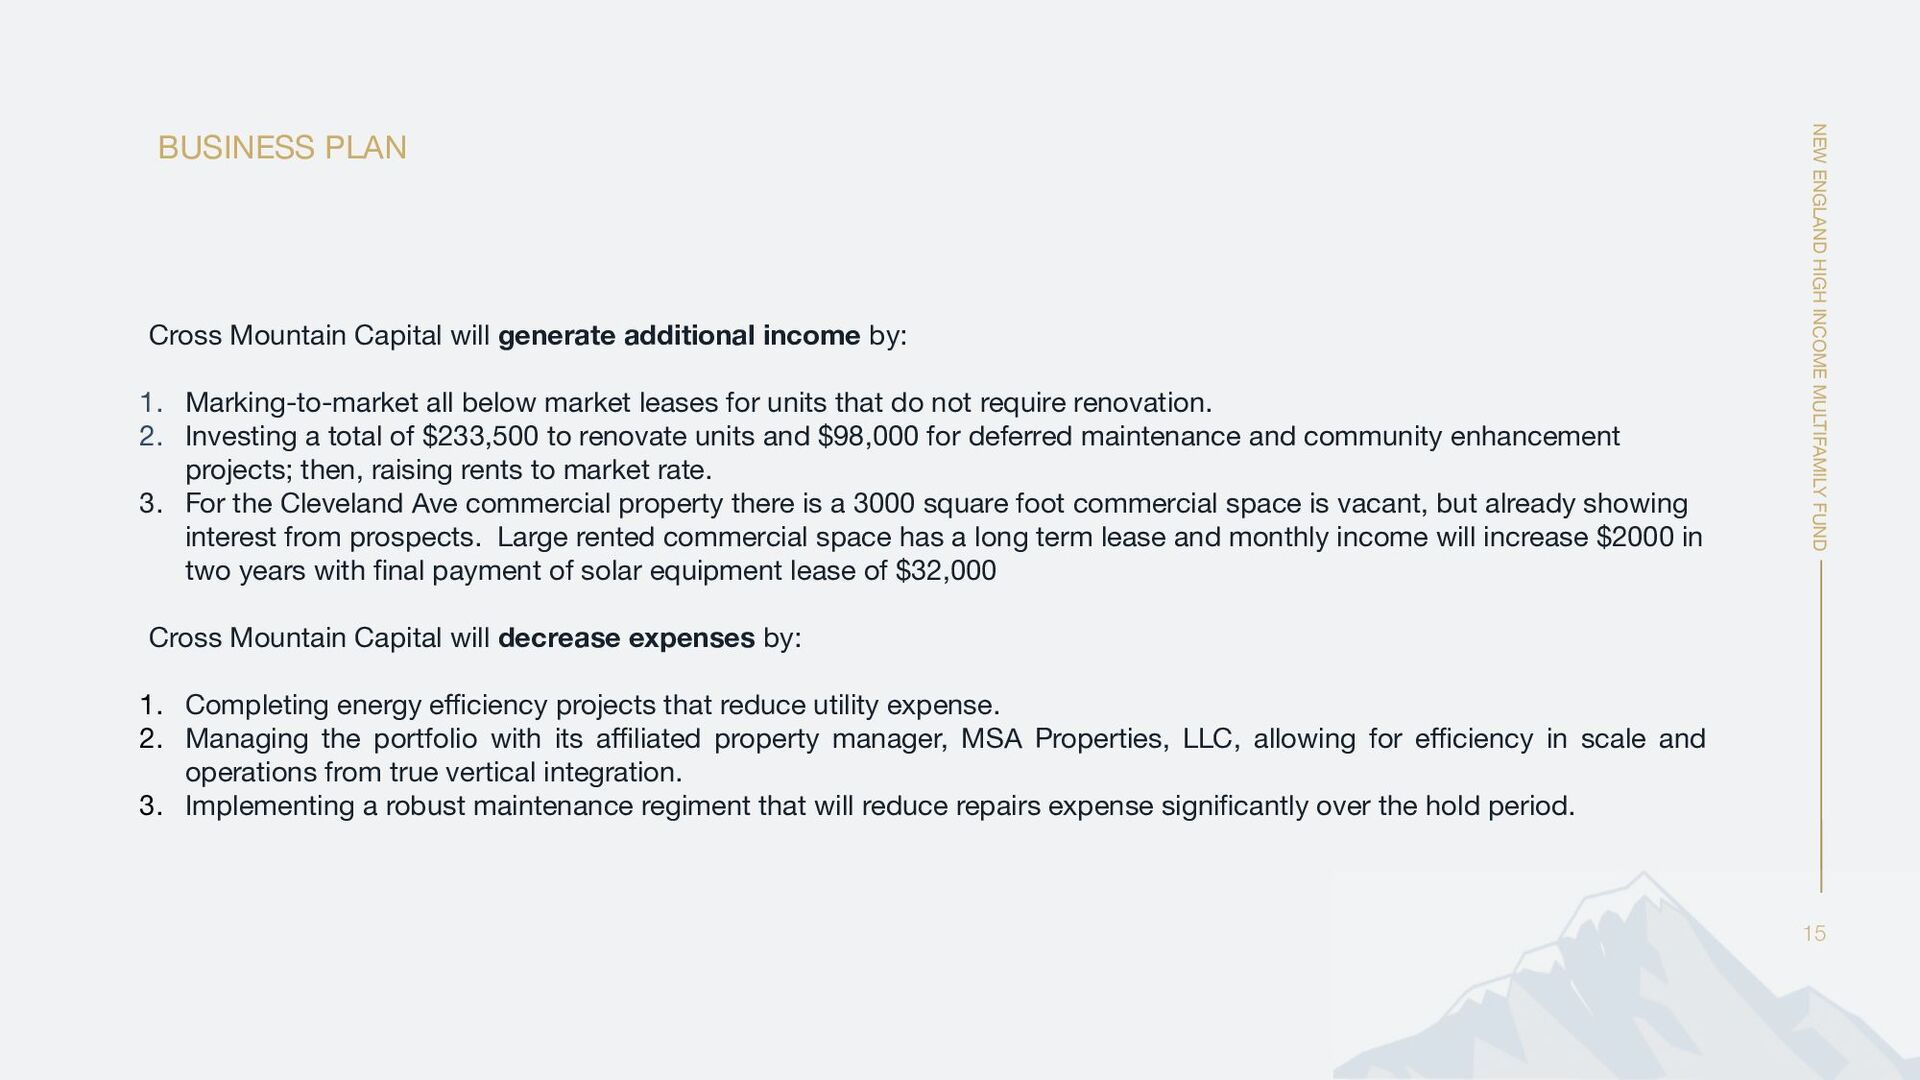
  12. NEW ENGLAND HIGH INCOME MULTIFAMILY FUND BUSINESS PLAN 15 Cross

    Mountain Capital will generate additional income by: 1. Marking-to-market all below market leases for units that do not require renovation. 2. Investing a total of $233,500 to renovate units and $98,000 for deferred maintenance and community enhancement projects; then, raising rents to market rate. 3. For the Cleveland Ave commercial property there is a 3000 square foot commercial space is vacant, but already showing interest from prospects. Large rented commercial space has a long term lease and monthly income will increase $2000 in two years with final payment of solar equipment lease of $32,000 Cross Mountain Capital will decrease expenses by: 1. Completing energy efficiency projects that reduce utility expense. 2. Managing the portfolio with its affiliated property manager, MSA Properties, LLC, allowing for efficiency in scale and operations from true vertical integration. 3. Implementing a robust maintenance regiment that will reduce repairs expense significantly over the hold period.
  13. NEW ENGLAND HIGH INCOME MULTIFAMILY FUND BUSINESS PLAN 16 UNIT

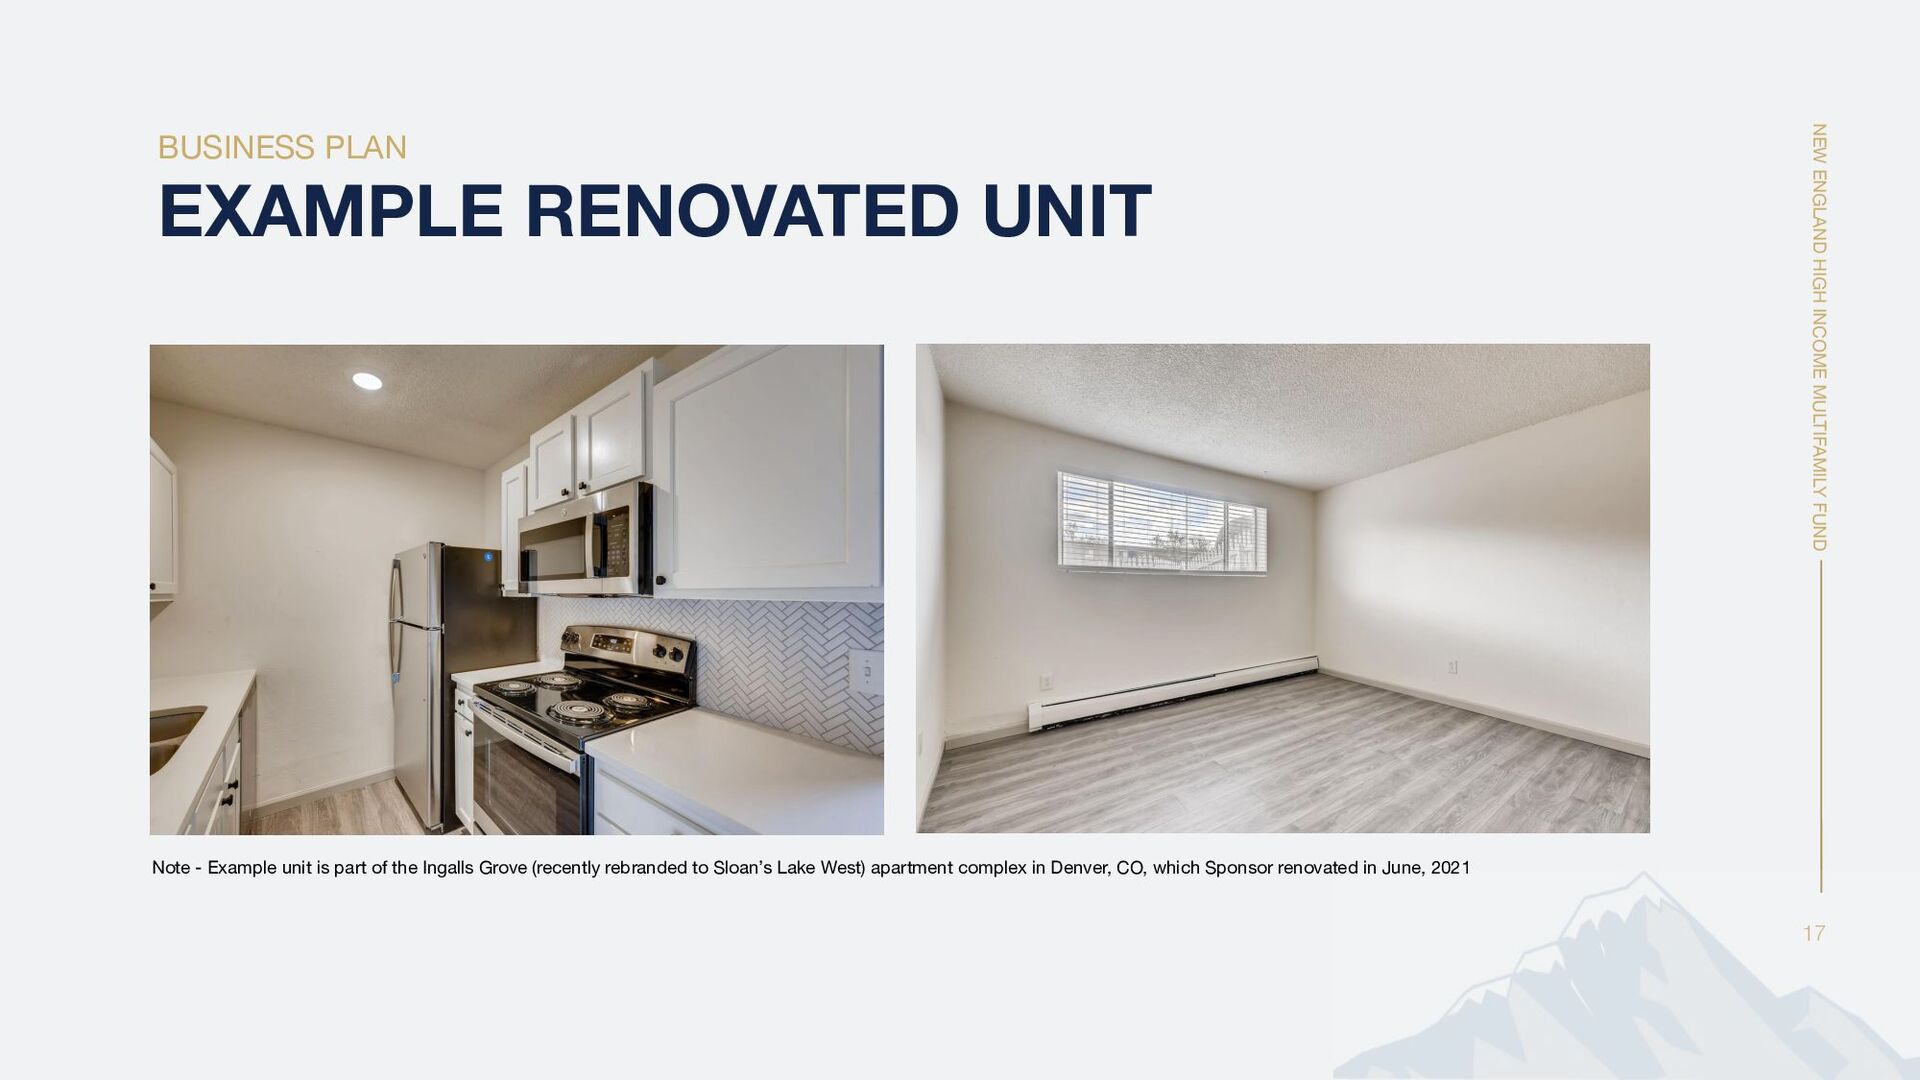
    RENOVATION PLAN Vinyl plank flooring in all units that do not currently have hardwood or vinyl planks. Fresh two-toned paint in neutral colors for all units Stainless steel appliances in most units Quartz or granite countertops in some units Stock shaker cabinets in some units New fixtures in some units
  14. NEW ENGLAND HIGH INCOME MULTIFAMILY FUND BUSINESS PLAN 17 EXAMPLE

    RENOVATED UNIT Note - Example unit is part of the Ingalls Grove (recently rebranded to Sloan’s Lake West) apartment complex in Denver, CO, which Sponsor renovated in June, 2021
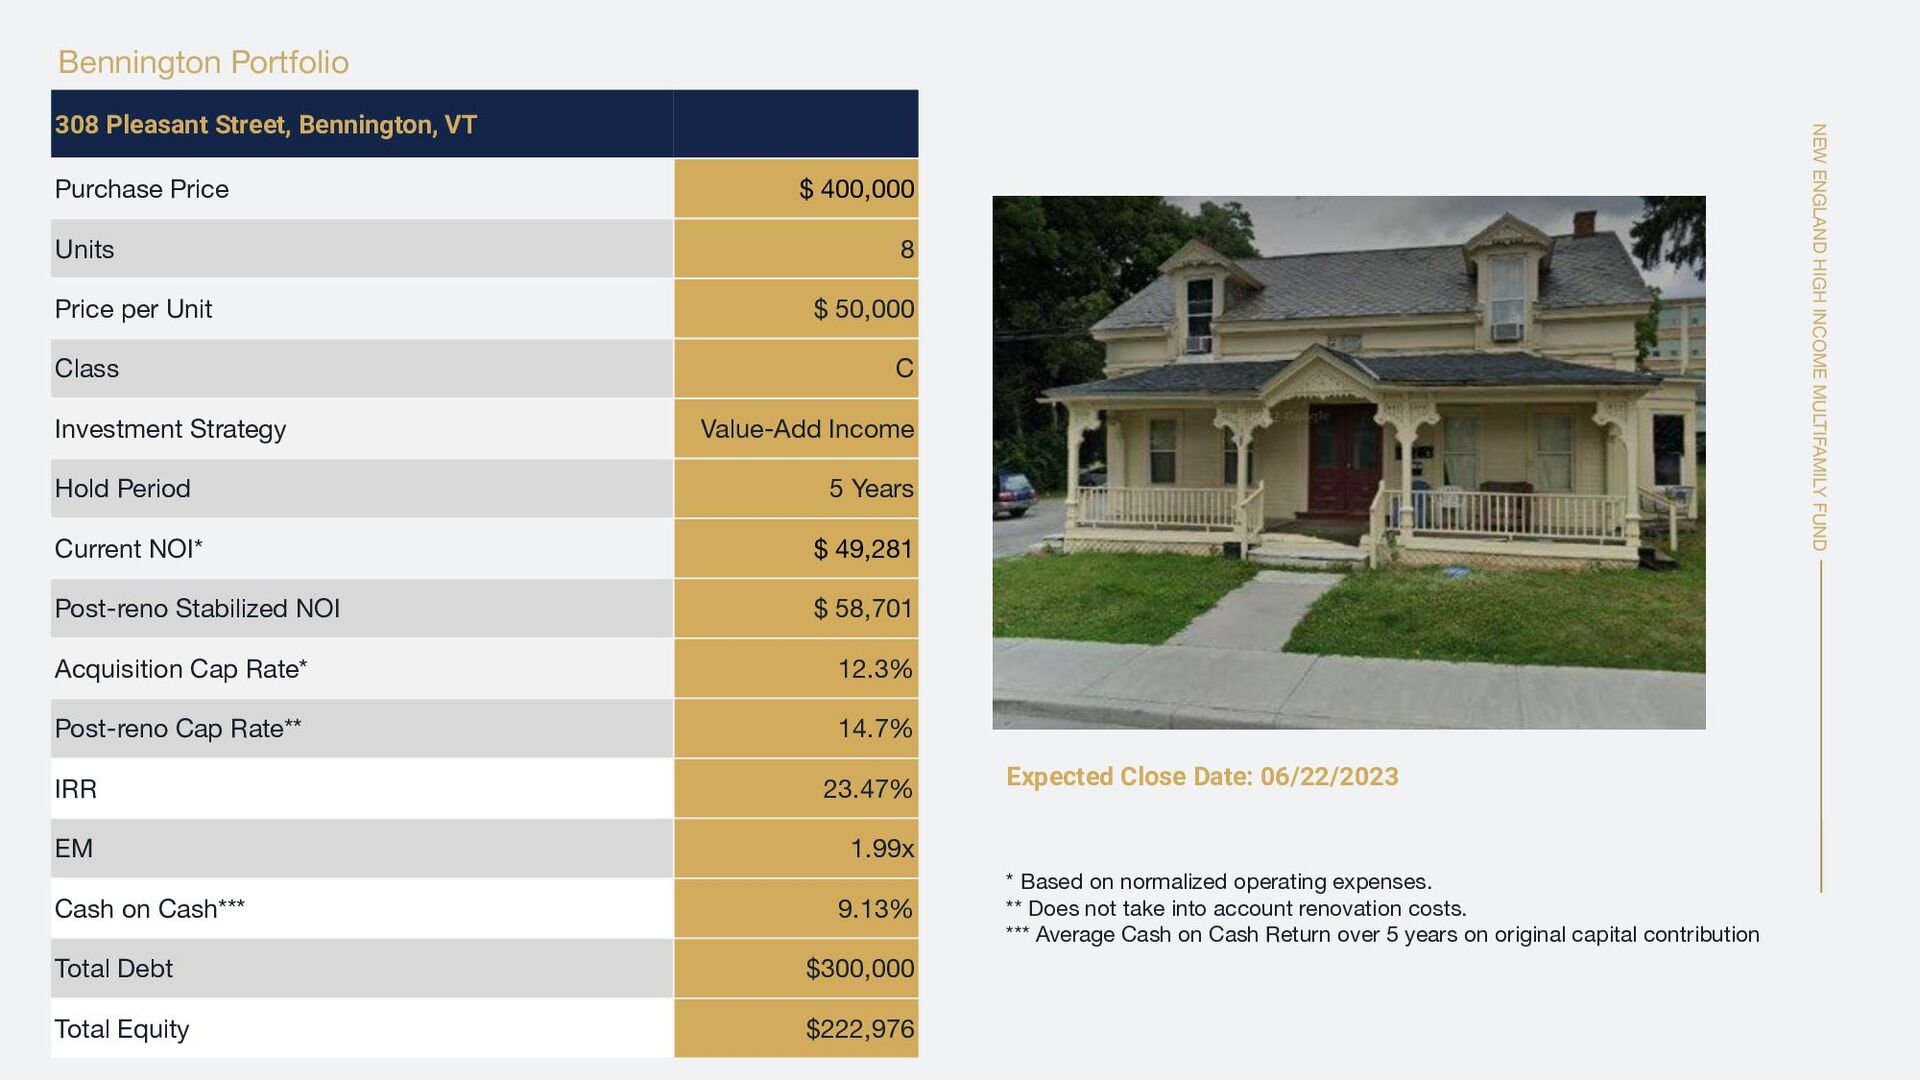
  15. NEW ENGLAND HIGH INCOME MULTIFAMILY FUND Bennington Portfolio 308 Pleasant

    Street, Bennington, VT Purchase Price $ 400,000 Units 8 Price per Unit $ 50,000 Class C Investment Strategy Value-Add Income Hold Period 5 Years Current NOI* $ 49,281 Post-reno Stabilized NOI $ 58,701 Acquisition Cap Rate* 12.3% Post-reno Cap Rate** 14.7% IRR 23.47% EM 1.99x Cash on Cash*** 9.13% Total Debt $300,000 Total Equity $222,976 * Based on normalized operating expenses. ** Does not take into account renovation costs. *** Average Cash on Cash Return over 5 years on original capital contribution Expected Close Date: 06/22/2023
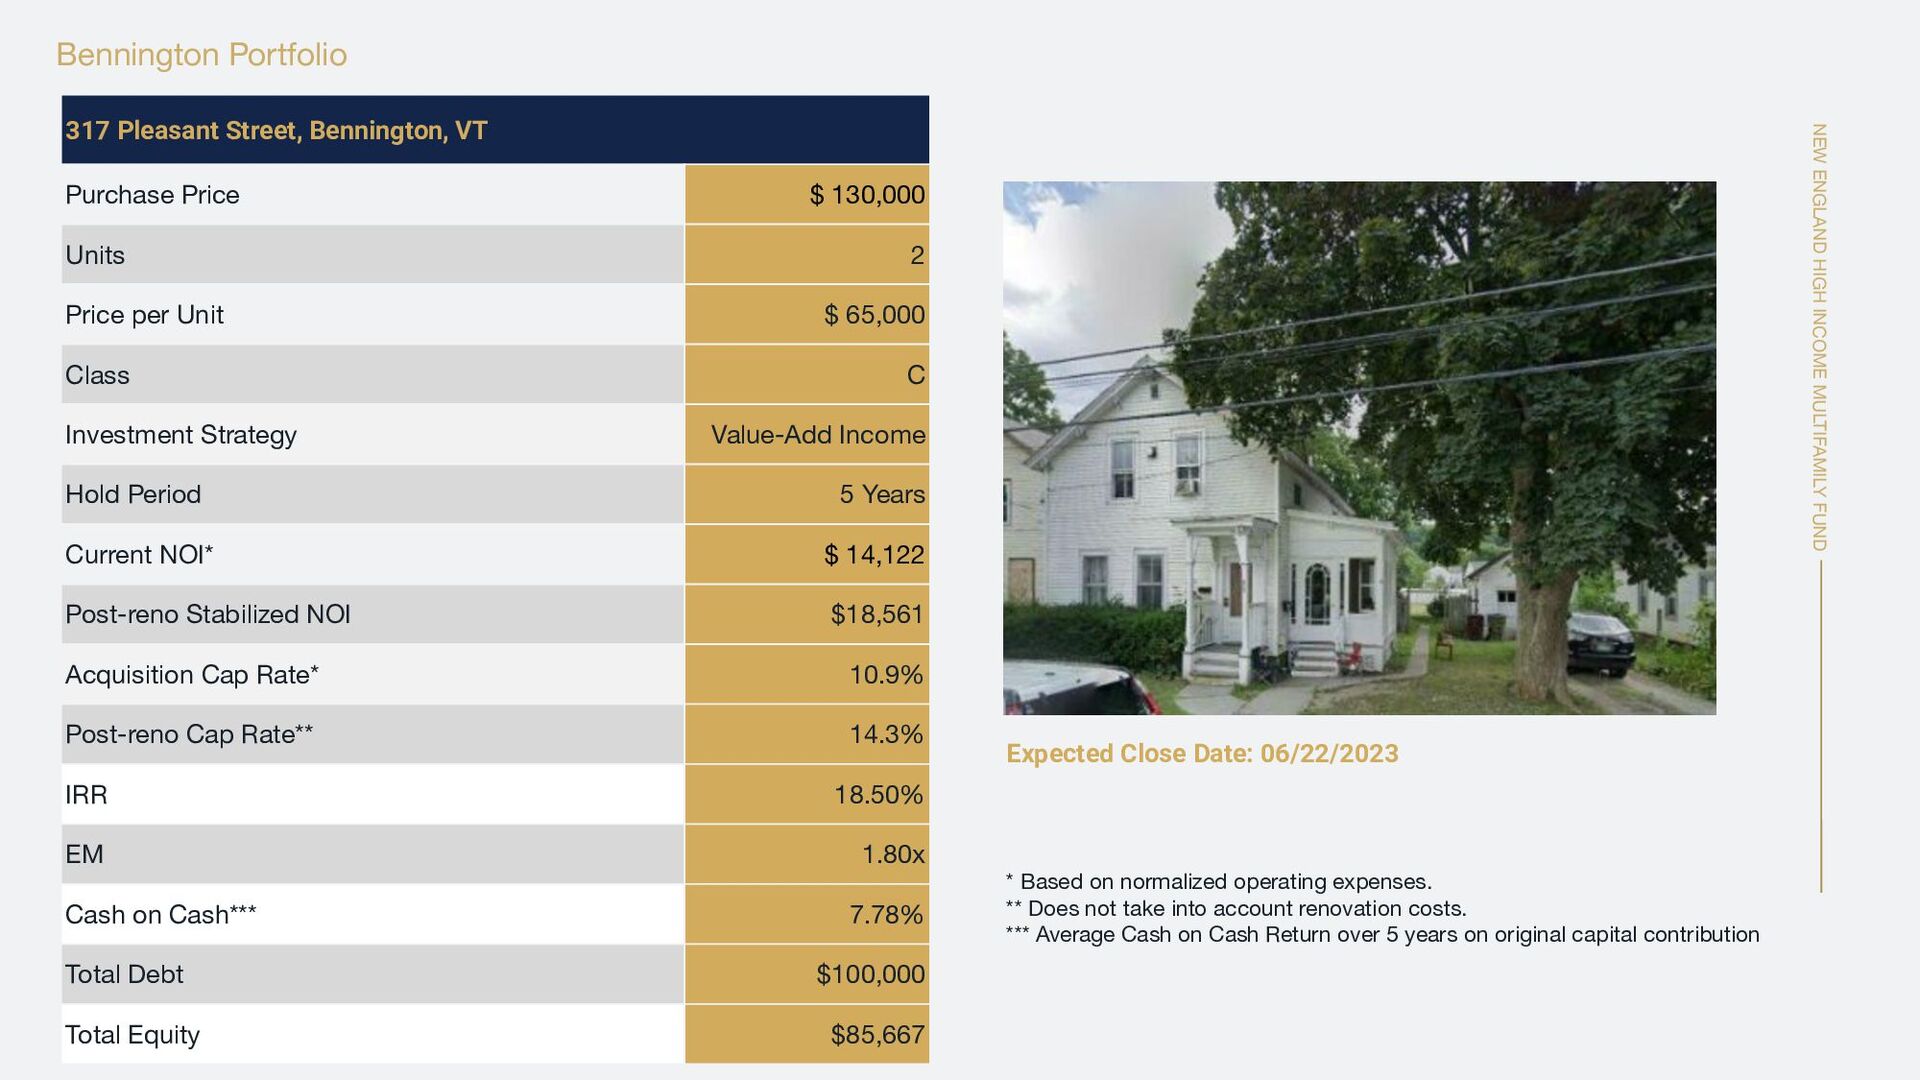
  16. NEW ENGLAND HIGH INCOME MULTIFAMILY FUND Bennington Portfolio 317 Pleasant

    Street, Bennington, VT Purchase Price $ 130,000 Units 2 Price per Unit $ 65,000 Class C Investment Strategy Value-Add Income Hold Period 5 Years Current NOI* $ 14,122 Post-reno Stabilized NOI $18,561 Acquisition Cap Rate* 10.9% Post-reno Cap Rate** 14.3% IRR 18.50% EM 1.80x Cash on Cash*** 7.78% Total Debt $100,000 Total Equity $85,667 * Based on normalized operating expenses. ** Does not take into account renovation costs. *** Average Cash on Cash Return over 5 years on original capital contribution Expected Close Date: 06/22/2023
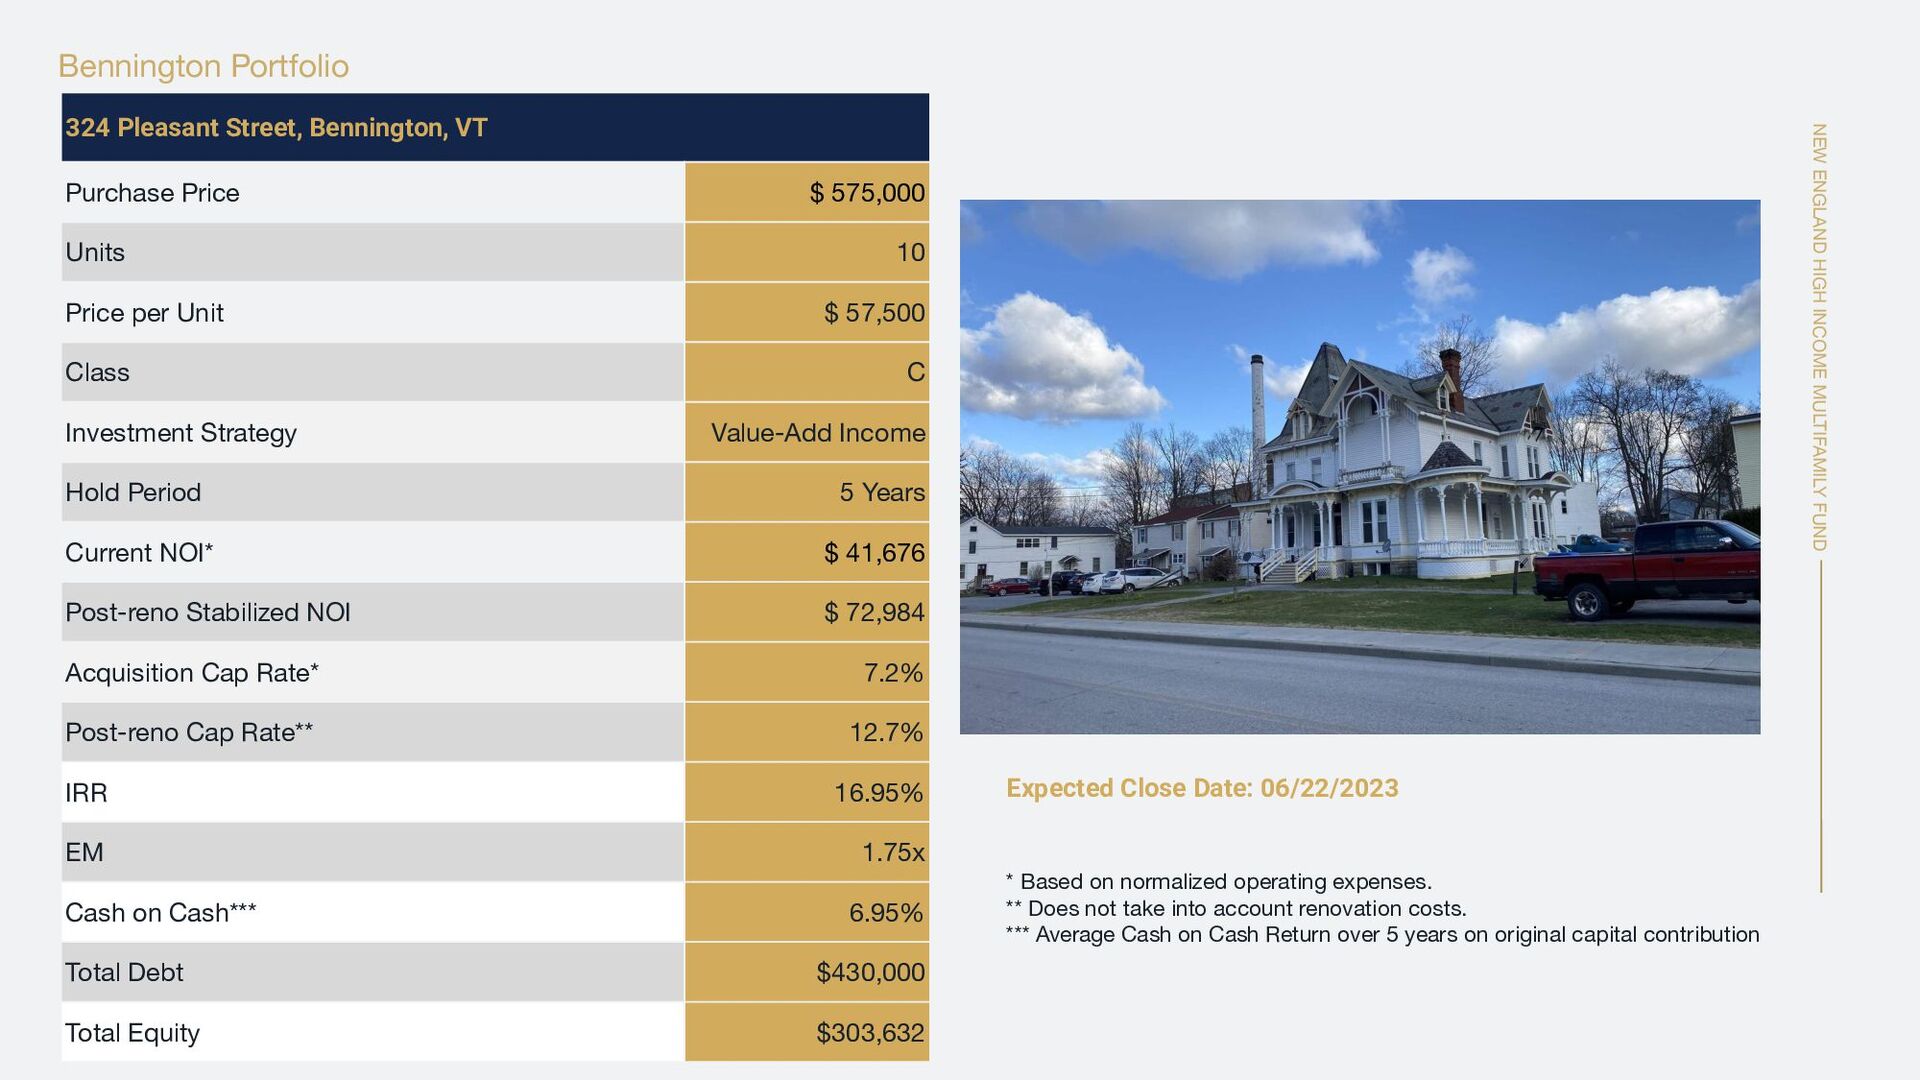
  17. NEW ENGLAND HIGH INCOME MULTIFAMILY FUND Bennington Portfolio 324 Pleasant

    Street, Bennington, VT Purchase Price $ 575,000 Units 10 Price per Unit $ 57,500 Class C Investment Strategy Value-Add Income Hold Period 5 Years Current NOI* $ 41,676 Post-reno Stabilized NOI $ 72,984 Acquisition Cap Rate* 7.2% Post-reno Cap Rate** 12.7% IRR 16.95% EM 1.75x Cash on Cash*** 6.95% Total Debt $430,000 Total Equity $303,632 * Based on normalized operating expenses. ** Does not take into account renovation costs. *** Average Cash on Cash Return over 5 years on original capital contribution Expected Close Date: 06/22/2023
  18. NEW ENGLAND HIGH INCOME MULTIFAMILY FUND Bennington Portfolio 326 Pleasant

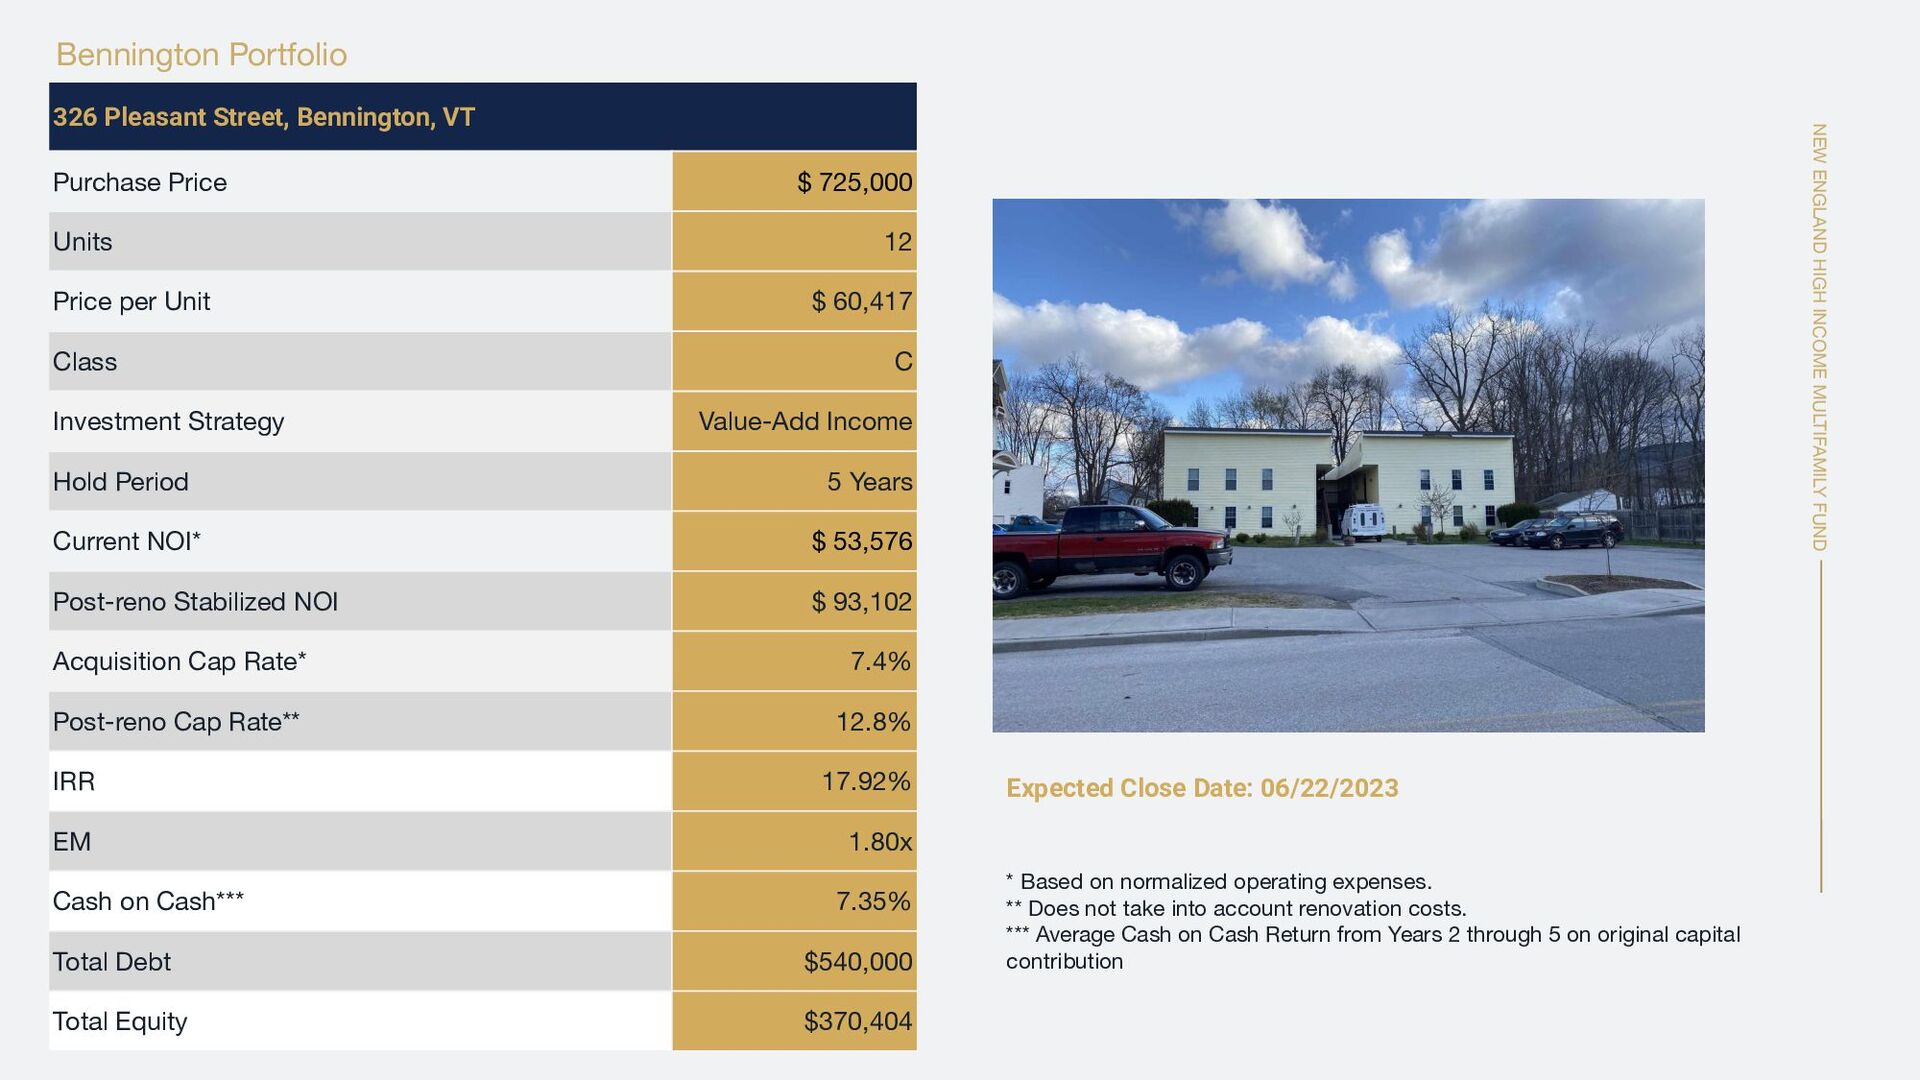
    Street, Bennington, VT Purchase Price $ 725,000 Units 12 Price per Unit $ 60,417 Class C Investment Strategy Value-Add Income Hold Period 5 Years Current NOI* $ 53,576 Post-reno Stabilized NOI $ 93,102 Acquisition Cap Rate* 7.4% Post-reno Cap Rate** 12.8% IRR 17.92% EM 1.80x Cash on Cash*** 7.35% Total Debt $540,000 Total Equity $370,404 * Based on normalized operating expenses. ** Does not take into account renovation costs. *** Average Cash on Cash Return from Years 2 through 5 on original capital contribution Expected Close Date: 06/22/2023
  19. NEW ENGLAND HIGH INCOME MULTIFAMILY FUND Bennington Portfolio 563 Main

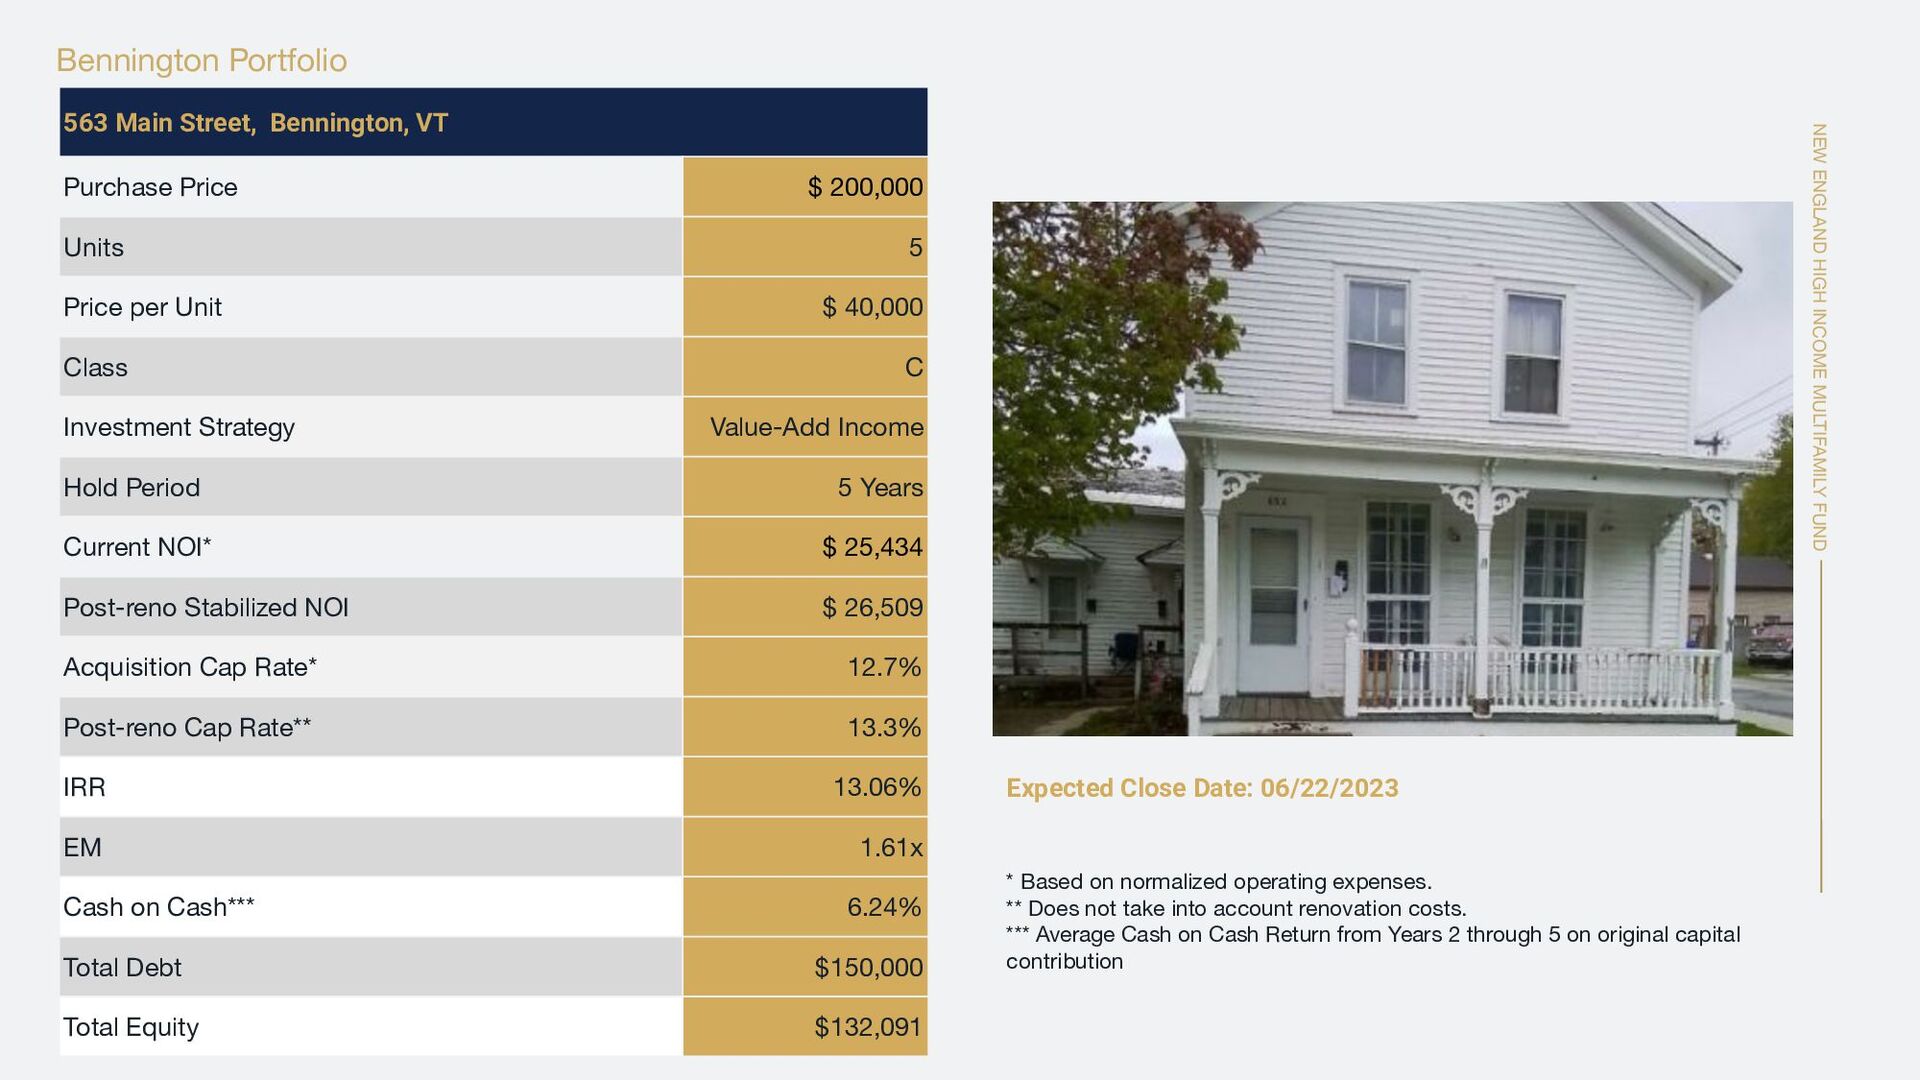
    Street, Bennington, VT Purchase Price $ 200,000 Units 5 Price per Unit $ 40,000 Class C Investment Strategy Value-Add Income Hold Period 5 Years Current NOI* $ 25,434 Post-reno Stabilized NOI $ 26,509 Acquisition Cap Rate* 12.7% Post-reno Cap Rate** 13.3% IRR 13.06% EM 1.61x Cash on Cash*** 6.24% Total Debt $150,000 Total Equity $132,091 * Based on normalized operating expenses. ** Does not take into account renovation costs. *** Average Cash on Cash Return from Years 2 through 5 on original capital contribution Expected Close Date: 06/22/2023
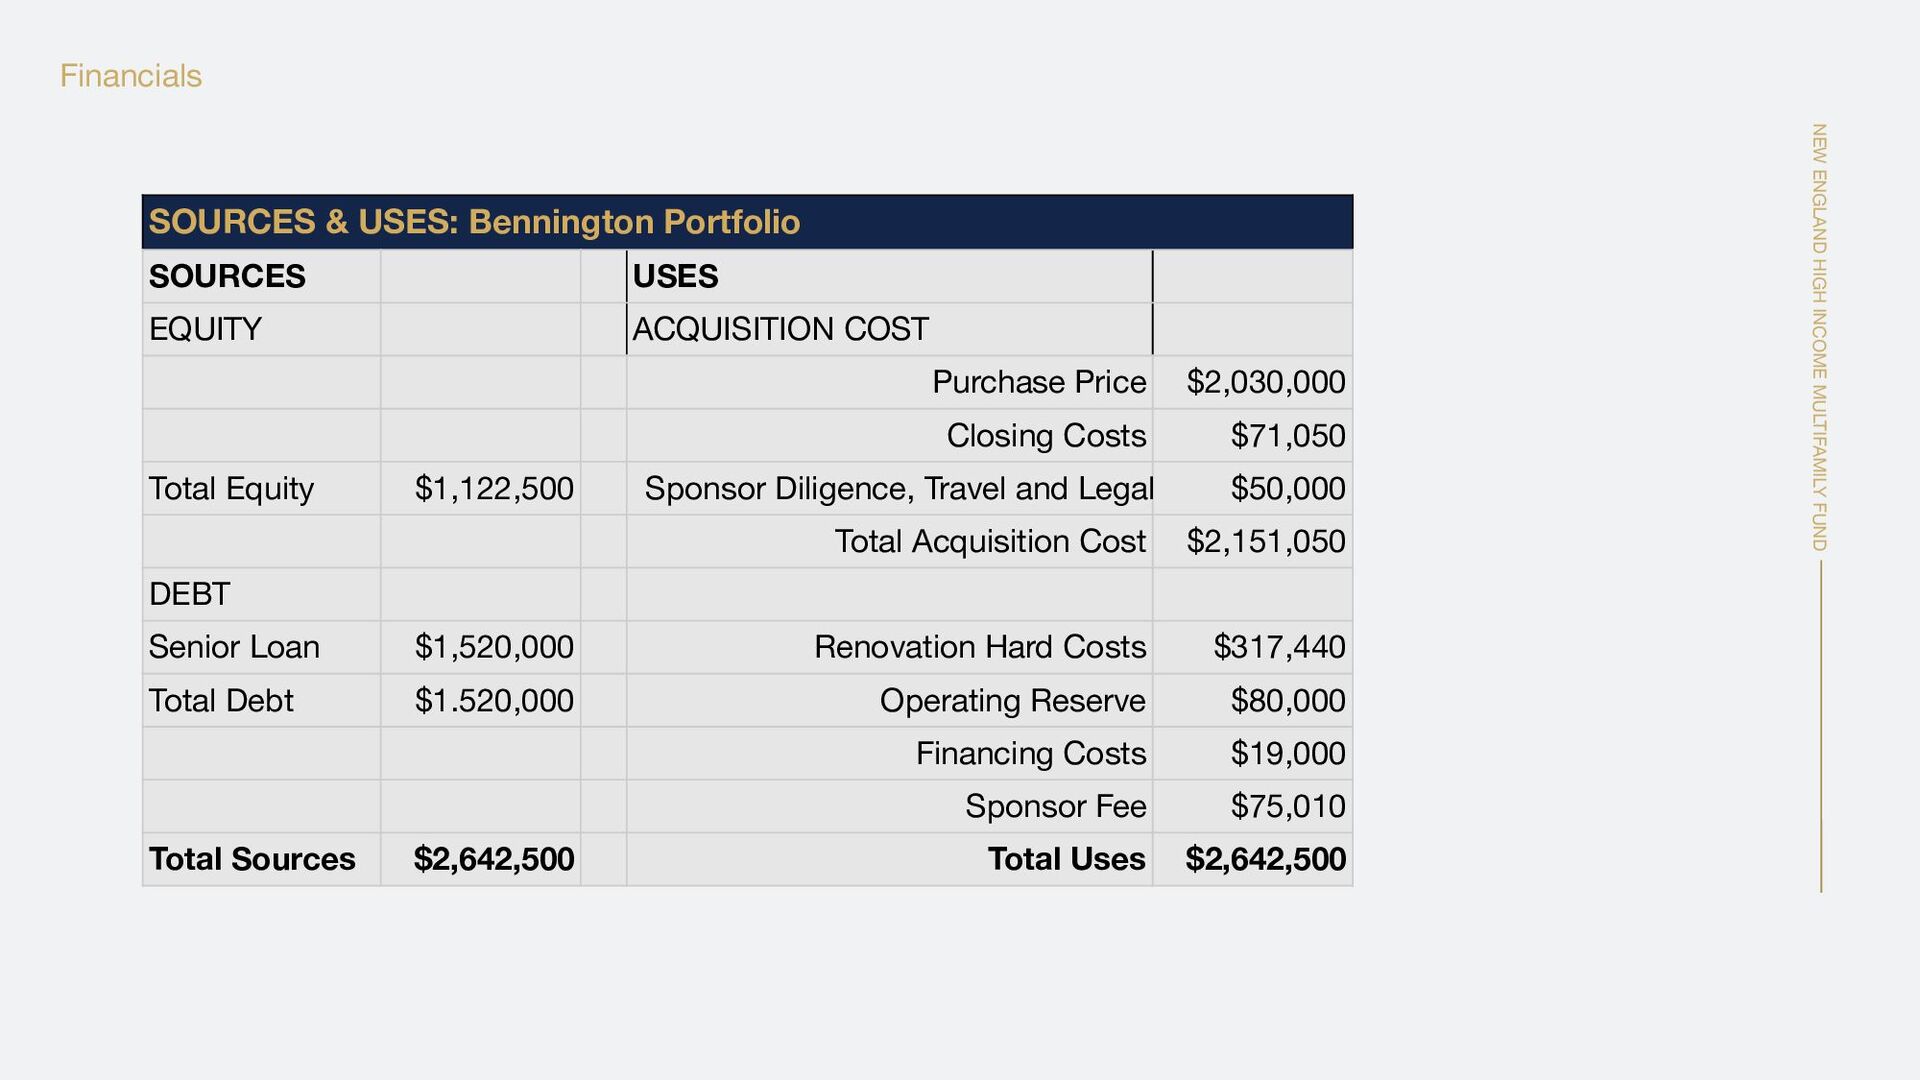
  20. NEW ENGLAND HIGH INCOME MULTIFAMILY FUND Financials SOURCES & USES:

    Bennington Portfolio SOURCES USES EQUITY ACQUISITION COST Purchase Price $2,030,000 Closing Costs $71,050 Total Equity $1,122,500 Sponsor Diligence, Travel and Legal $50,000 Total Acquisition Cost $2,151,050 DEBT Senior Loan $1,520,000 Renovation Hard Costs $317,440 Total Debt $1.520,000 Operating Reserve $80,000 Financing Costs $19,000 Sponsor Fee $75,010 Total Sources $2,642,500 Total Uses $2,642,500
  21. NEW ENGLAND HIGH INCOME MULTIFAMILY FUND FINANCIALS 27 ASSUMPTIONS 50-52

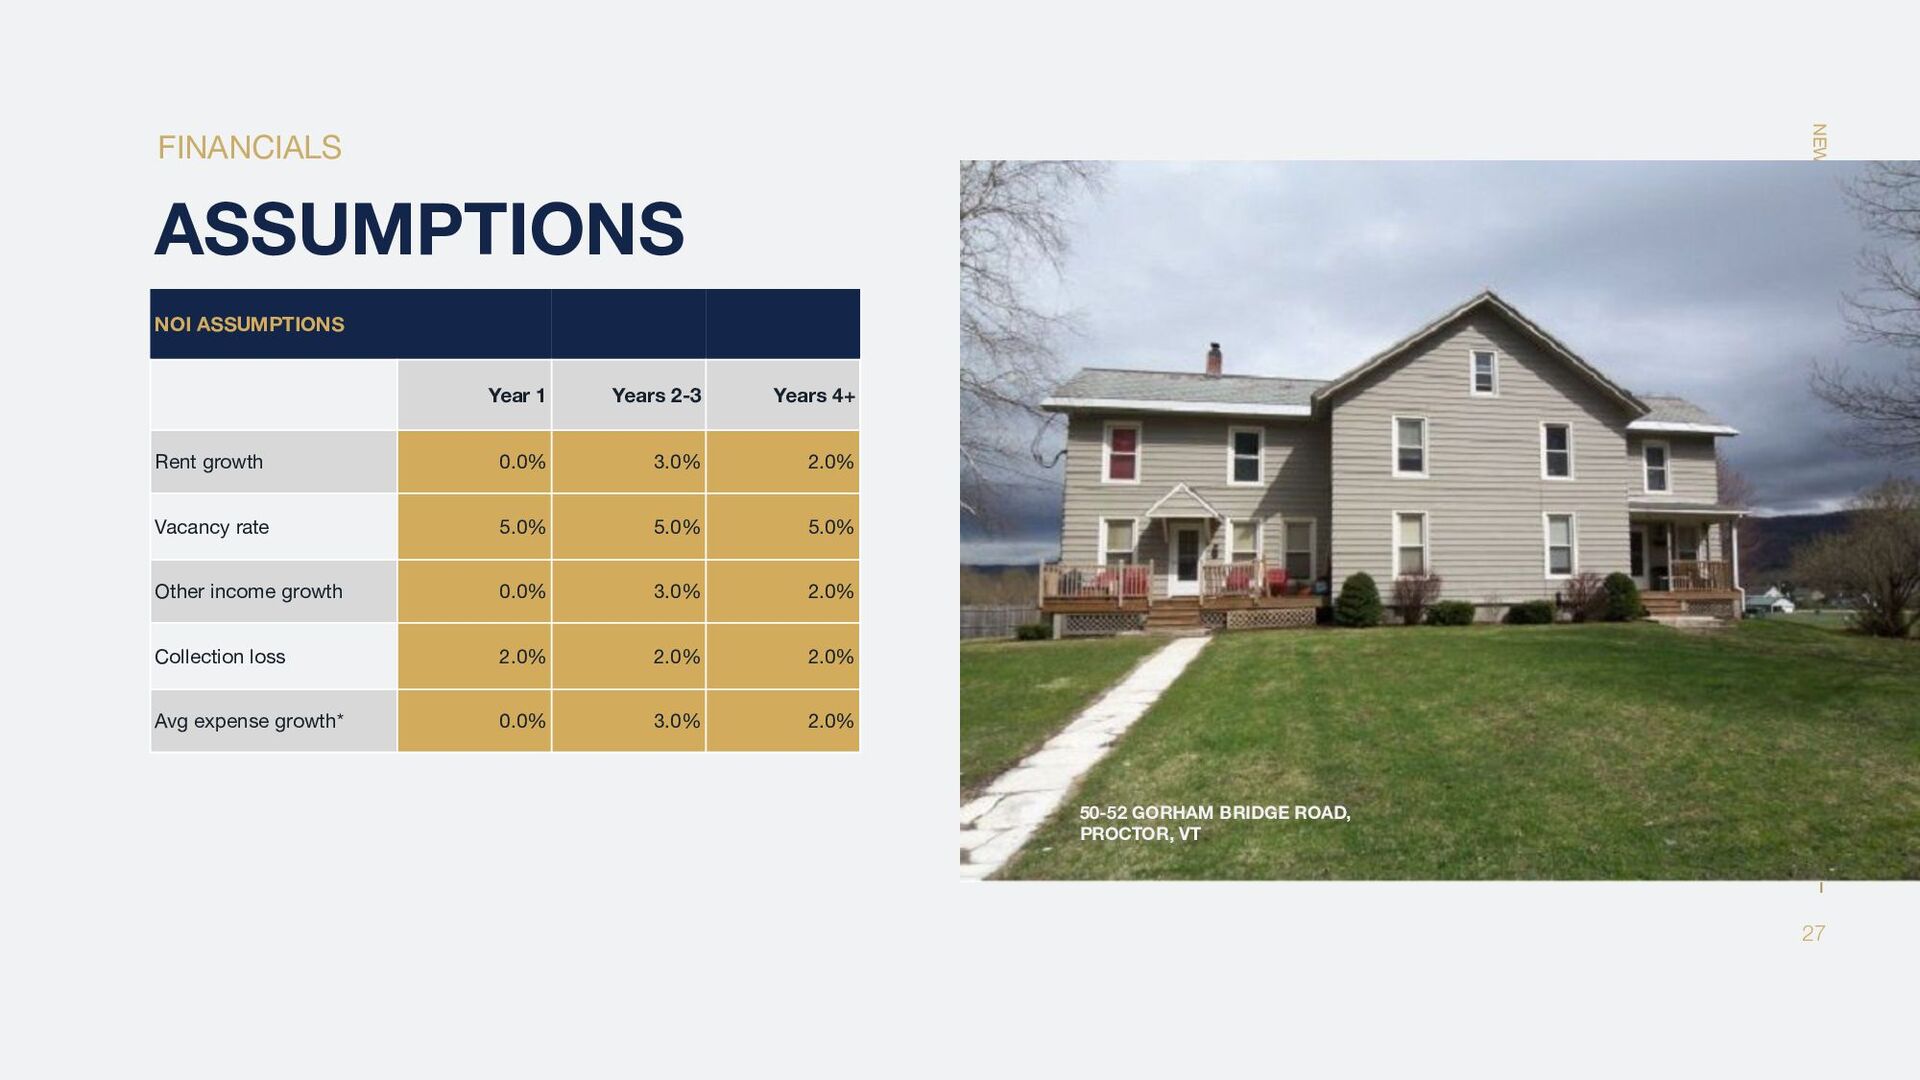
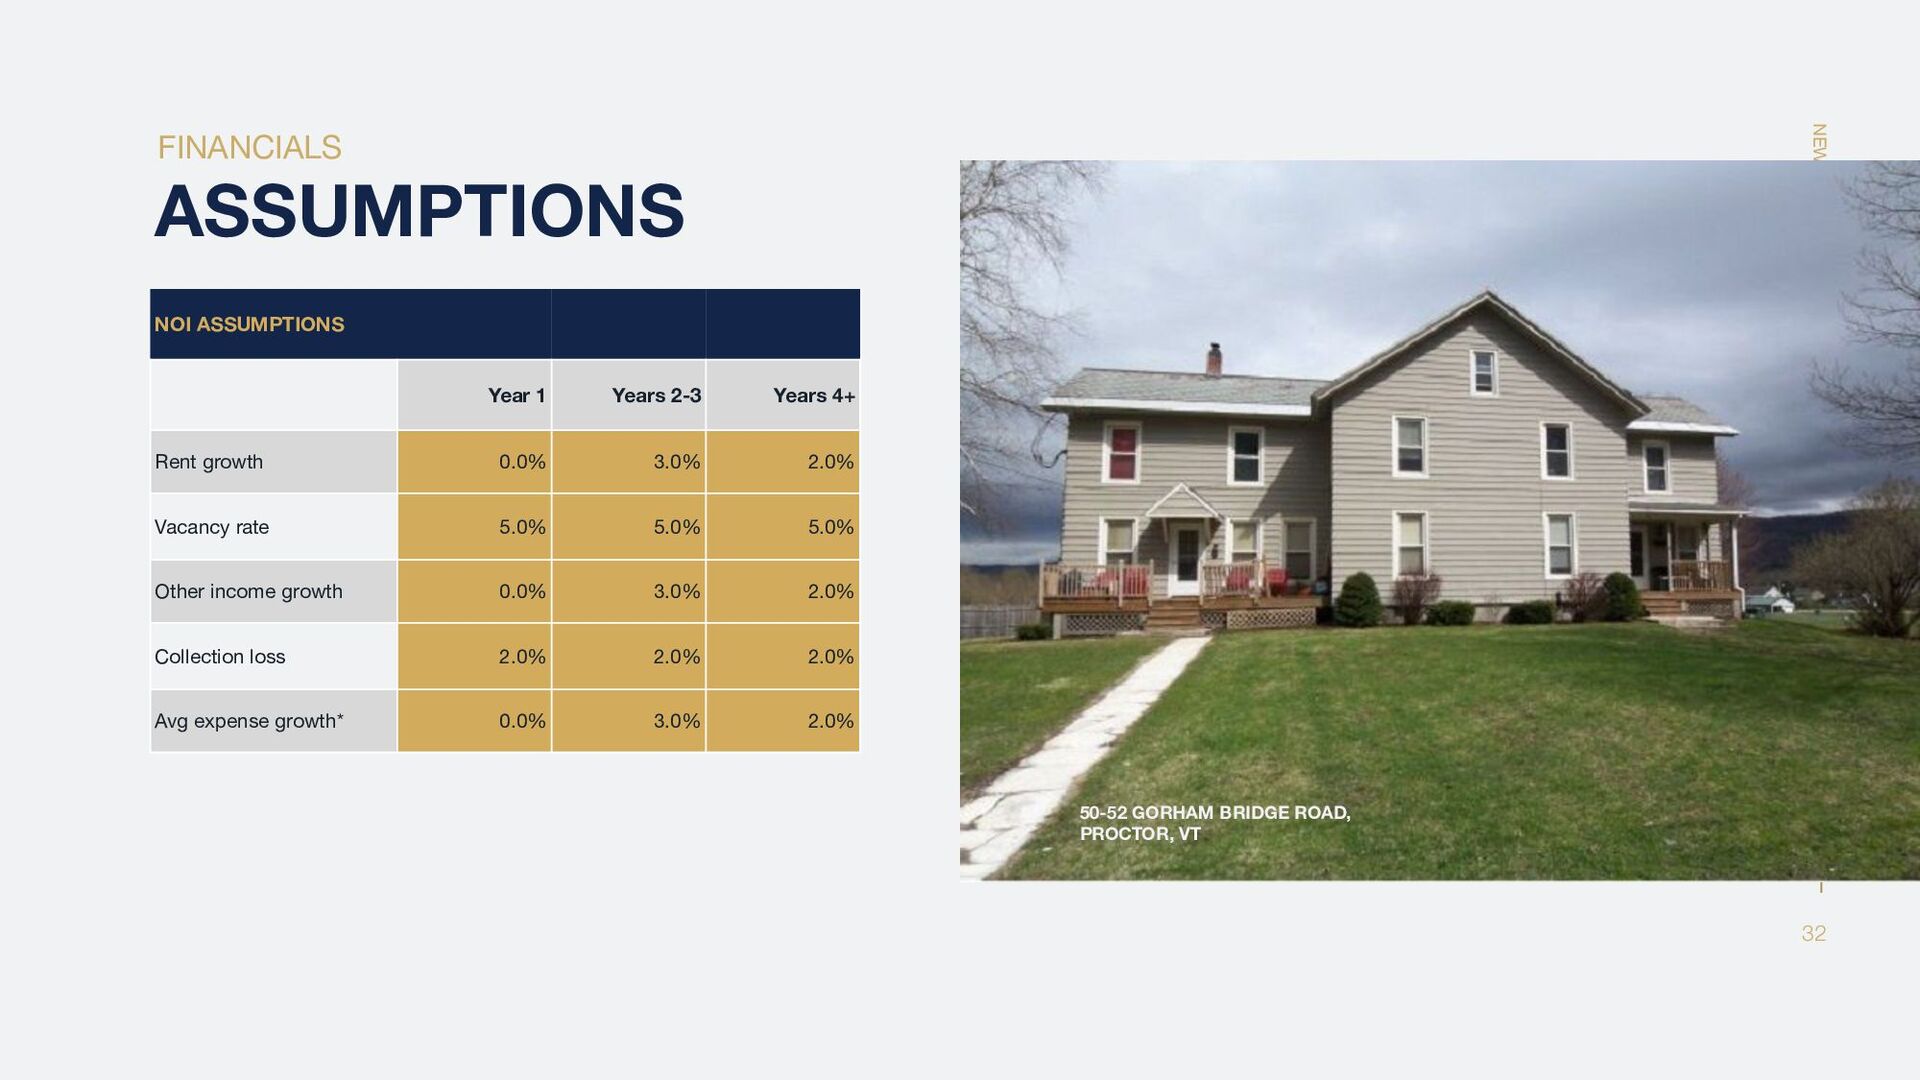
    GORHAM BRIDGE ROAD, PROCTOR, VT NOI ASSUMPTIONS Year 1 Years 2-3 Years 4+ Rent growth 0.0% 3.0% 2.0% Vacancy rate 5.0% 5.0% 5.0% Other income growth 0.0% 3.0% 2.0% Collection loss 2.0% 2.0% 2.0% Avg expense growth* 0.0% 3.0% 2.0%
  22. NEW ENGLAND HIGH INCOME MULTIFAMILY FUND FINANCIALS 28 SPONSOR &

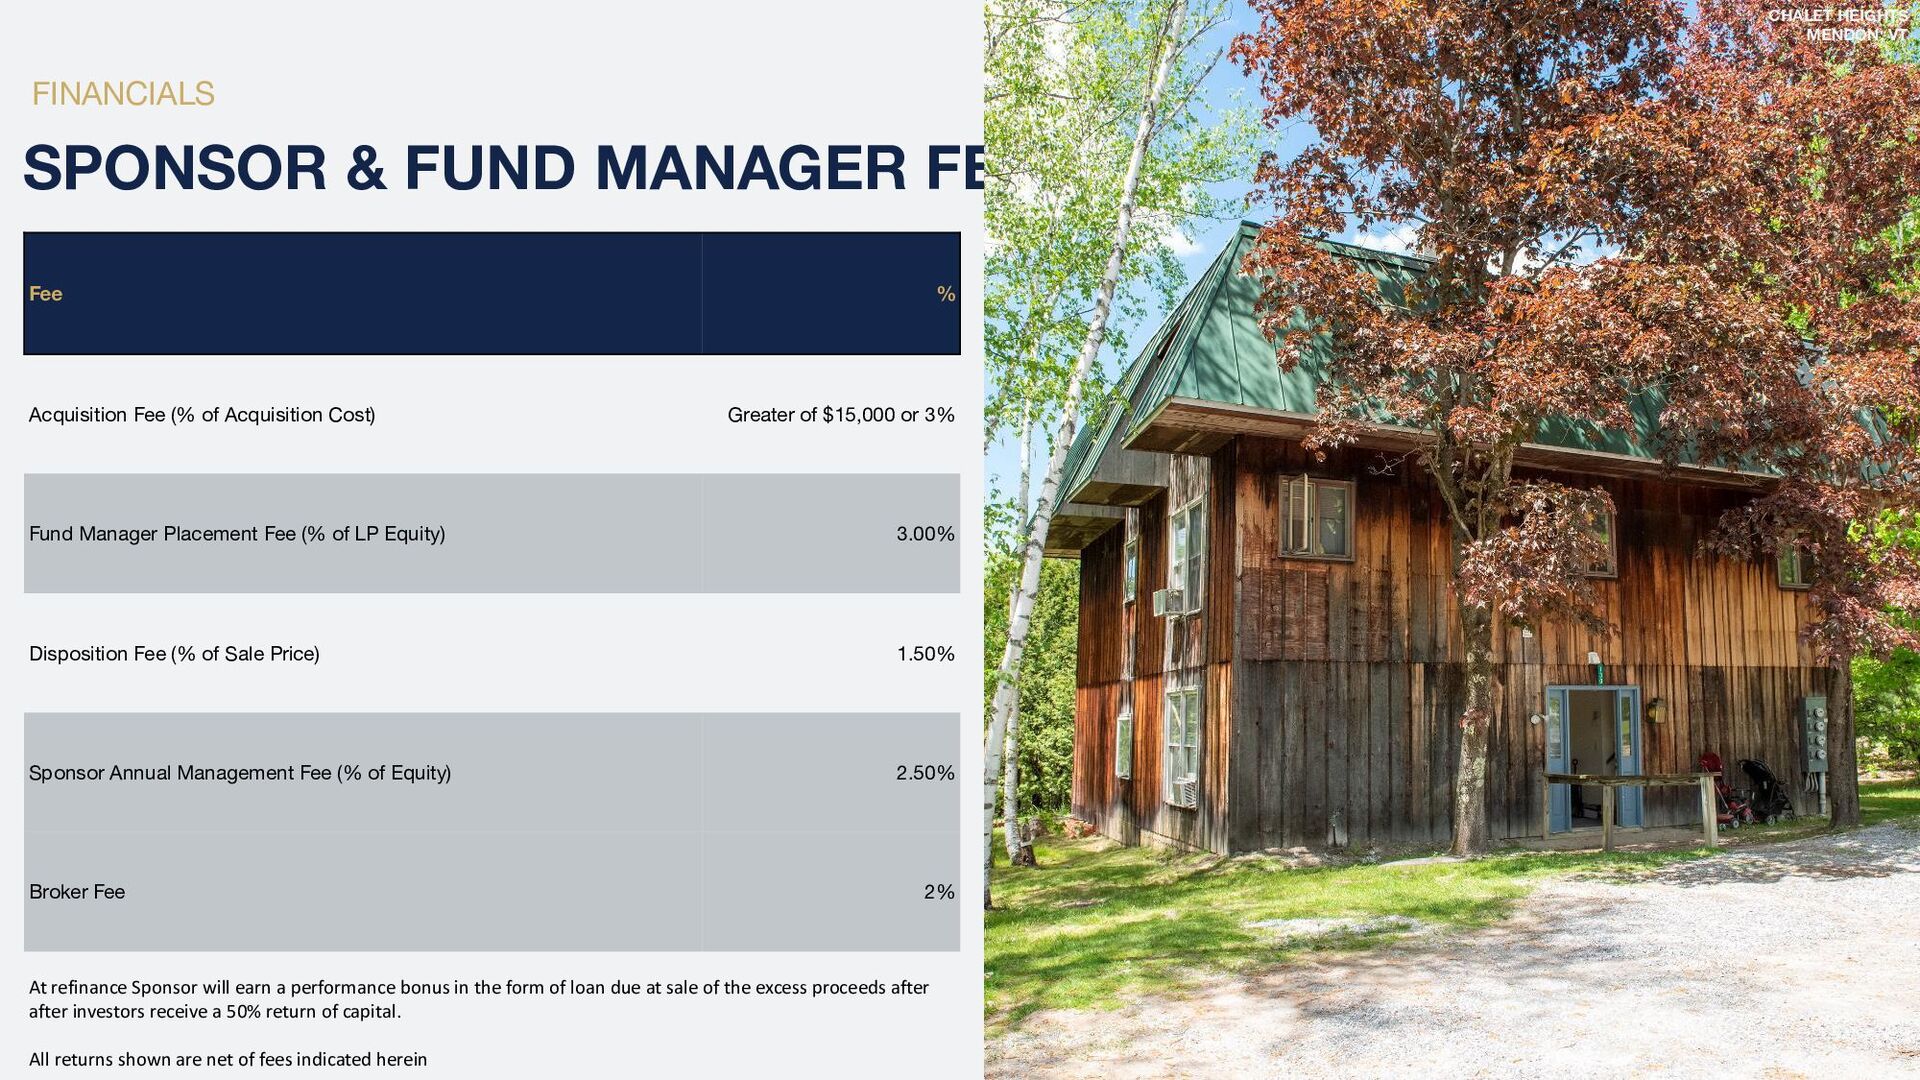
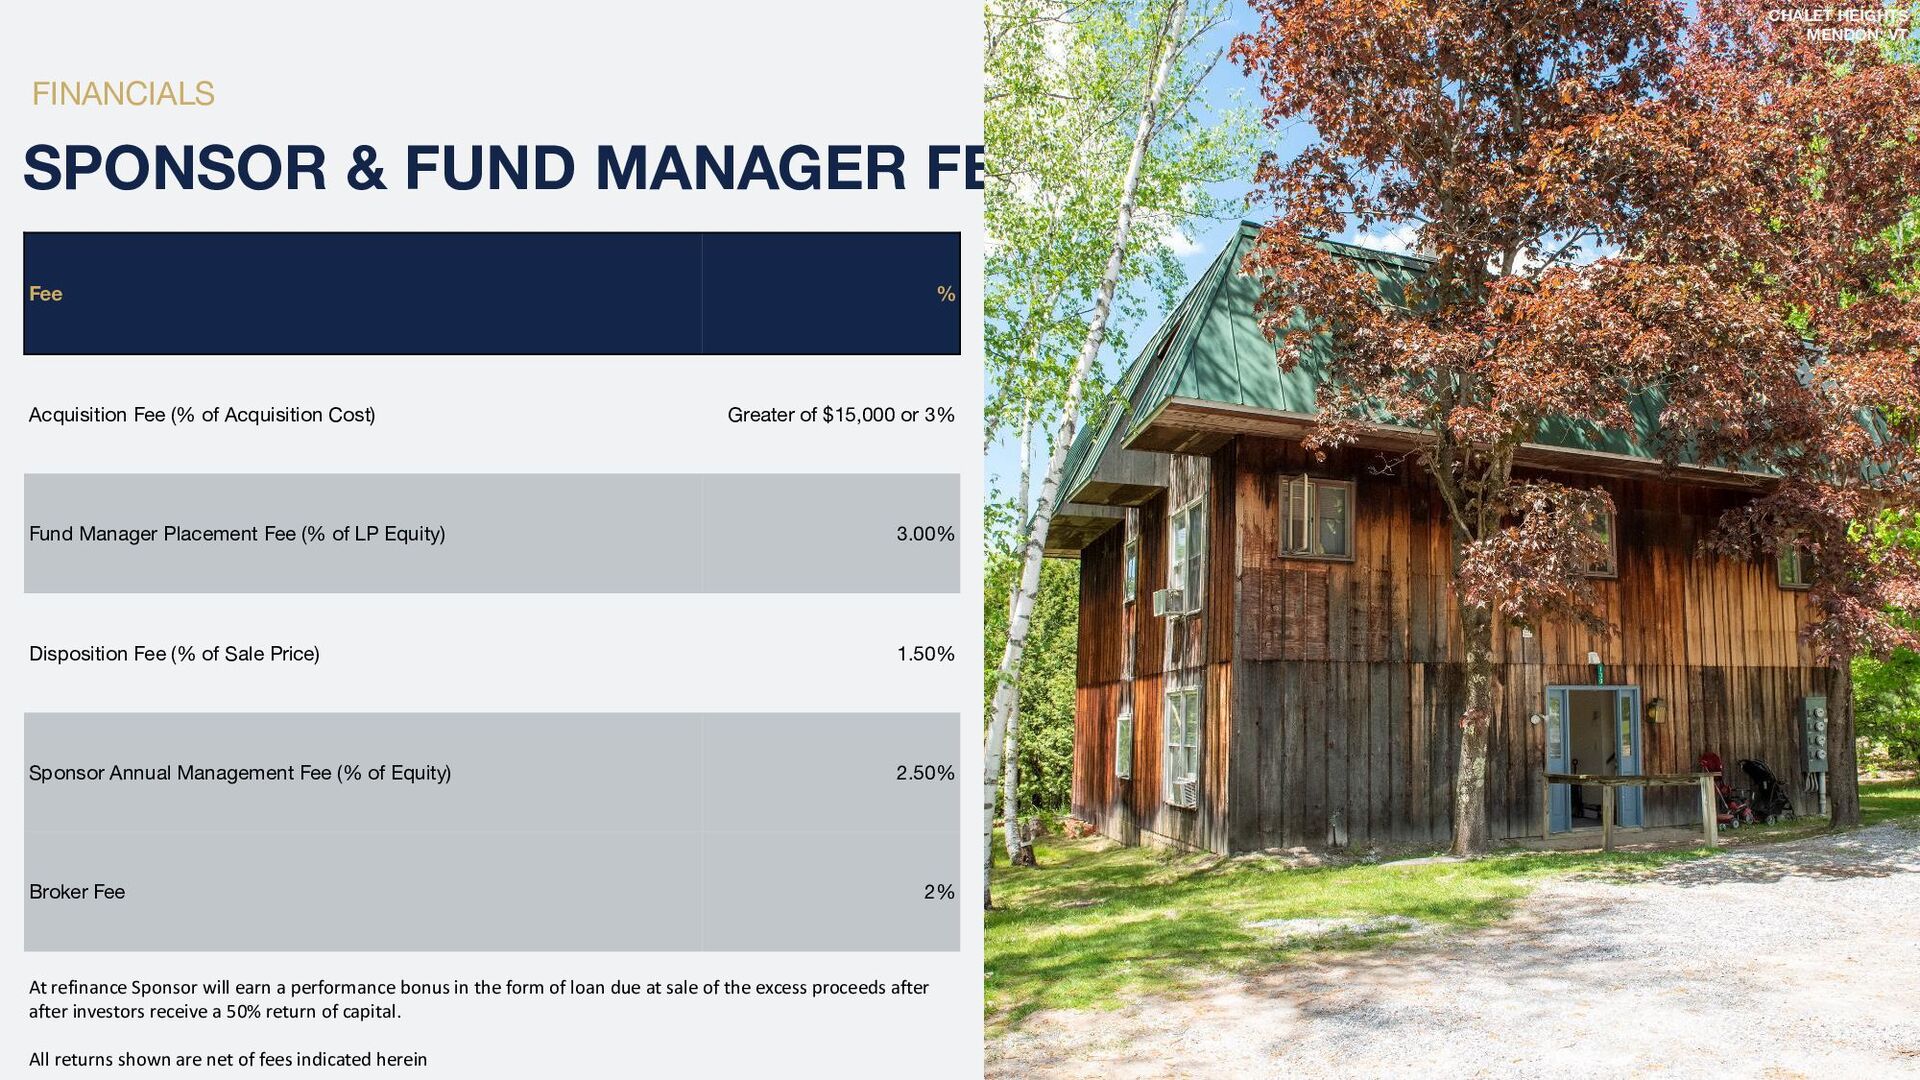
    FUND MANAGER FEES CHALET HEIGHTS MENDON, VT *All return projections presented are net of fees Fee % Acquisition Fee (% of Acquisition Cost) Greater of $15,000 or 3% Fund Manager Placement Fee (% of LP Equity) 3.00% Disposition Fee (% of Sale Price) 1.50% Sponsor Annual Management Fee (% of Equity) 2.50% Broker Fee 2% At refinance Sponsor will earn a performance bonus in the form of loan due at sale of the excess proceeds after after investors receive a 50% return of capital. All returns shown are net of fees indicated herein
  23. NEW ENGLAND HIGH INCOME MULTIFAMILY FUND Tranche 2 Transactions in

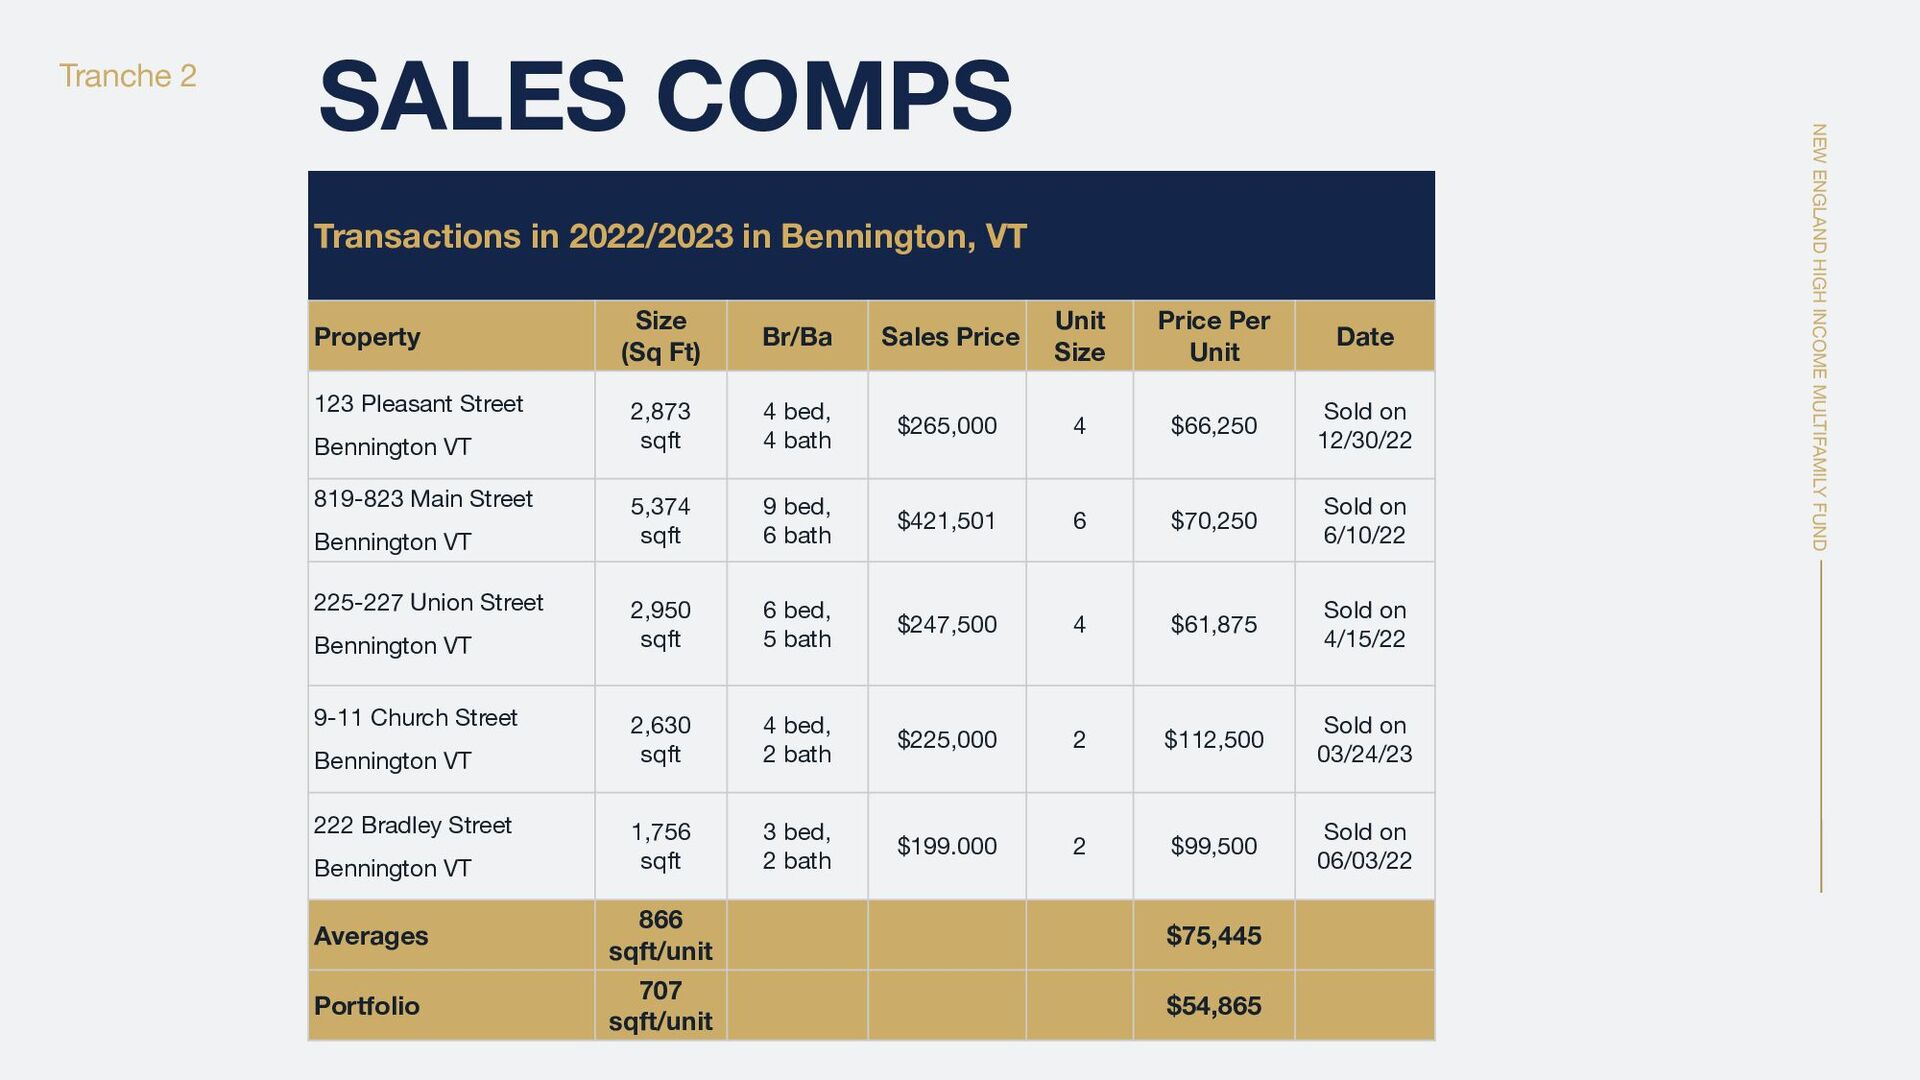
    2022/2023 in Bennington, VT Property Size (Sq Ft) Br/Ba Sales Price Unit Size Price Per Unit Date 123 Pleasant Street Bennington VT 2,873 sqft 4 bed, 4 bath $265,000 4 $66,250 Sold on 12/30/22 819-823 Main Street Bennington VT 5,374 sqft 9 bed, 6 bath $421,501 6 $70,250 Sold on 6/10/22 225-227 Union Street Bennington VT 2,950 sqft 6 bed, 5 bath $247,500 4 $61,875 Sold on 4/15/22 9-11 Church Street Bennington VT 2,630 sqft 4 bed, 2 bath $225,000 2 $112,500 Sold on 03/24/23 222 Bradley Street Bennington VT 1,756 sqft 3 bed, 2 bath $199.000 2 $99,500 Sold on 06/03/22 Averages 866 sqft/unit $75,445 Portfolio 707 sqft/unit $54,865 SALES COMPS
  24. NEW ENGLAND HIGH INCOME MULTIFAMILY FUND Tranche 2 Bennington VT

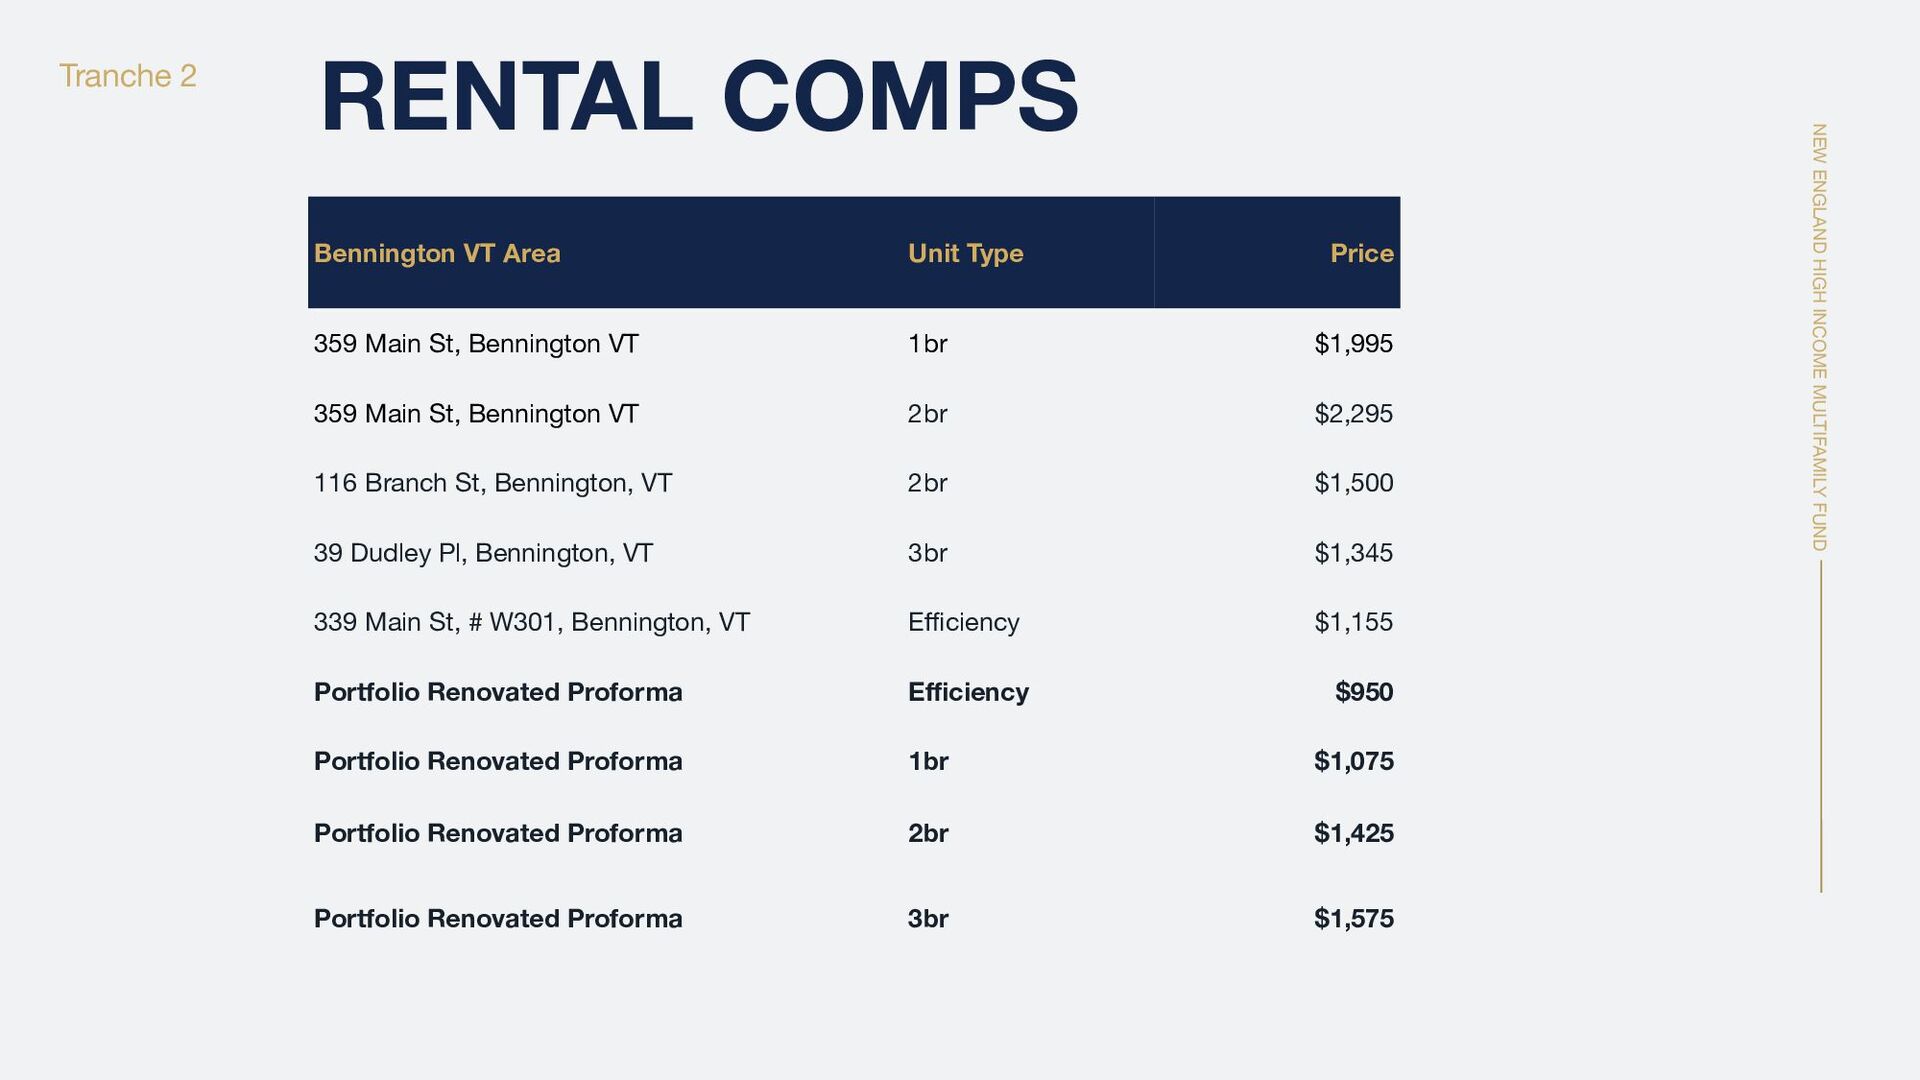
    Area Unit Type Price 359 Main St, Bennington VT 1br $1,995 359 Main St, Bennington VT 2br $2,295 116 Branch St, Bennington, VT 2br $1,500 39 Dudley Pl, Bennington, VT 3br $1,345 339 Main St, # W301, Bennington, VT Efficiency $1,155 Portfolio Renovated Proforma Efficiency $950 Portfolio Renovated Proforma 1br $1,075 Portfolio Renovated Proforma 2br $1,425 Portfolio Renovated Proforma 3br $1,575 RENTAL COMPS
  25. NEW ENGLAND HIGH INCOME MULTIFAMILY FUND FINANCIALS 32 ASSUMPTIONS 50-52

    GORHAM BRIDGE ROAD, PROCTOR, VT NOI ASSUMPTIONS Year 1 Years 2-3 Years 4+ Rent growth 0.0% 3.0% 2.0% Vacancy rate 5.0% 5.0% 5.0% Other income growth 0.0% 3.0% 2.0% Collection loss 2.0% 2.0% 2.0% Avg expense growth* 0.0% 3.0% 2.0%
  26. NEW ENGLAND HIGH INCOME MULTIFAMILY FUND FINANCIALS 33 DEBT AND

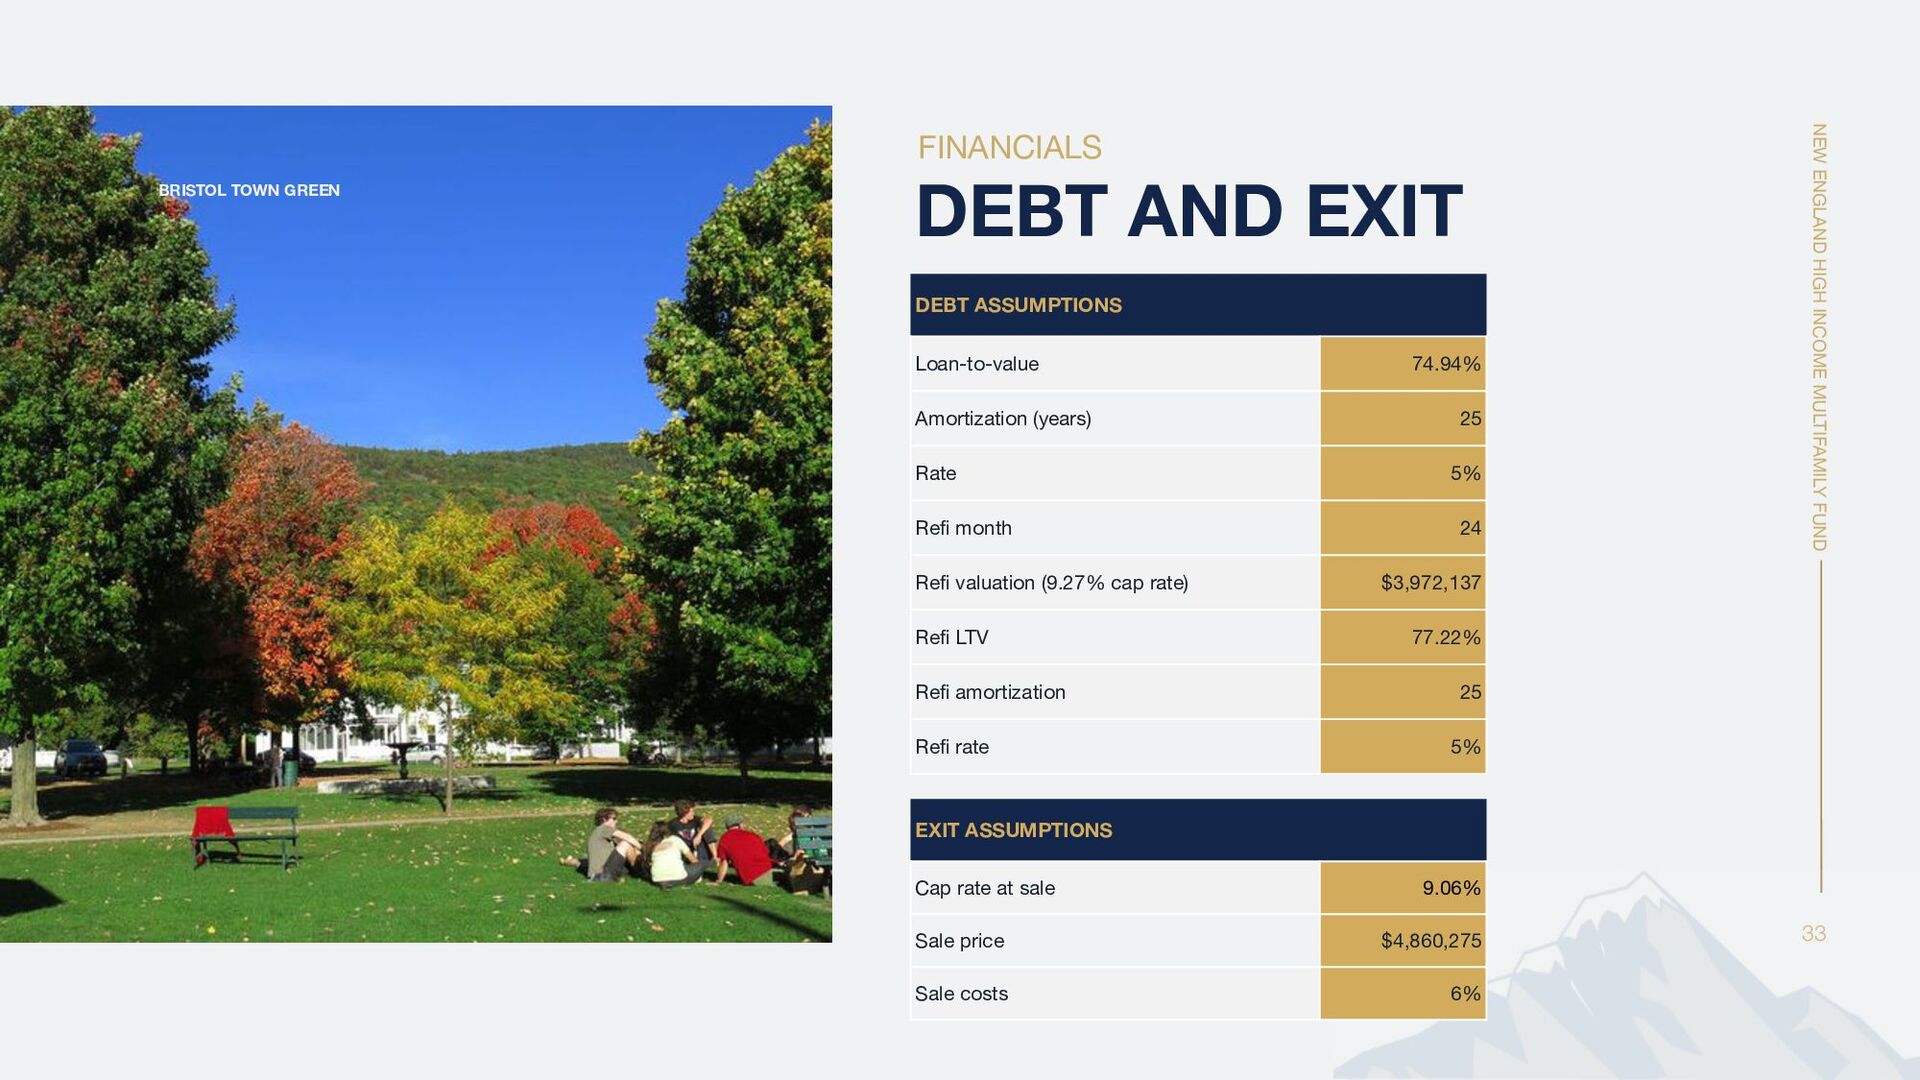
    EXIT BRISTOL TOWN GREEN DEBT ASSUMPTIONS Loan-to-value 74.94% Amortization (years) 25 Rate 5% Refi month 24 Refi valuation (9.27% cap rate) $3,972,137 Refi LTV 77.22% Refi amortization 25 Refi rate 5% EXIT ASSUMPTIONS Cap rate at sale 9.06% Sale price $4,860,275 Sale costs 6%
  27. NEW ENGLAND HIGH INCOME MULTIFAMILY FUND FINANCIALS 34 SPONSOR &

    FUND MANAGER FEES CHALET HEIGHTS MENDON, VT *All return projections presented are net of fees Fee % Acquisition Fee (% of Acquisition Cost) Greater of $15,000 or 3% Fund Manager Placement Fee (% of LP Equity) 3.00% Disposition Fee (% of Sale Price) 1.50% Sponsor Annual Management Fee (% of Equity) 2.50% Broker Fee 2% At refinance Sponsor will earn a performance bonus in the form of loan due at sale of the excess proceeds after after investors receive a 50% return of capital. All returns shown are net of fees indicated herein
  28. NEW ENGLAND HIGH INCOME MULTIFAMILY FUND 36 MICHAEL GILMAN is

    the Founder and Managing Principal of Cross Mountain Capital. Michael has over 10 years experience in acquiring and repositioning multifamily assets and generating exceptional returns on capital. After successfully building his real estate portfolio (over 100 units), Michael established Cross Mountain Capital in order to scale up with larger acquisitions by accepting investors and acting as the real estate sponsor for select multifamily opportunities. Michael oversees all aspects of operations from sourcing, deal structure, asset management and all the way down to hands on property management through Cross Mountain’s affiliated property management entity - MSA Properties, LLC Prior to devoting himself full time to Cross Mountain Capital, Michael was Head of Legal and Portfolio Management at Easyknock, where he managed over $250 million in residential properties and advised on legal matters related to the company and multi-state real estate business and legal issues. Michael started his legal career at investment banks such as Cantor Fitzgerald, Deutsche Bank and Bank of America. He held the Series 7, 24 and 57 licenses while in the securities industry and is also a licensed real estate broker. Michael holds a B.A. from Sarah Lawrence College and a J.D. from Brooklyn Law School. Eugene Yampolsky is the Head of Asset Management and Underwriting. Eugene maintains all of Cross Mountain’s underwriting and asset management models, and is responsible for asset management analytics and underwriting new deals Prior to joining Cross Mountain Capital, Eugene has worked as a proprietary trader at several New York trading firms for over twenty years. He has managed multimillion-dollar equity portfolios, trading discretionarily as well as algorithmically with data-driven models he developed and establishing an extraordinary trading track record. Eugene has also consulted on several real estate projects for a family office. Eugene is a CFA® Charterholder. He holds a B.S. in finance from NYU Stern School of Business and took advanced coursework at NYU Schack Institute of Real Estate. Eugene is also a graduate of Stuyvesant High School in NYC, one of the nation's most selective and competitive high schools. OUR TEAM INVESTMENTS TEAM
  29. NEW ENGLAND HIGH INCOME MULTIFAMILY FUND OUR TEAM 37 PROPERTY

    MANAGER - MSA Properties MSA Properties, LLC is a full service property management company exclusively managing Cross Mountain Capital’s and Michael’s own portfolios throughout Vermont. First founded in 2012 to self manage Michael’s direct acquisitions, MSA Properties, and its Western states affiliate 3GEN Real Estate, has grown to manage over 1,000 units in in the United State. MSA Properties specialises in cost savings and efficiencies through in-house construction and maintenance. One of the keys to our success in New England is handling management and repositions in-house through our affiliate MSA Properties. This allows us to stay on budget and scale, and deliver consistent results across properties. Significantly, MSA Properties uses a pass through labor cost structure so that maintenance and capital improvement projects are efficiently handled, without an incentive to create unnecessary work
  30. NEW ENGLAND HIGH INCOME MULTIFAMILY FUND Cross Mountain Capital 1732

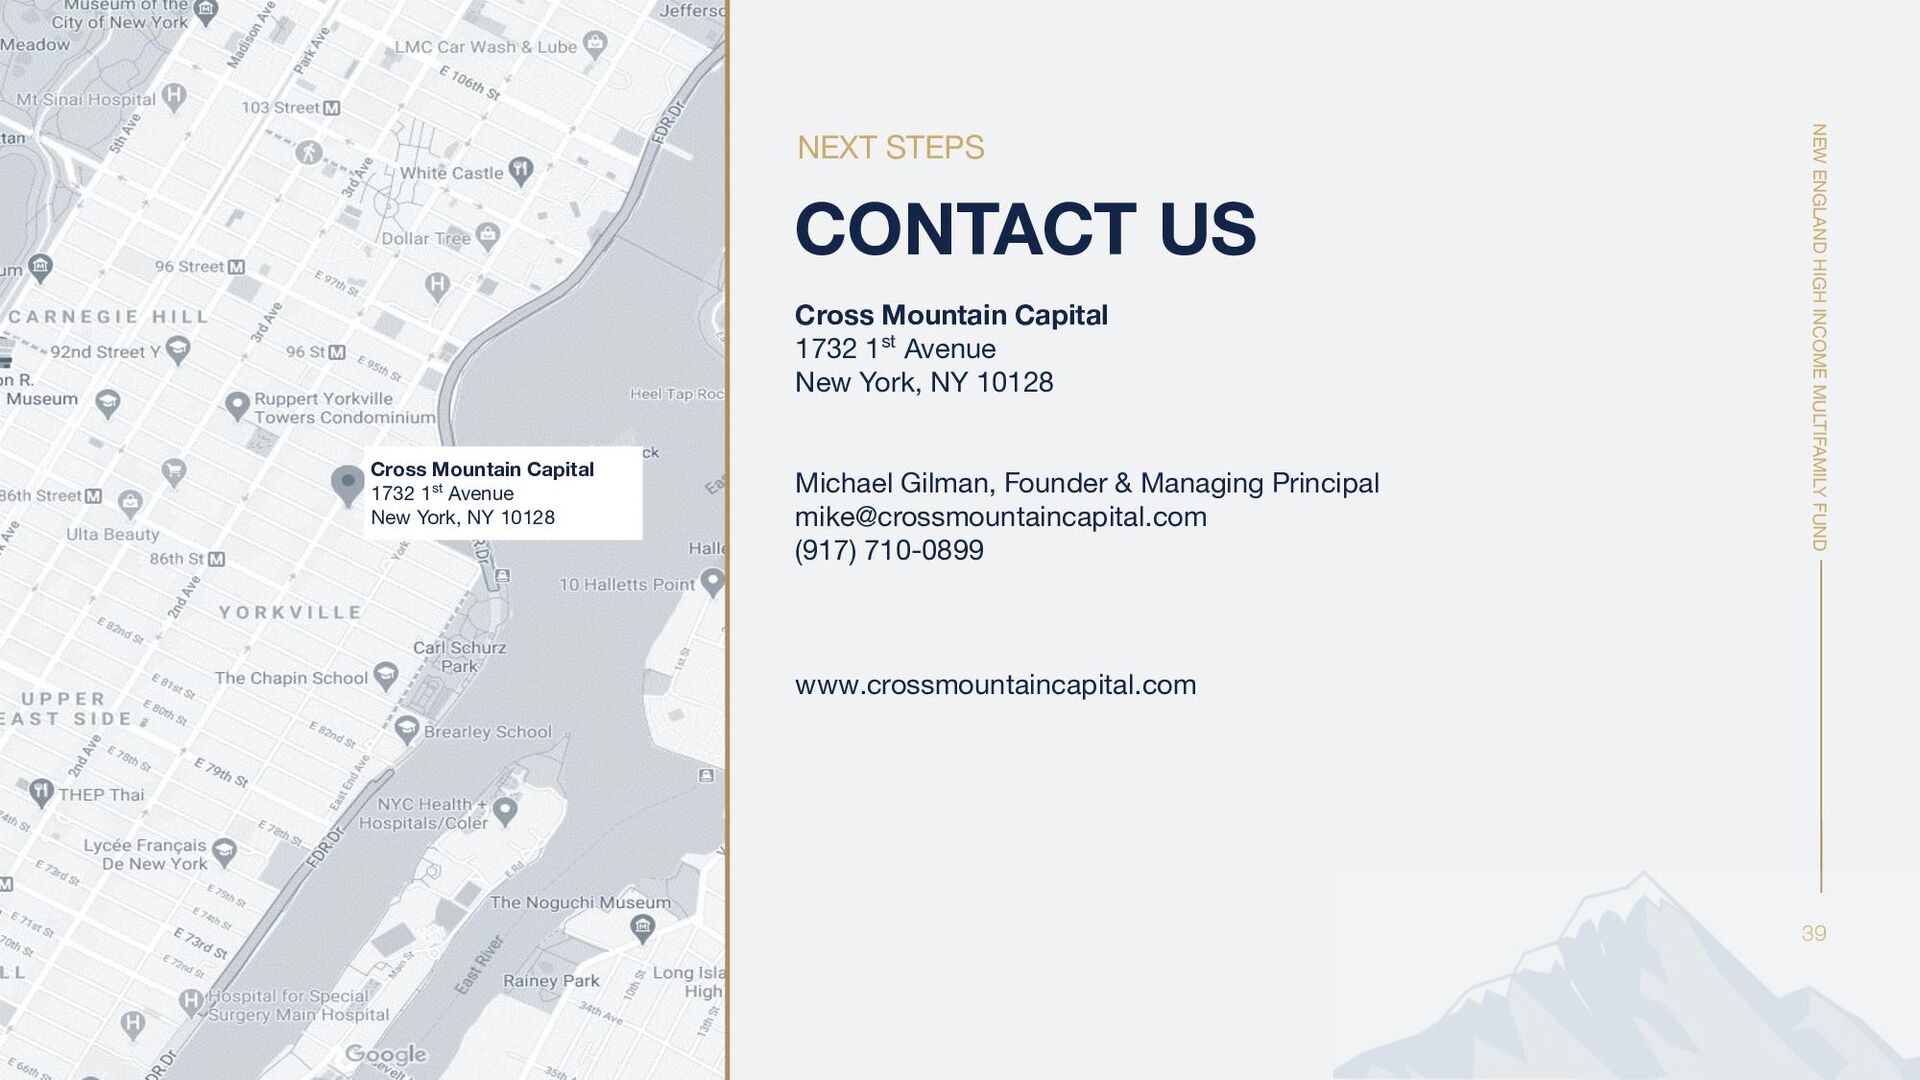
    1st Avenue New York, NY 10128 Michael Gilman, Founder & Managing Principal [email protected] (917) 710-0899 www.crossmountaincapital.com 39 NEXT STEPS CONTACT US Cross Mountain Capital 1732 1st Avenue New York, NY 10128
  31. NEW ENGLAND HIGH INCOME MULTIFAMILY FUND DISCLAIMER This Executive Summary

    is neither an offer to sell, a solicitation, nor an offer to buy any security, which can be made only by reviewing the final Operating Agreement and Private Placement Memorandum. All potential investors must meet applicable suitability standards. This overview document should be read in conjunction with the Operating Agreement and Private Placement Memorandum in order to understand all of the implications and risks of this investment. Potential investors are advised to consult with their tax, legal, and financial advisors. Some of the statements contained herein are forward-looking statements. You should not rely upon forward-looking statements as predictions of future events. These statements involve known and unknown risks, uncertainties, and other factors that may cause the project’s actual results, levels of activity, performance, or achievements to be materially and adversely different from any future results, levels of activity, performance, or achievements expressed or implied by these forward-looking statements. In some cases, forward-looking statements can be identified by terminology such as “may”, “will”, “should”, “expects”, “plans”, “anticipates”, “believes”, “targeted”, “projected”, “underwritten”, “estimates”, “predicts”, “potential”, or “continue”—or the converse of these terms or other comparable terminology. These forward-looking statements include, but are not limited to, statements concerning the Fund, property, risk factors, plans, and projections. Although the issuer believes the expectations reflected in the forward-looking statements are reasonable, guarantees of future results, levels of activity, performance, or achievements cannot be made. Moreover, neither the issuer nor any other person or entity assumes responsibility for the accuracy and completeness of forward-looking statements. No person or entity is under any duty to update any of the forward-looking statements to conform them to actual results. Except as required by law, neither we nor any other person assumes responsibility for the accuracy and completeness of the forward-looking statements. We undertake no obligation to publicly update any forward- looking statements for any reason, or to conform these statements to actual results or to changes in our expectations. 41
  32. NEW ENGLAND HIGH INCOME MULTIFAMILY FUND WHO WE ARE Cross

    Mountain Capital (CMC) is a real estate investment firm that works with qualified investors to acquire and operate multifamily properties. PRIMARY STRATEGIES YIELD-PLUS assets are primarily stable, cash-flowing assets with operational upside and moderate upside upon sale. For this strategy, we focus on tertiary markets with higher cap rates. VALUE-ADD assets typically require moderate to substantial capital improvements, but they are expected to generate higher upside upon sale, as well as further protect the investor’s equity position through value creation. For this strategy, we focus on marquee MSAs in the Mountain West. 43 OUR FIRM
  33. NEW ENGLAND HIGH INCOME MULTIFAMILY FUND WHO WE ARE Our

    mission at CMC is to help investors reach the peak of real estate investment by building long-term wealth through passive investments in carefully vetted and underwritten multifamily properties. CMC’s name evokes the metaphoric symbolism of crossing mountains to find and execute bespoke transactions that result in preservation of capital and accumulation of wealth. In addition, the name speaks to our penchant for markets that offer abundant outdoor and mountain activities, which anchor and promote the health and economy of these communities. -Michael Gilman, Founder 44 MISSION
  34. NEW ENGLAND HIGH INCOME MULTIFAMILY FUND WHO WE ARE Class

    B and C properties have experienced an increase in demand, as rising rental rates have pushed renters toward more affordable options. As the wage gap and income disparity across the country builds, aggregate demand for Class B and C properties will increase. In tougher economic climates, Class A- and B+ renters may be forced to downscale to Class B or C multifamily units. Newer and younger entrants to the renting pool also tend to look for Class B and C buildings in both robust and weak economic cycles. We use a data-driven approach to look for markets and assets that do not have an abundance of existing operators compressing cap rates and crowding trades. We also avoid speculative investments that rely solely on organic market growth. 45 PHILOSOPHY
  35. NEW ENGLAND HIGH INCOME MULTIFAMILY FUND COMPETITIVE ADVANTAGE WHO WE

    ARE Exceptionally Qualified Team • Significant experience in workforce housing, operations, and management. • Successful track record of self management and investing as a principal. • Vertically integrated in several markets as investor and property manager. If a new market is for us, we typically utilize a Co-General Partner structure where the other GP has significant experience with managing large scale value-add projects in the specific submarket. 46 Niche Strategy • Our yield-plus strategy targets markets that have high rental demand, but lack a high velocity of transactions. This creates a higher cap rate environment whereby CMC can generate tremendous cash flow for investors. • Our value-add strategy targets marquee MSAs where low cap rates provide the opportunity for CMC to significantly increase property value by increasing income. • While difficult to identify opportunities that fit our underwriting criteria, our data-driven approach, off-market sourcing capabilities, and deep industry relationships give CMC a competitive edge. Unique Value Creation • Lifestyle brand to create a sense of place. • Impact investment model symbiotically enhances social, environmental, and financial returns.
  36. NEW ENGLAND HIGH INCOME MULTIFAMILY FUND COMPETITIVE ADVANTAGE WHO WE

    ARE 47 Favorable Demographics • Target market demographics that are experiencing strong population and income growth but do not have an over-saturation of operators. • Target tenant base has fastest growing renter segment in the U.S. with a higher propensity to rent. Substantial wage growth with buying power expected to double by 2030. Asymmetric Information • Quantitative analytics and focus on big data. • Algorithms and platforms that drive alpha in acquisitions, risk management, and property management. • Proprietary access to submarket data through strategic partnerships and deep insight as a principal investor and manager.
  37. NEW ENGLAND HIGH INCOME MULTIFAMILY FUND 49 A Road Less

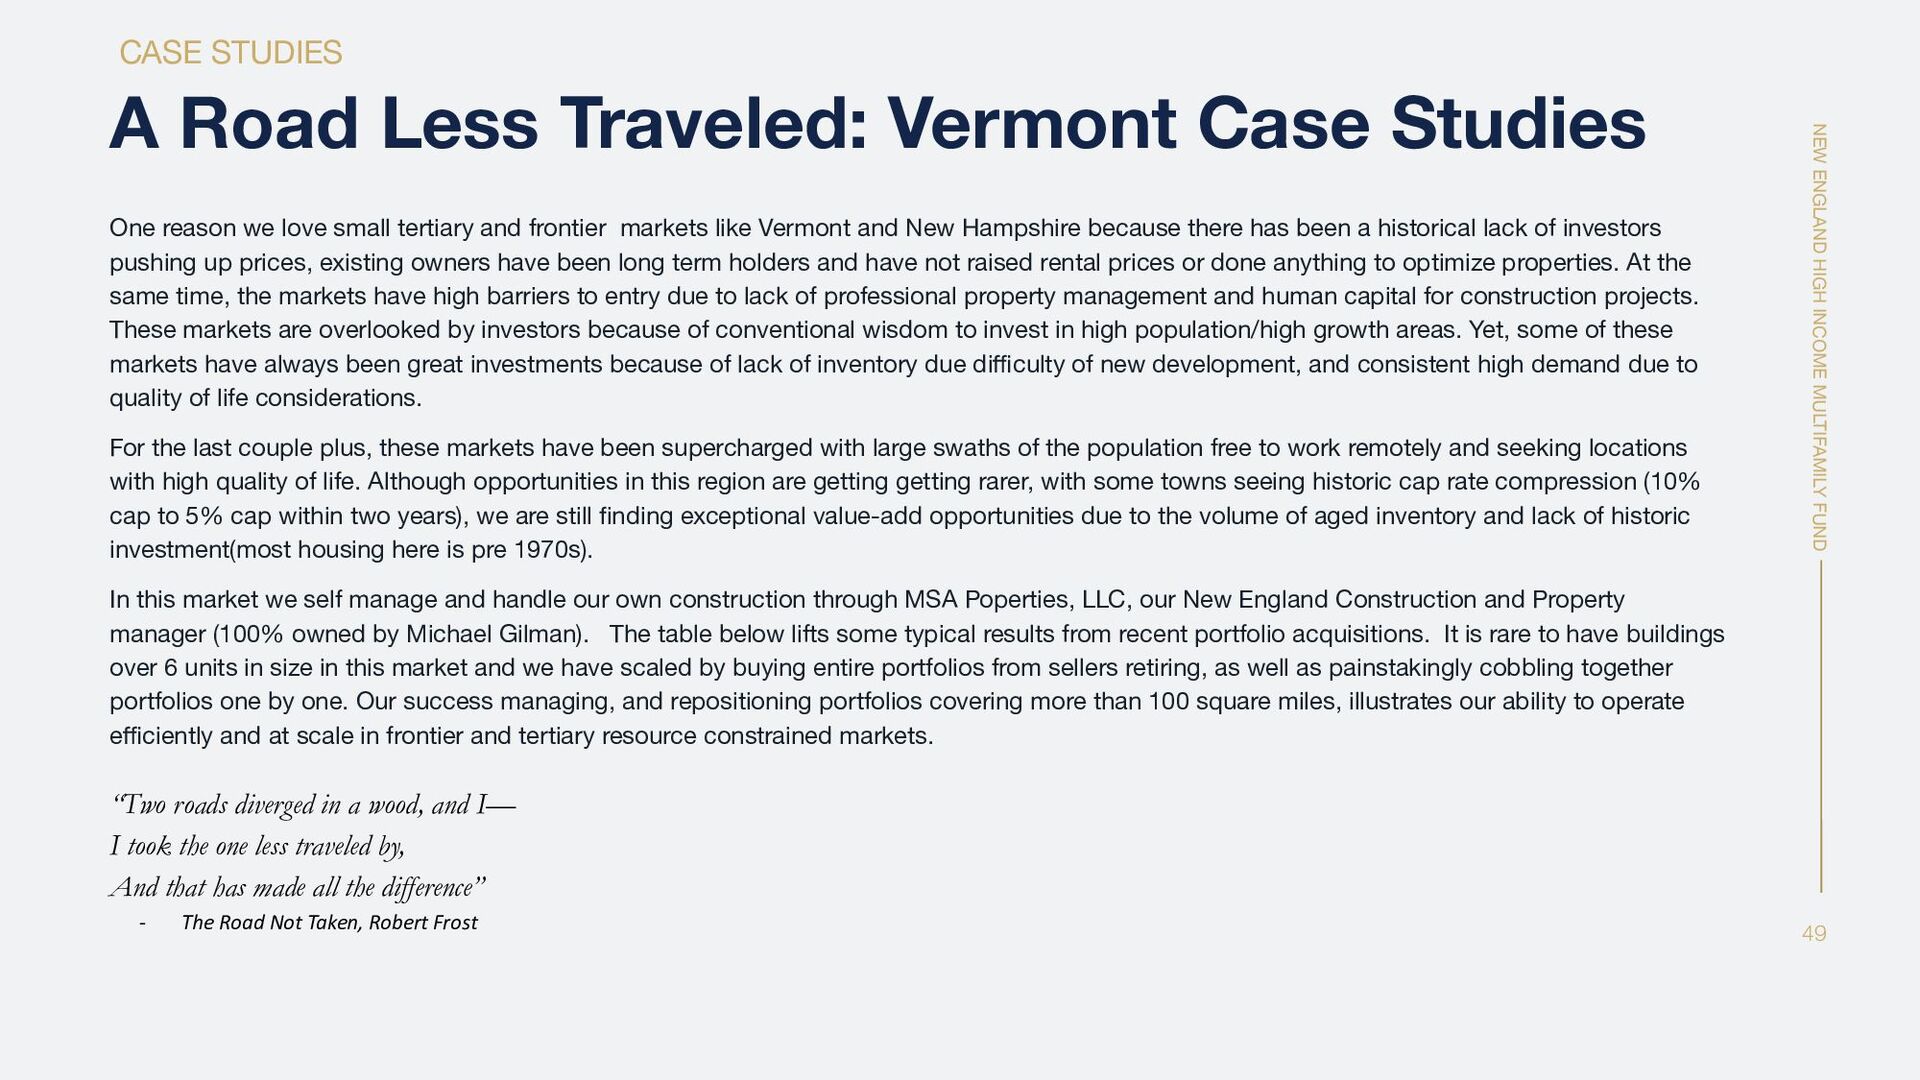
    Traveled: Vermont Case Studies One reason we love small tertiary and frontier markets like Vermont and New Hampshire because there has been a historical lack of investors pushing up prices, existing owners have been long term holders and have not raised rental prices or done anything to optimize properties. At the same time, the markets have high barriers to entry due to lack of professional property management and human capital for construction projects. These markets are overlooked by investors because of conventional wisdom to invest in high population/high growth areas. Yet, some of these markets have always been great investments because of lack of inventory due difficulty of new development, and consistent high demand due to quality of life considerations. For the last couple plus, these markets have been supercharged with large swaths of the population free to work remotely and seeking locations with high quality of life. Although opportunities in this region are getting getting rarer, with some towns seeing historic cap rate compression (10% cap to 5% cap within two years), we are still finding exceptional value-add opportunities due to the volume of aged inventory and lack of historic investment(most housing here is pre 1970s). In this market we self manage and handle our own construction through MSA Poperties, LLC, our New England Construction and Property manager (100% owned by Michael Gilman). The table below lifts some typical results from recent portfolio acquisitions. It is rare to have buildings over 6 units in size in this market and we have scaled by buying entire portfolios from sellers retiring, as well as painstakingly cobbling together portfolios one by one. Our success managing, and repositioning portfolios covering more than 100 square miles, illustrates our ability to operate efficiently and at scale in frontier and tertiary resource constrained markets. “Two roads diverged in a wood, and I— I took the one less traveled by, And that has made all the difference” - The Road Not Taken, Robert Frost CASE STUDIES
  38. NEW ENGLAND HIGH INCOME MULTIFAMILY FUND CASE STUDIES BRISTOL VT

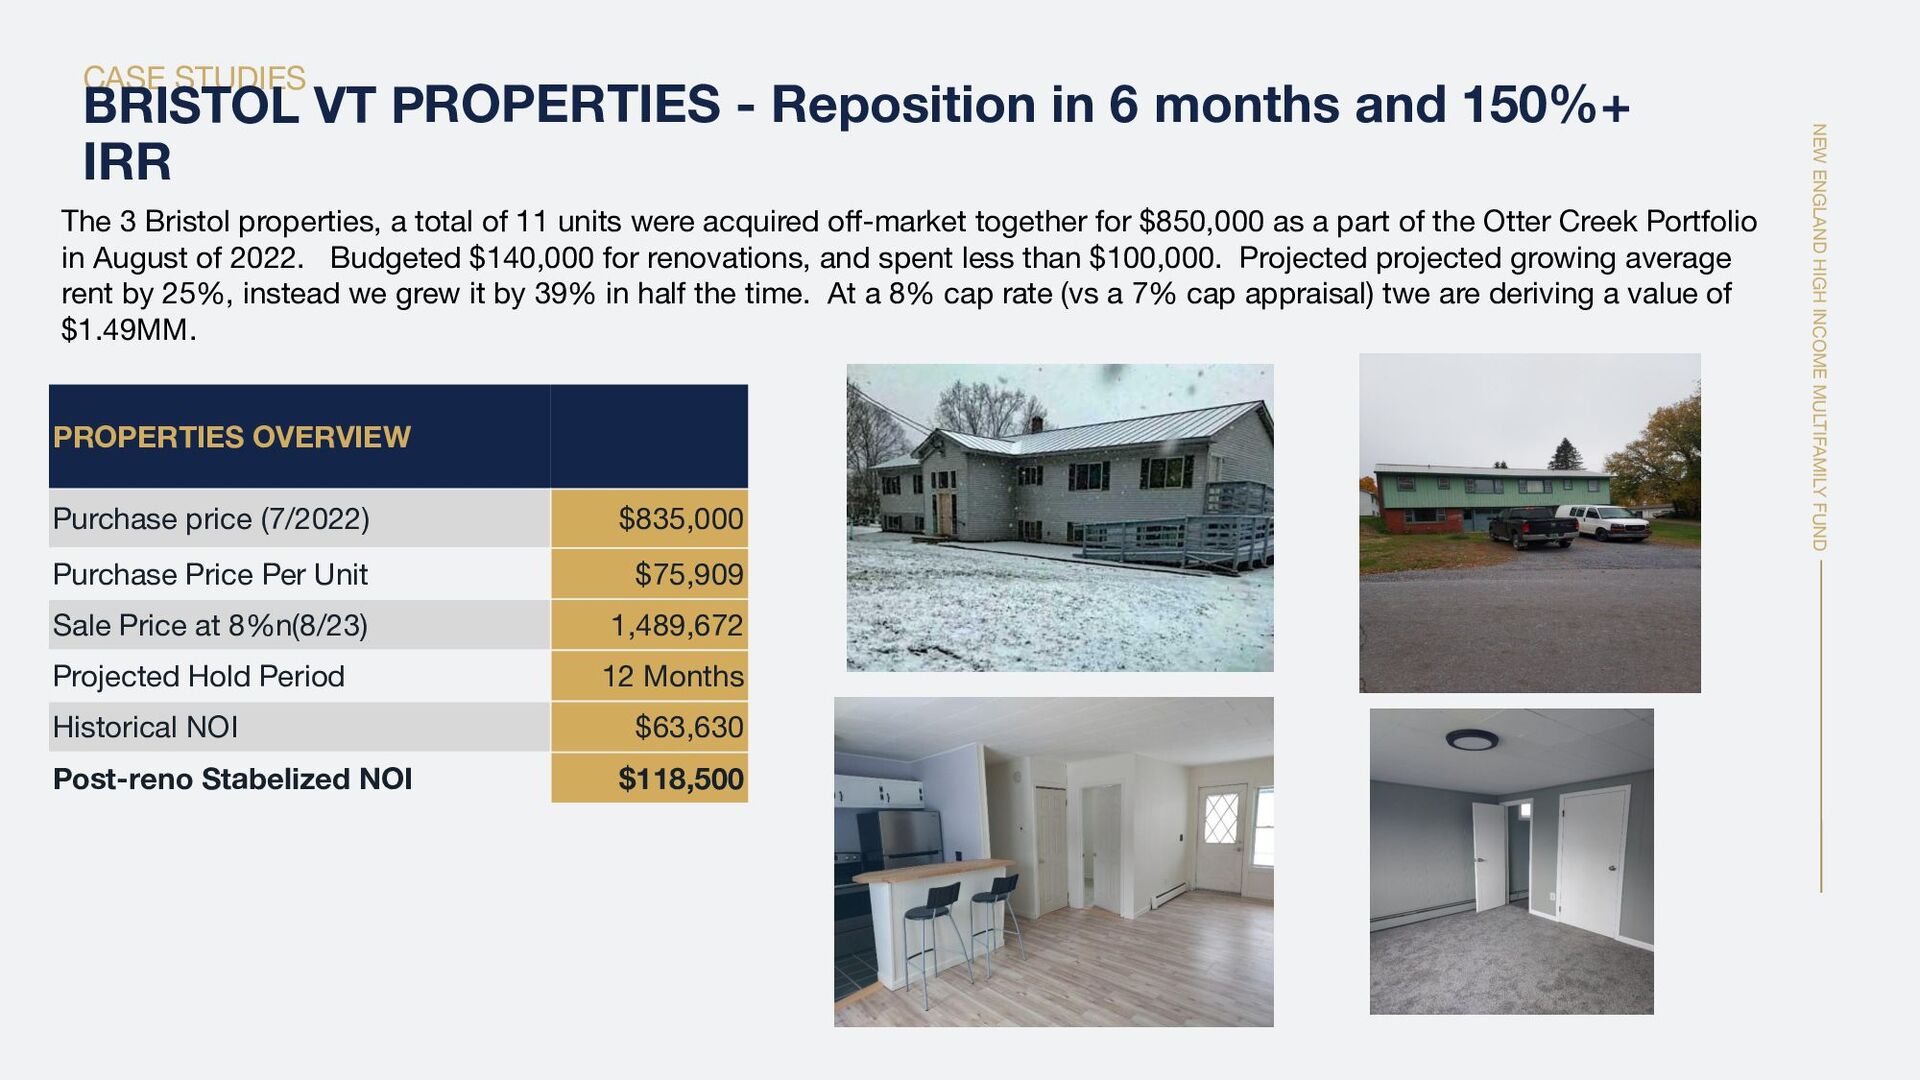
    PROPERTIES - Reposition in 6 months and 150%+ IRR PROPERTIES OVERVIEW Purchase price (7/2022) $835,000 Purchase Price Per Unit $75,909 Sale Price at 8%n(8/23) 1,489,672 Projected Hold Period 12 Months Historical NOI $63,630 Post-reno Stabelized NOI $118,500 The 3 Bristol properties, a total of 11 units were acquired off-market together for $850,000 as a part of the Otter Creek Portfolio in August of 2022. Budgeted $140,000 for renovations, and spent less than $100,000. Projected projected growing average rent by 25%, instead we grew it by 39% in half the time. At a 8% cap rate (vs a 7% cap appraisal) twe are deriving a value of $1.49MM.
  39. NEW ENGLAND HIGH INCOME MULTIFAMILY FUND 51 A Road Less

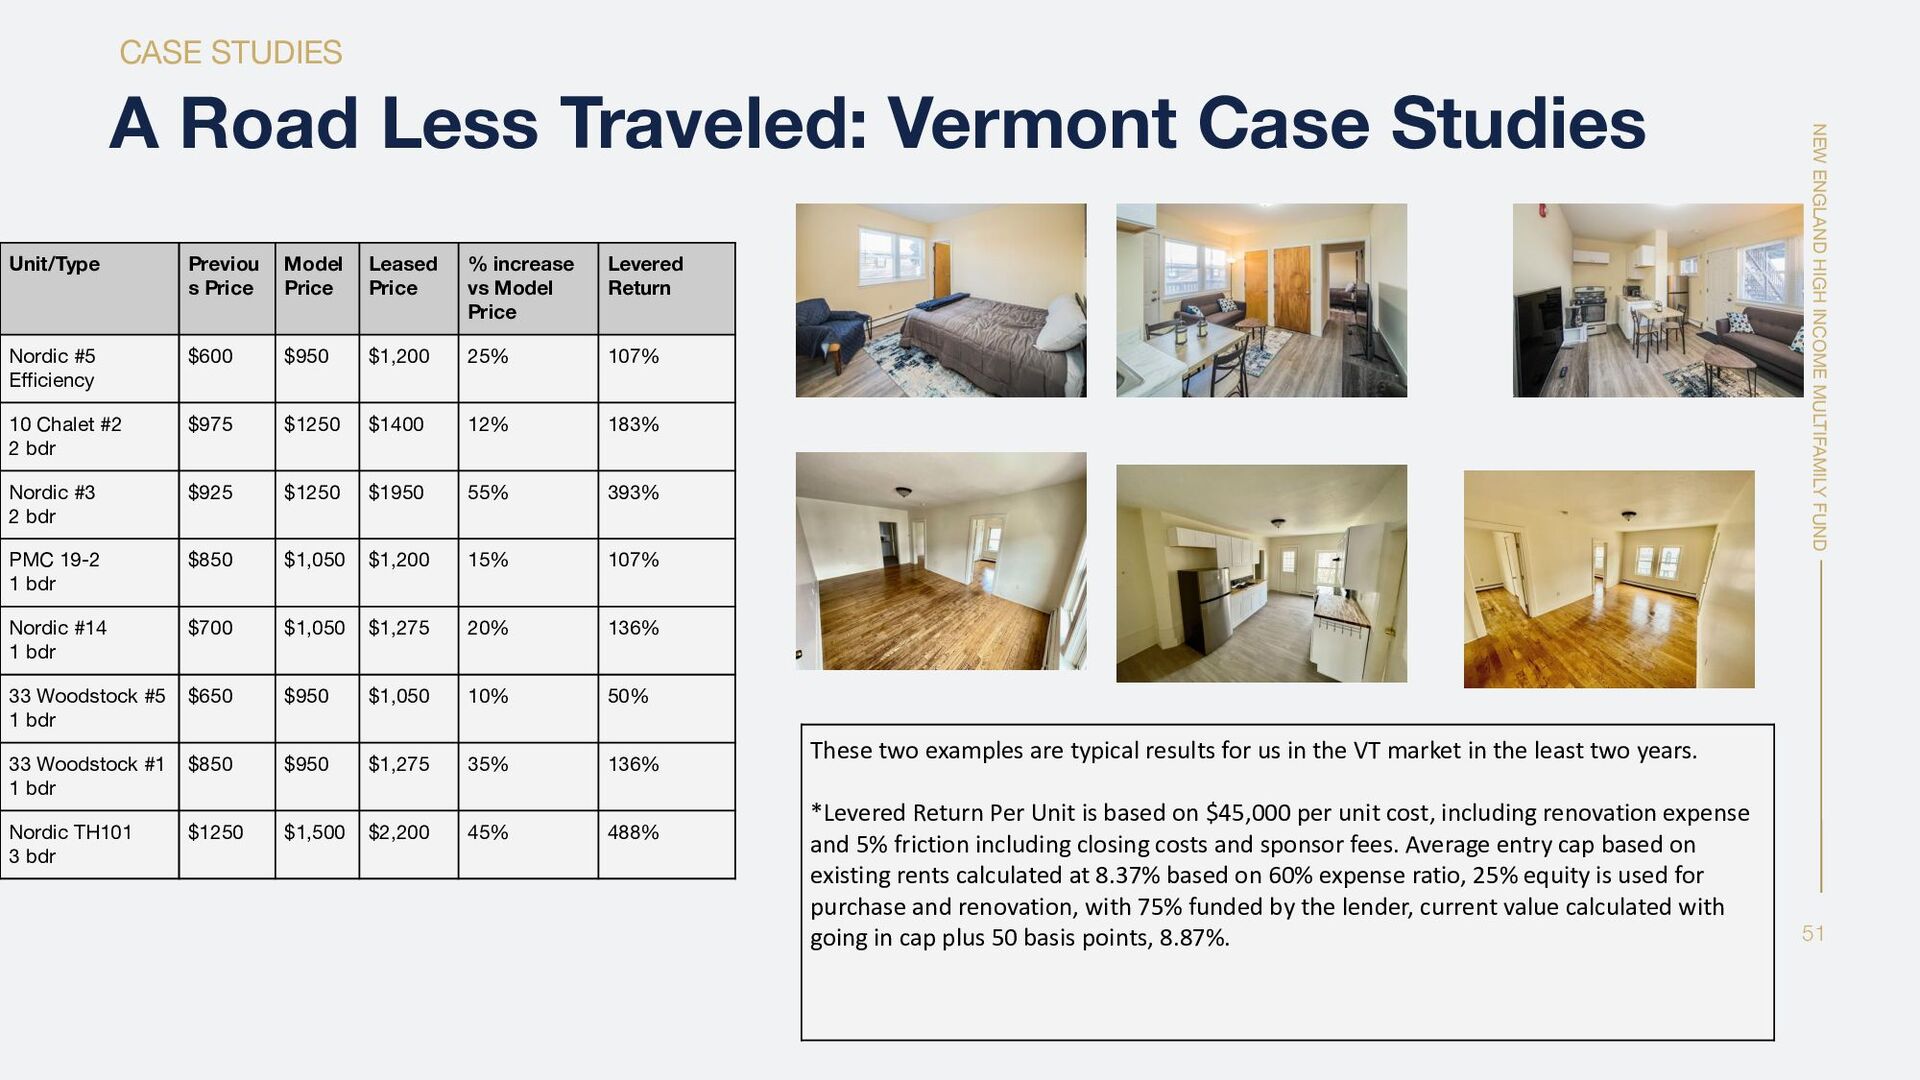
    Traveled: Vermont Case Studies CASE STUDIES These two examples are typical results for us in the VT market in the least two years. *Levered Return Per Unit is based on $45,000 per unit cost, including renovation expense and 5% friction including closing costs and sponsor fees. Average entry cap based on existing rents calculated at 8.37% based on 60% expense ratio, 25% equity is used for purchase and renovation, with 75% funded by the lender, current value calculated with going in cap plus 50 basis points, 8.87%. Unit/Type Previou s Price Model Price Leased Price % increase vs Model Price Levered Return Nordic #5 Efficiency $600 $950 $1,200 25% 107% 10 Chalet #2 2 bdr $975 $1250 $1400 12% 183% Nordic #3 2 bdr $925 $1250 $1950 55% 393% PMC 19-2 1 bdr $850 $1,050 $1,200 15% 107% Nordic #14 1 bdr $700 $1,050 $1,275 20% 136% 33 Woodstock #5 1 bdr $650 $950 $1,050 10% 50% 33 Woodstock #1 1 bdr $850 $950 $1,275 35% 136% Nordic TH101 3 bdr $1250 $1,500 $2,200 45% 488%
  40. NEW ENGLAND HIGH INCOME MULTIFAMILY FUND CASE STUDIES 52 Property

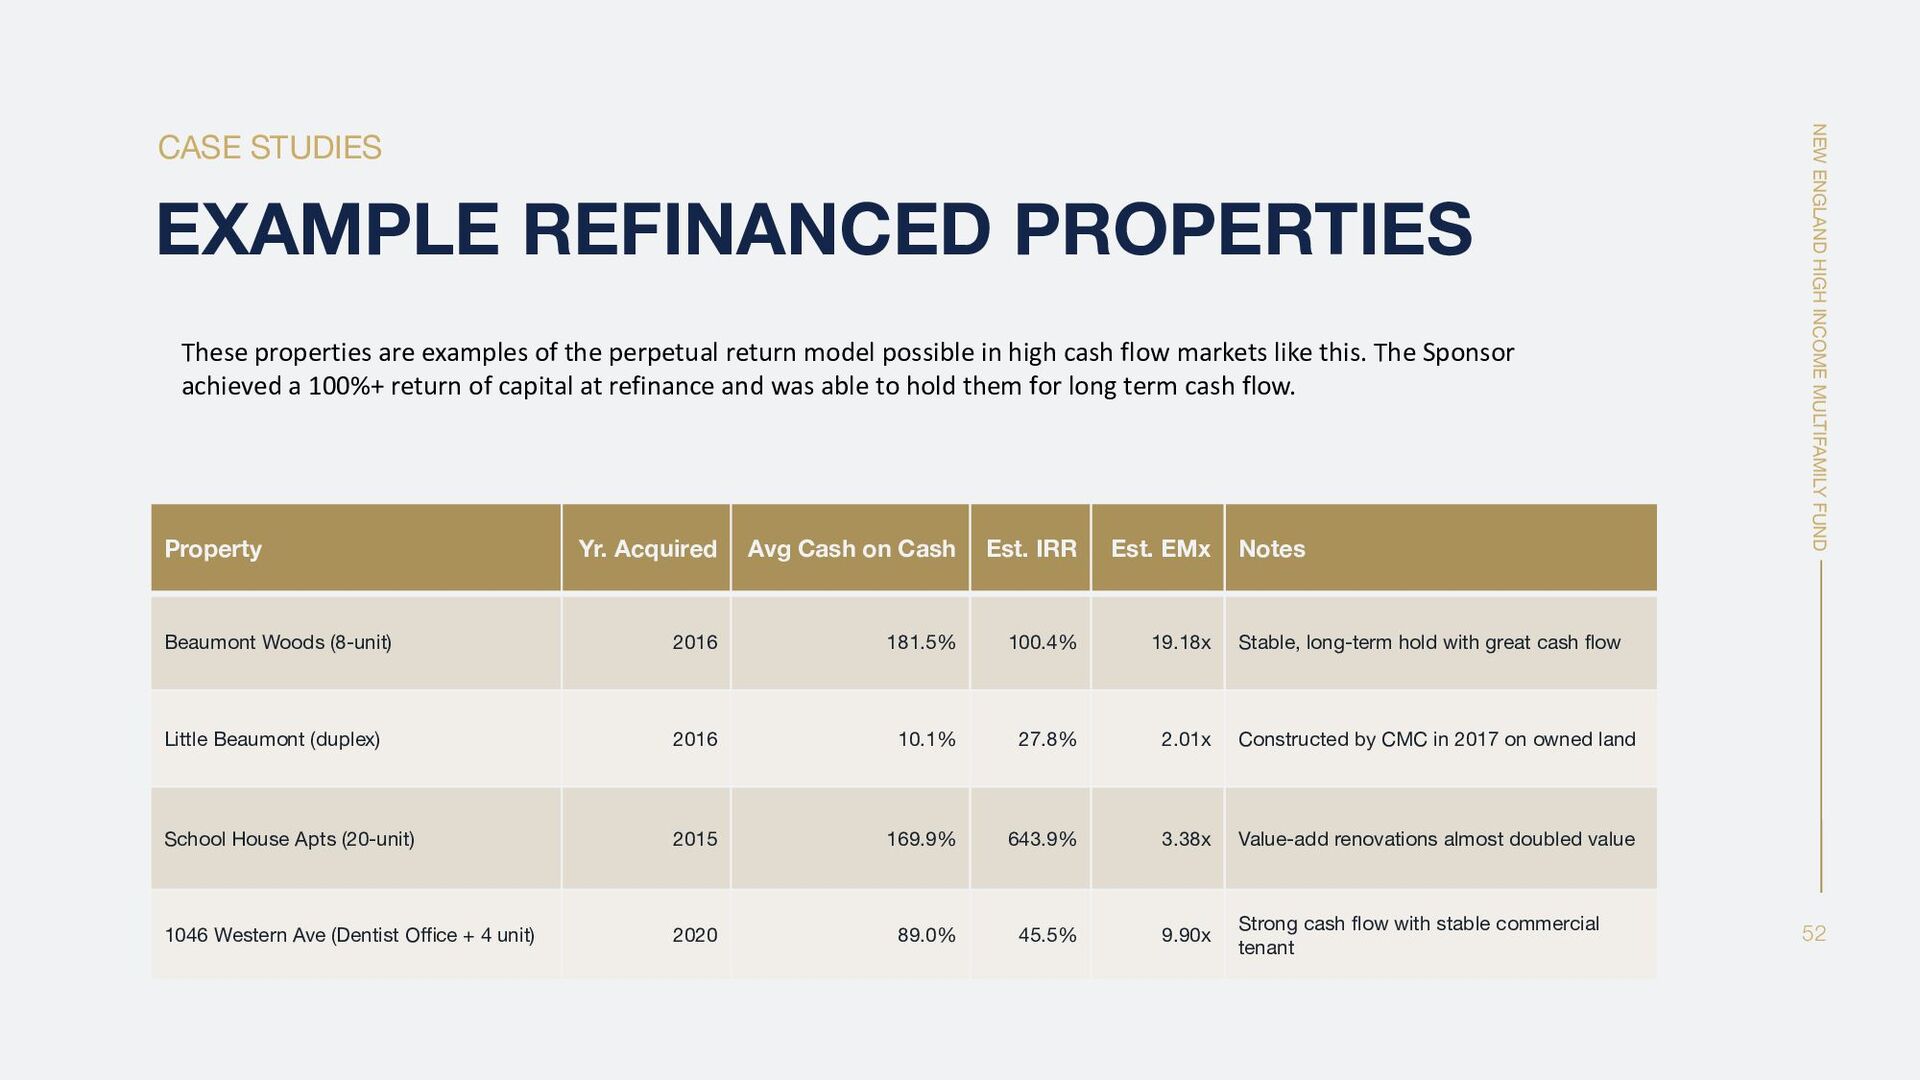
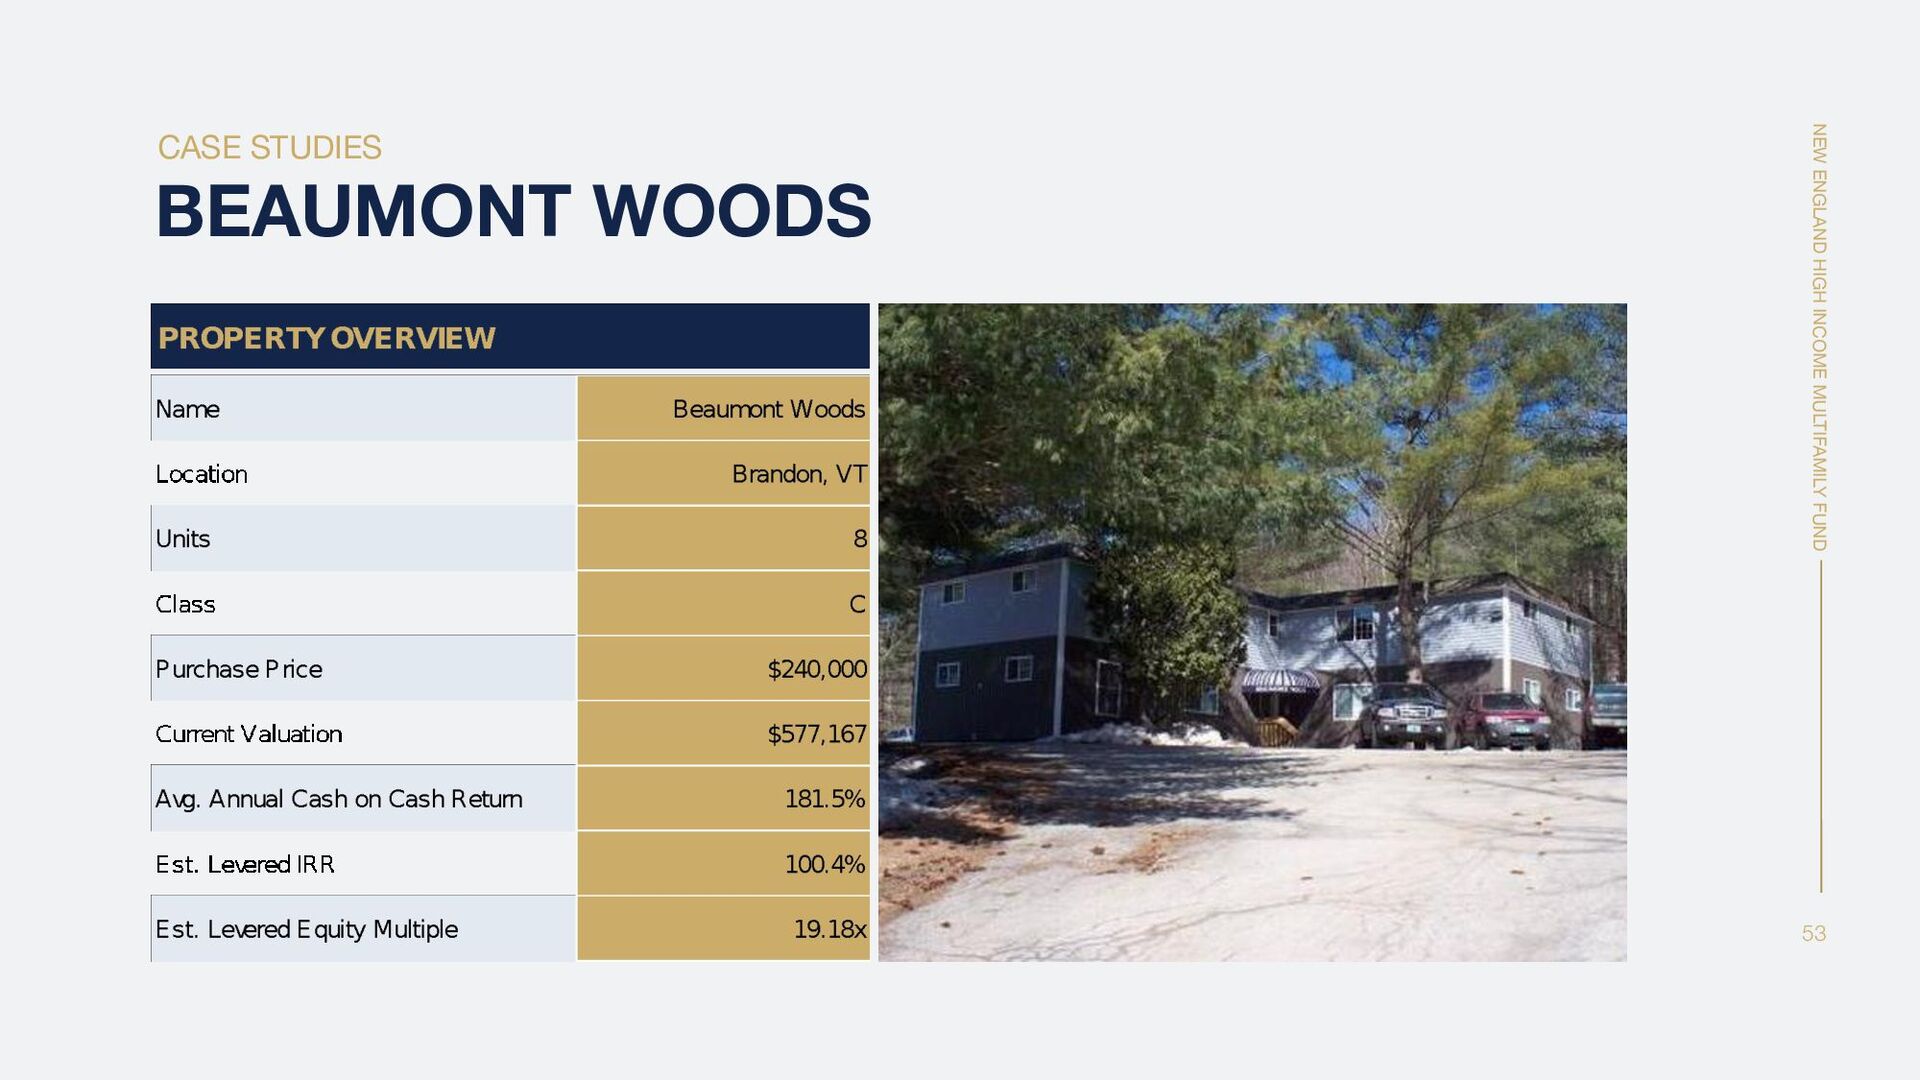
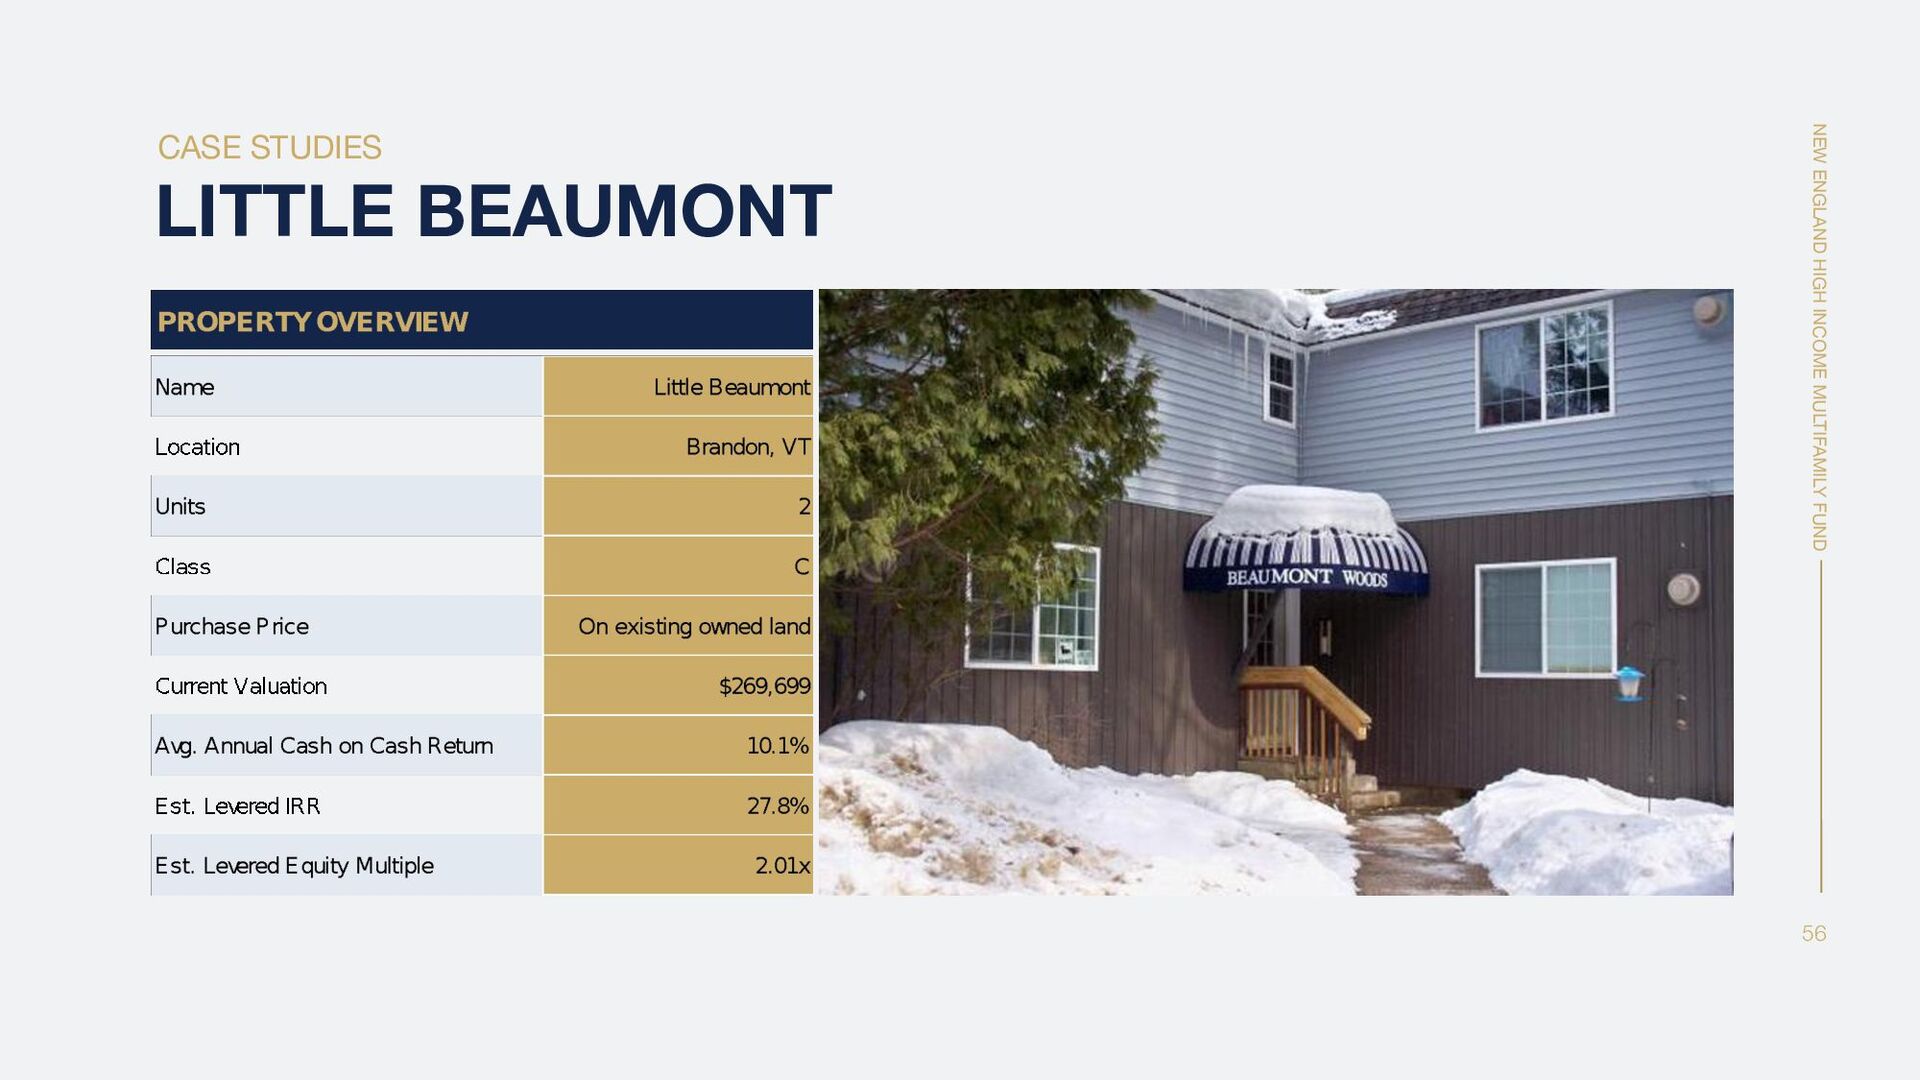
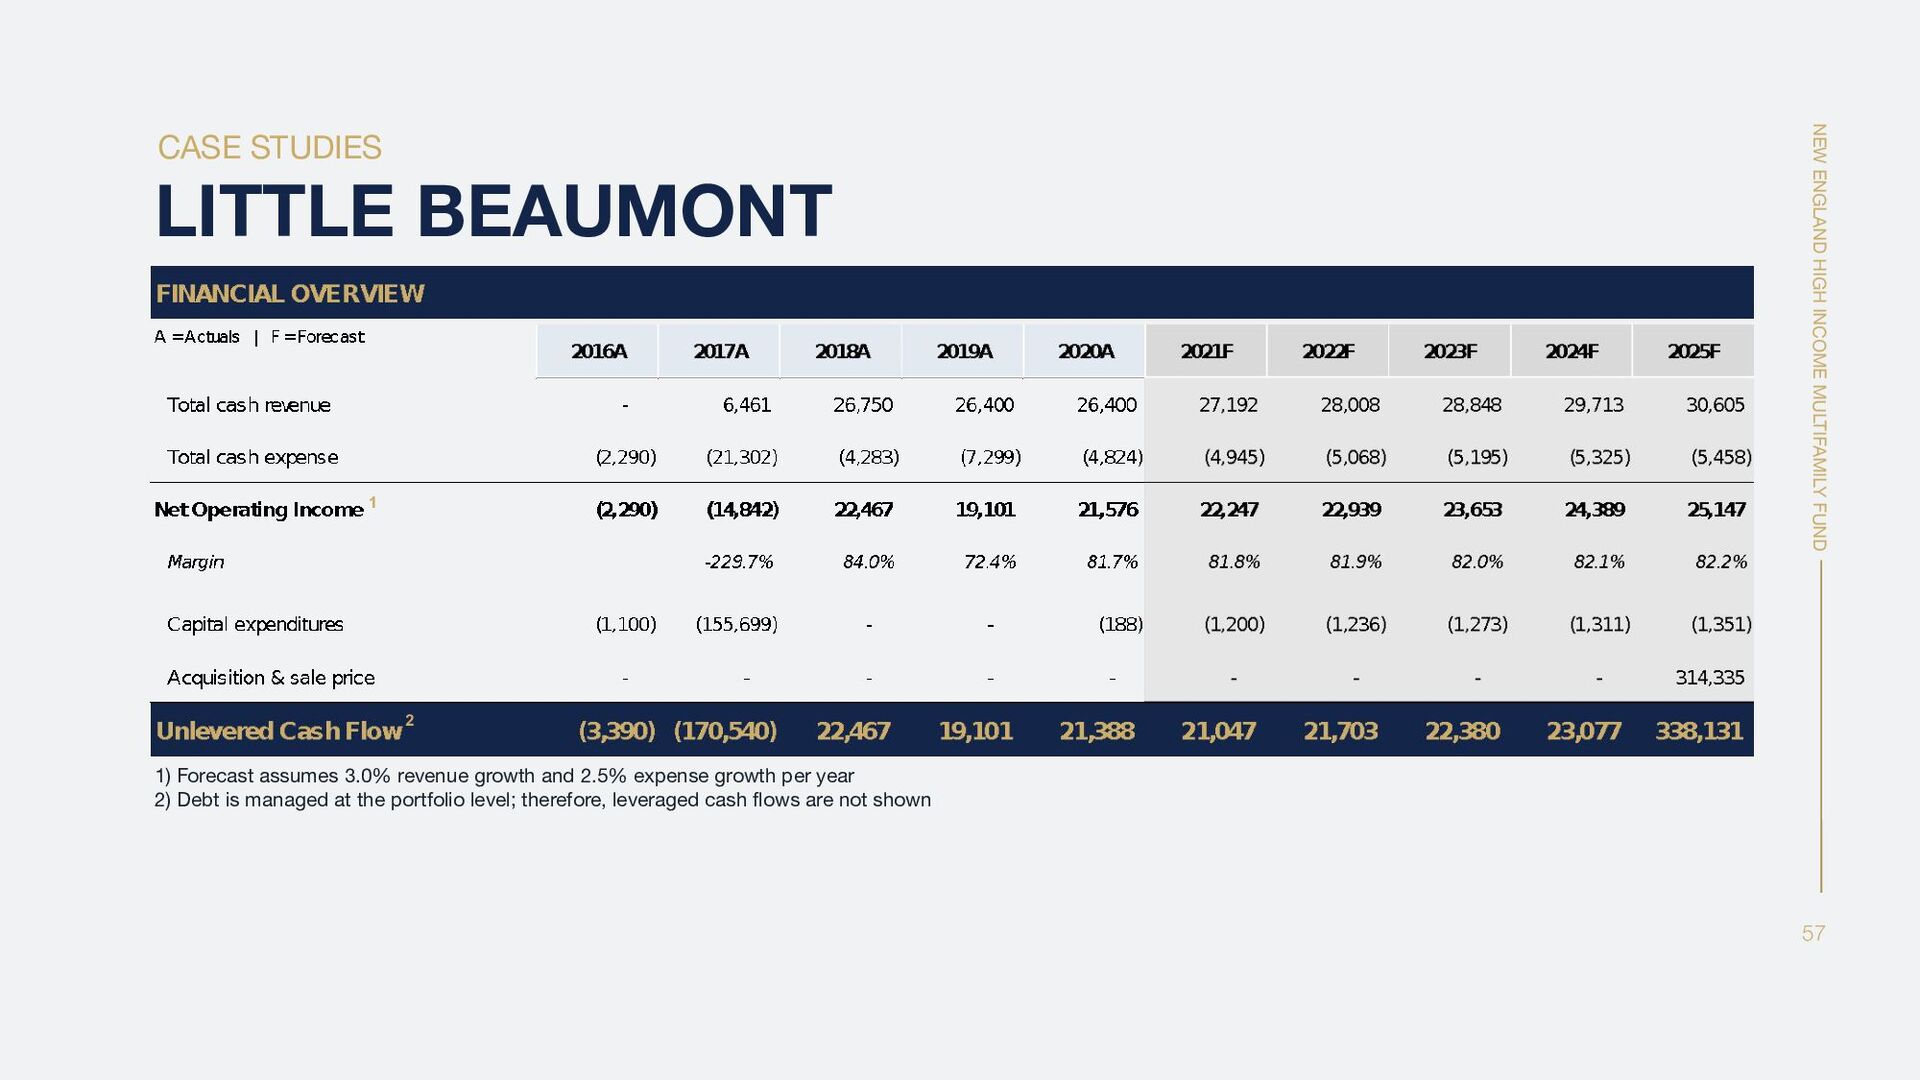
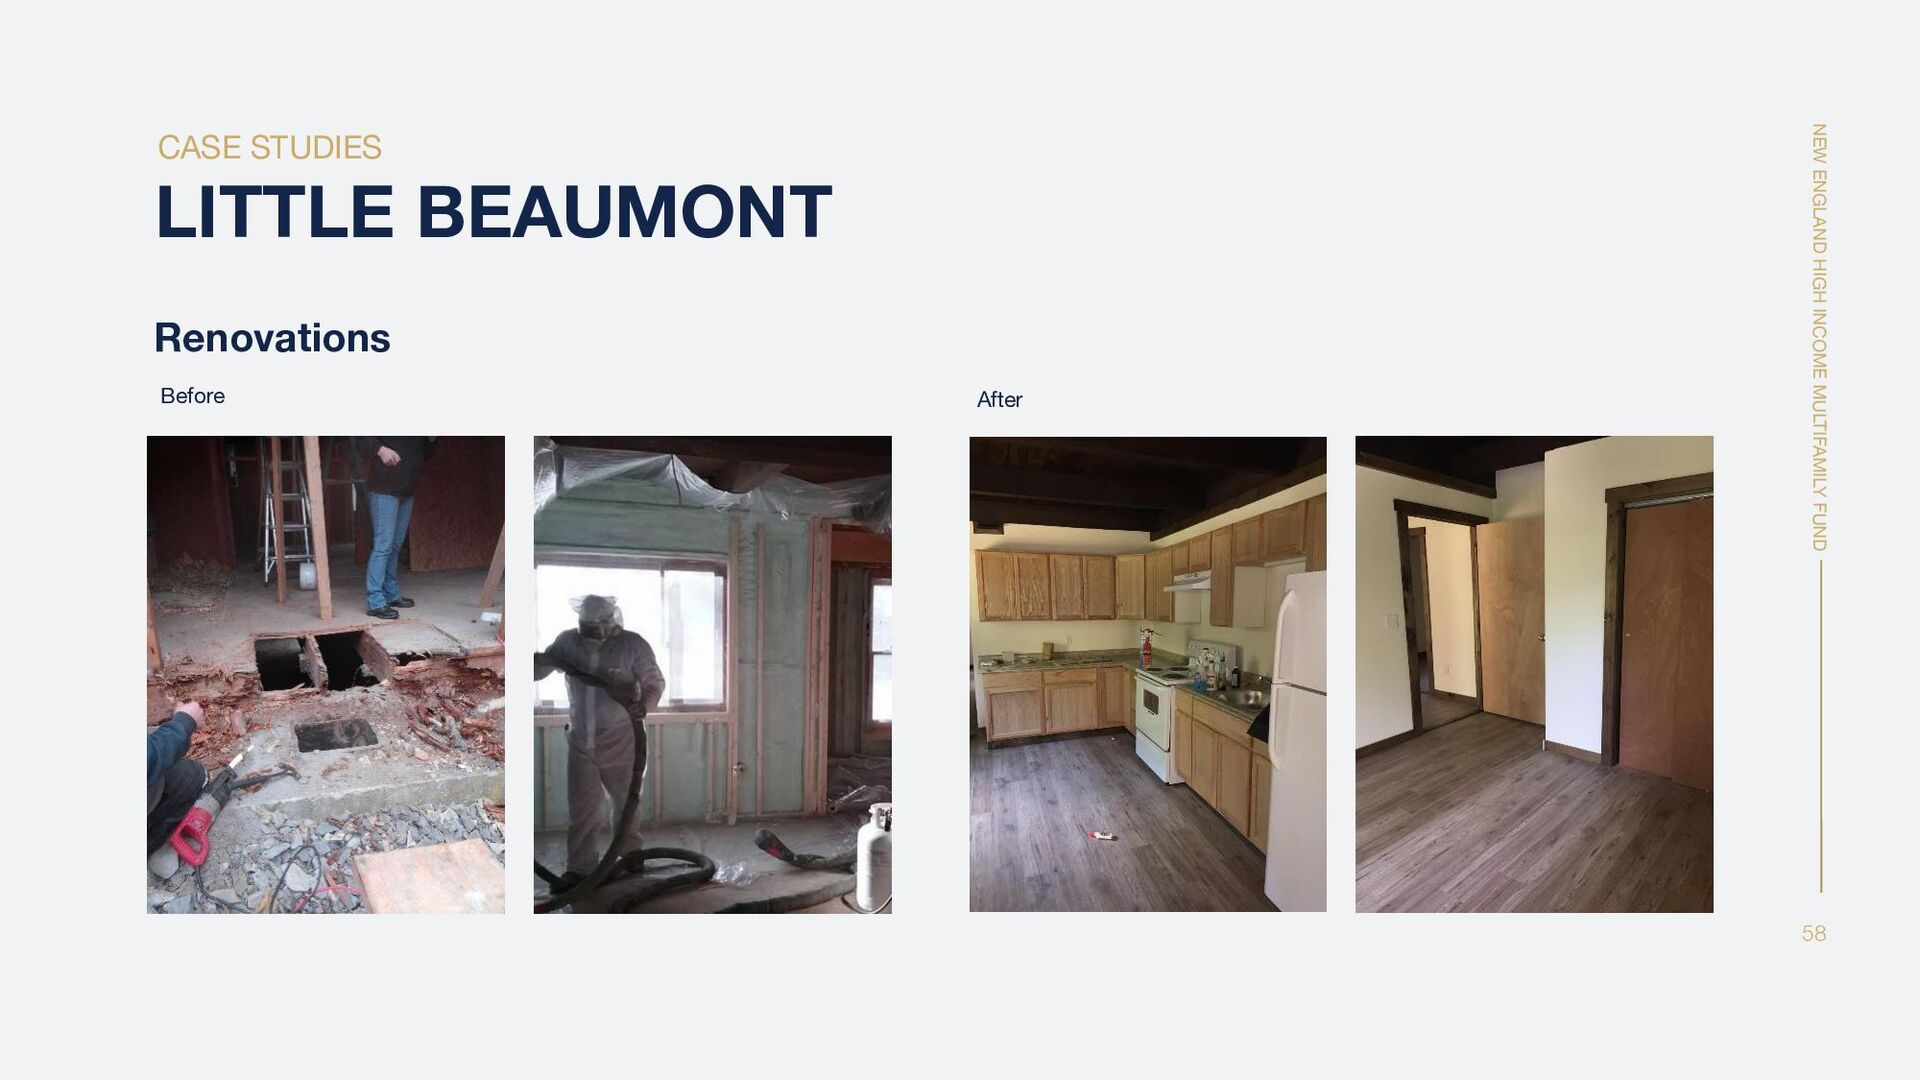
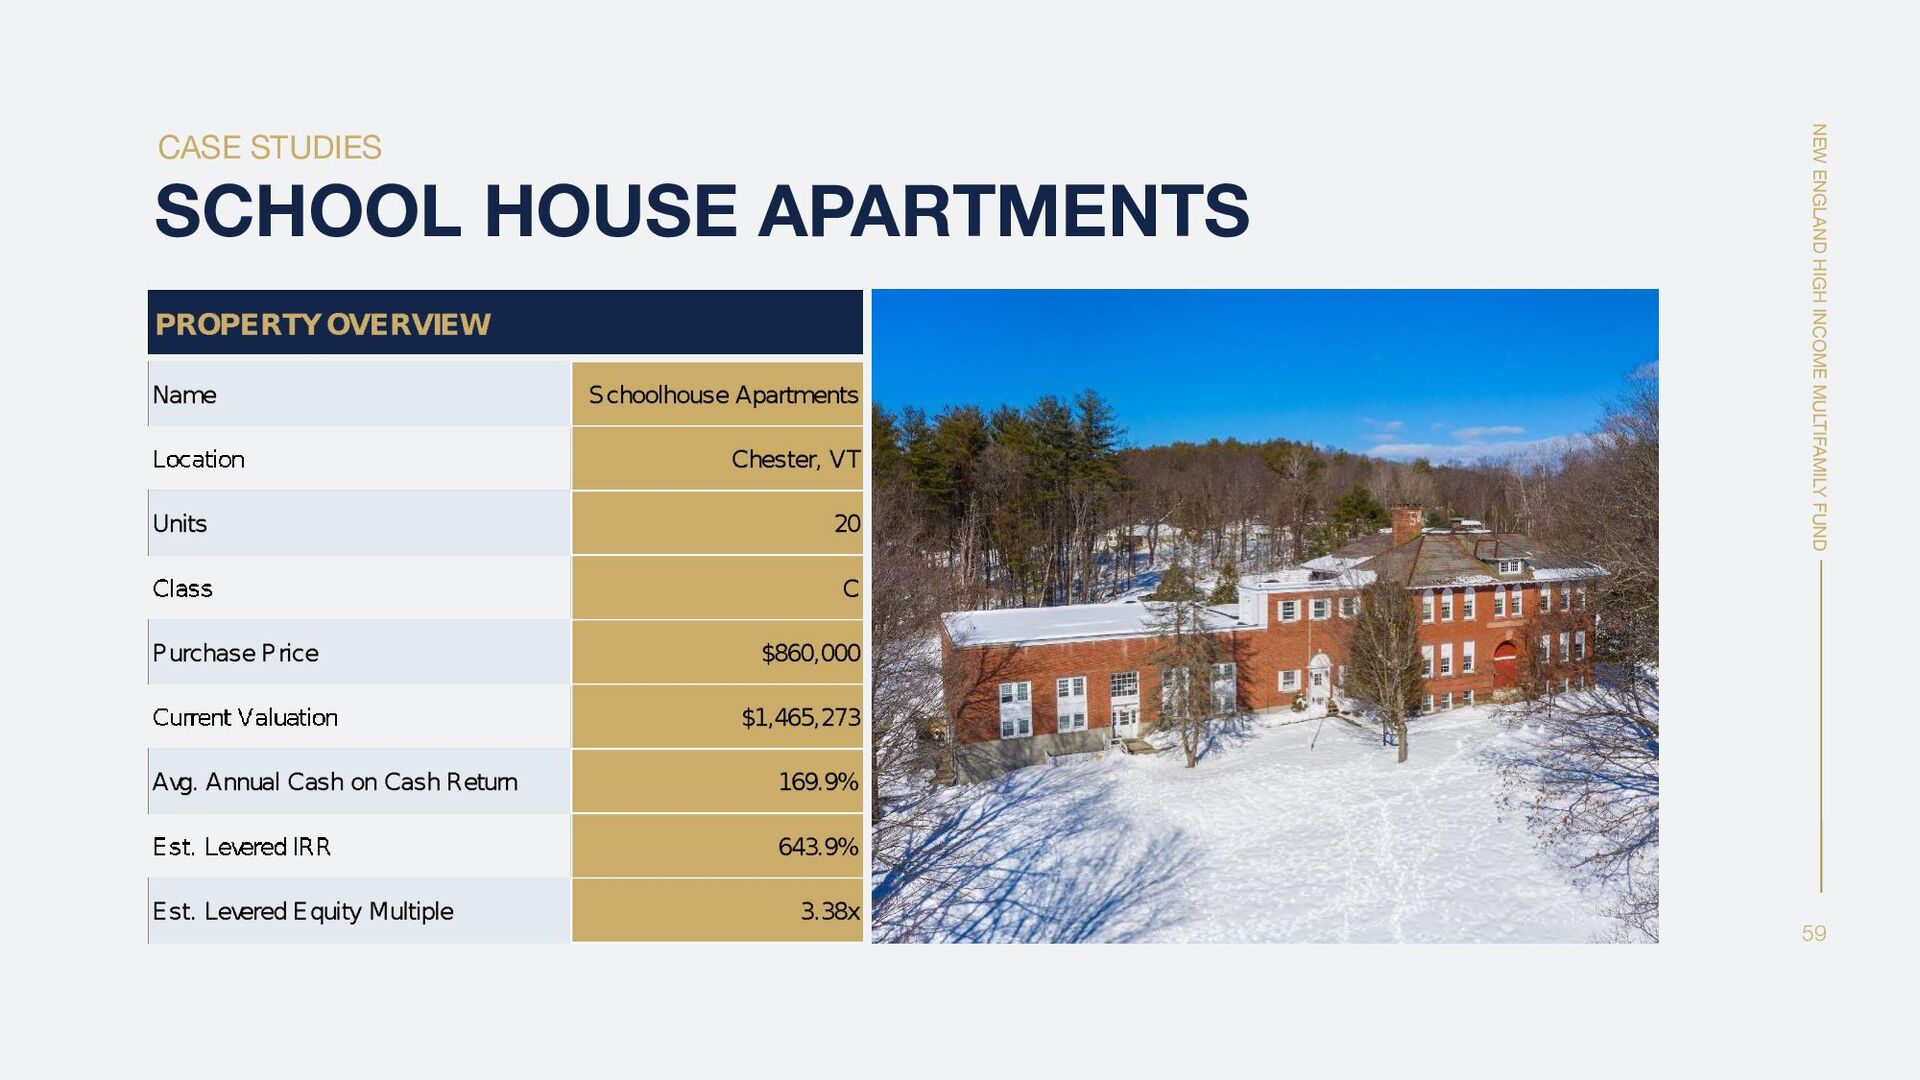
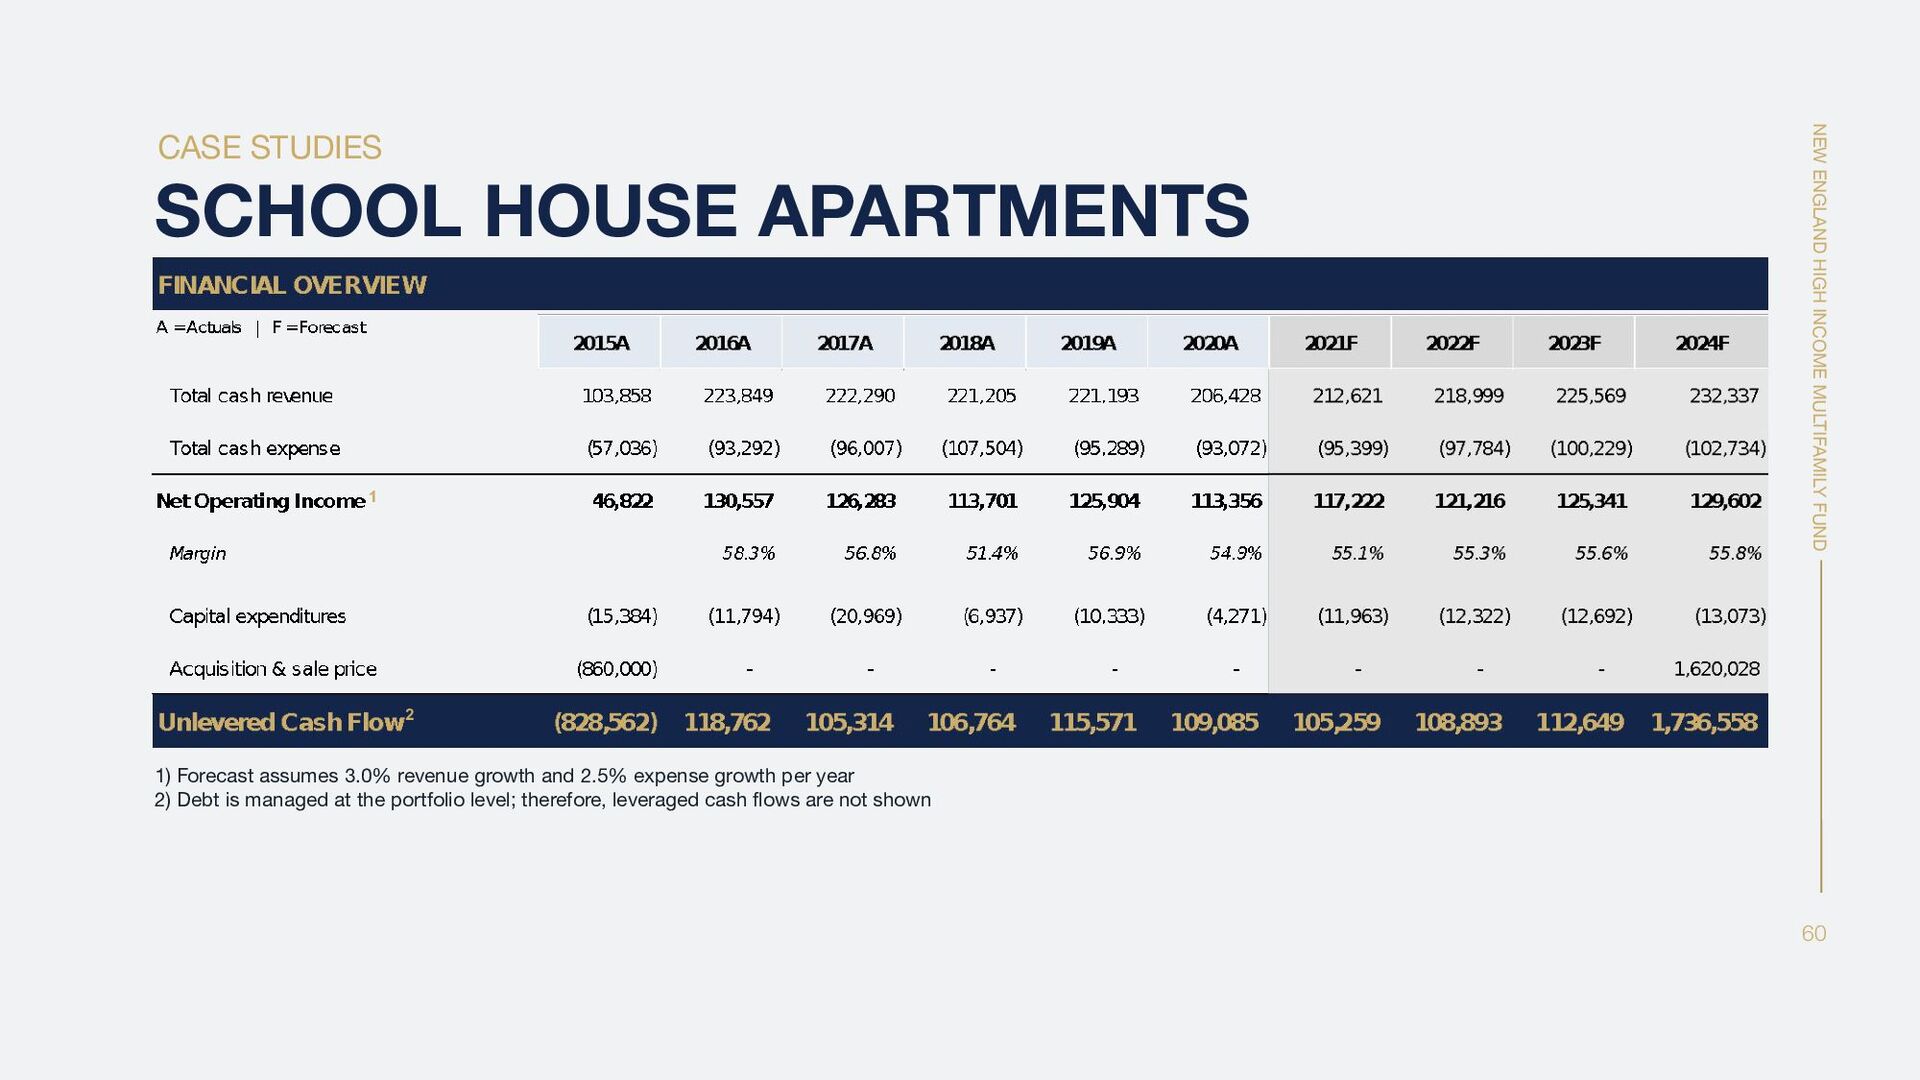
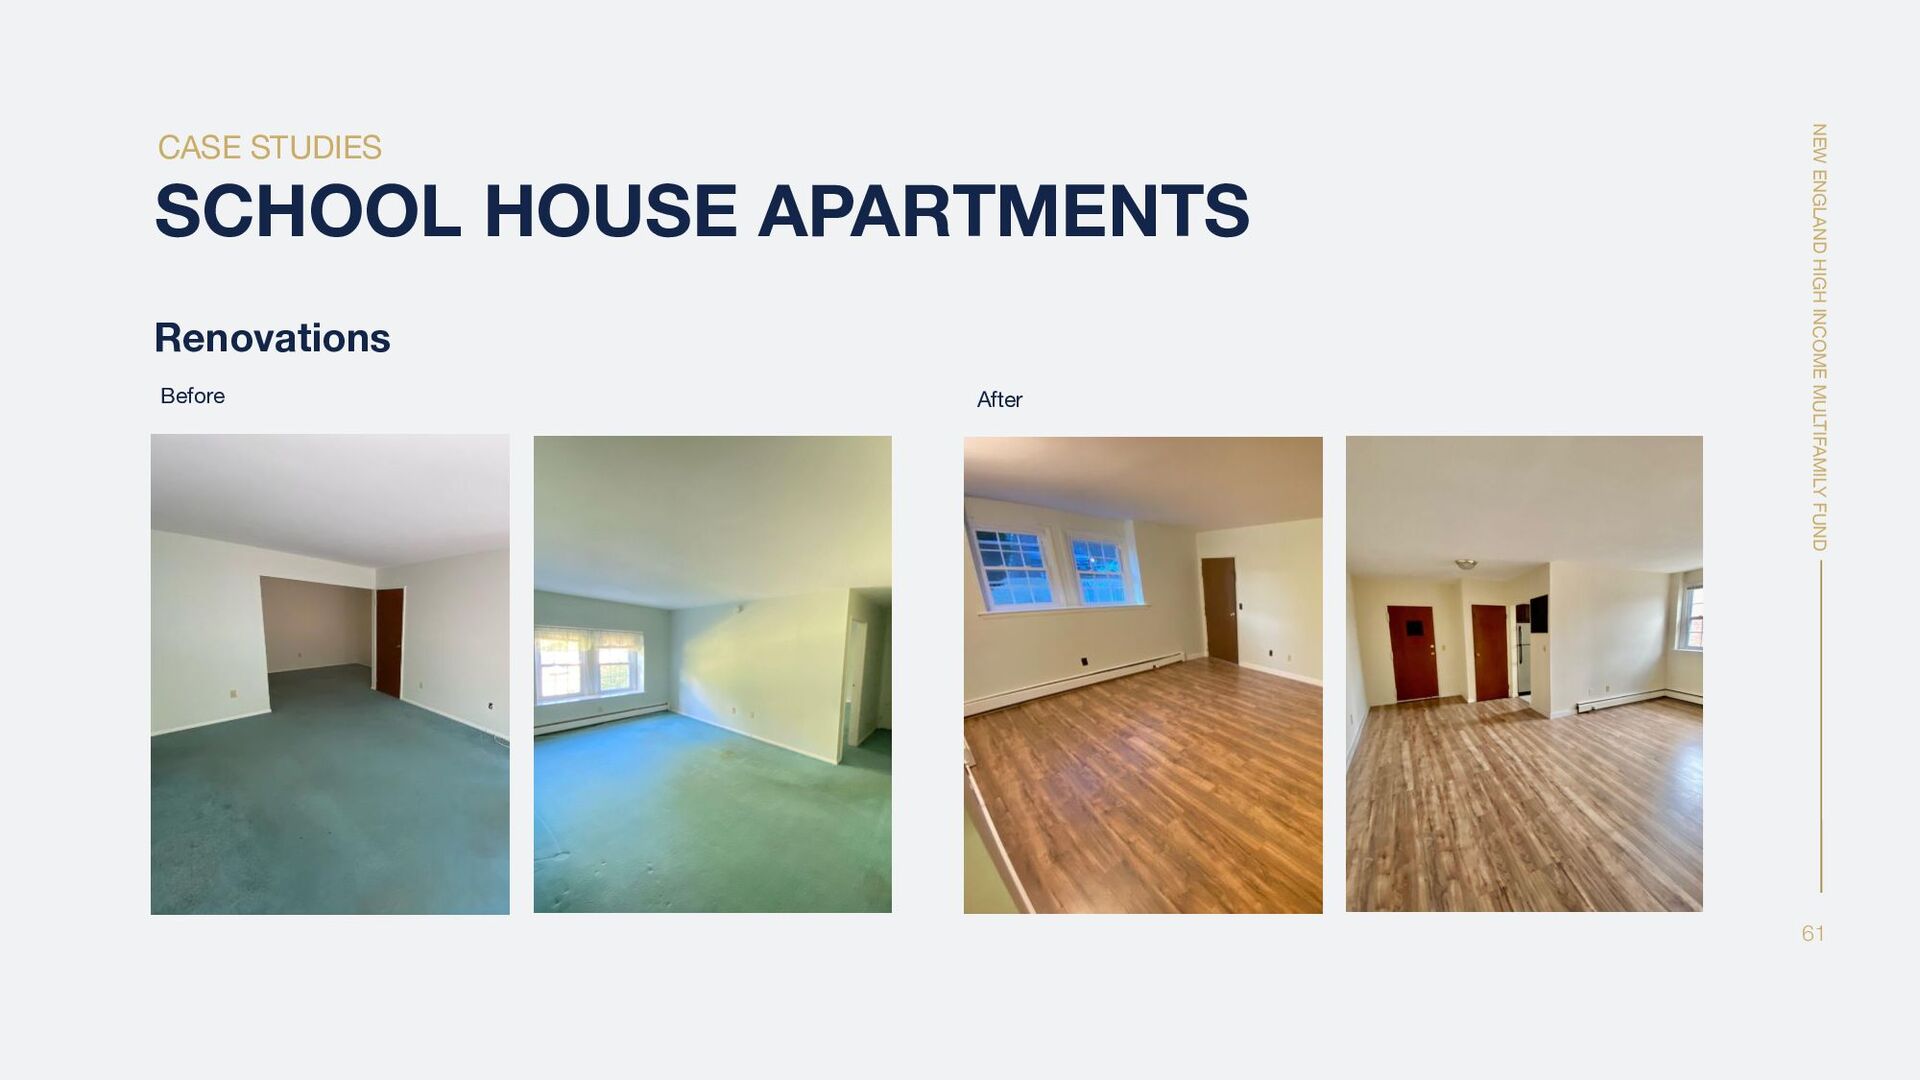
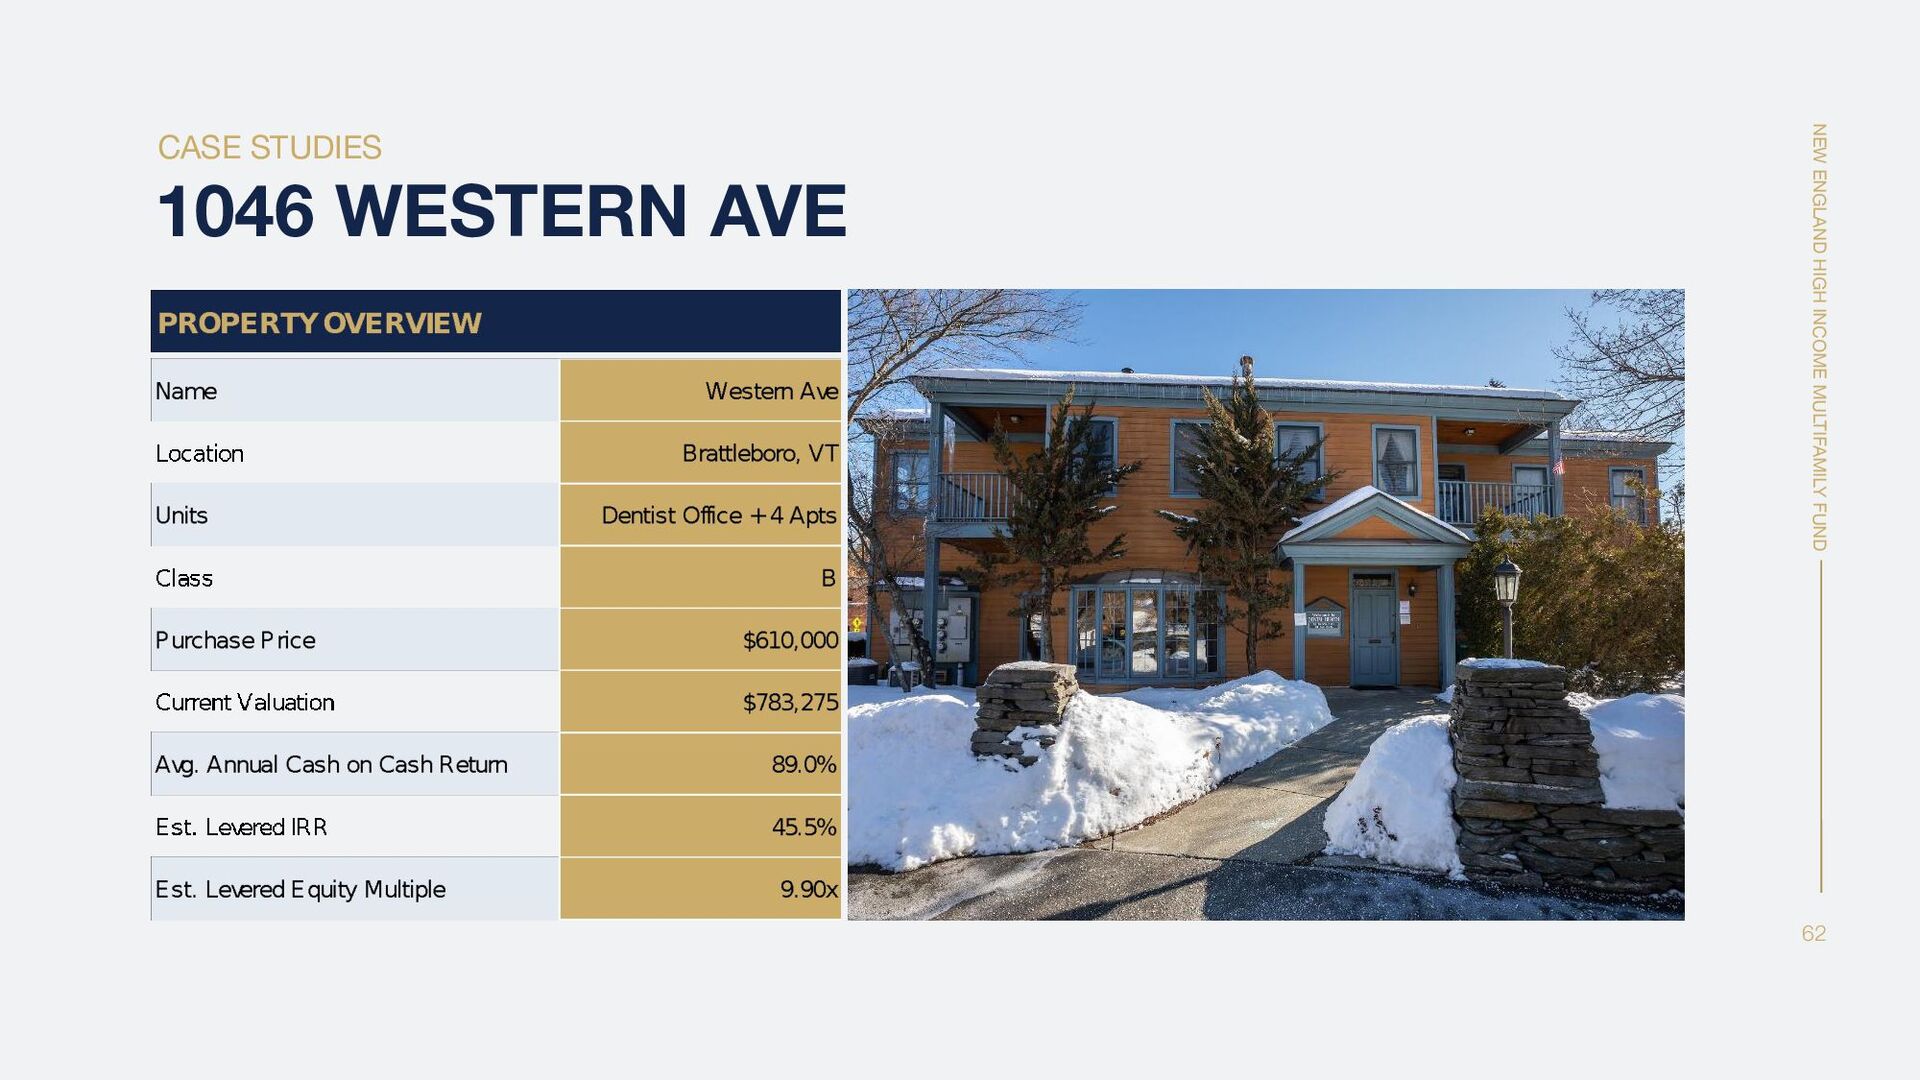
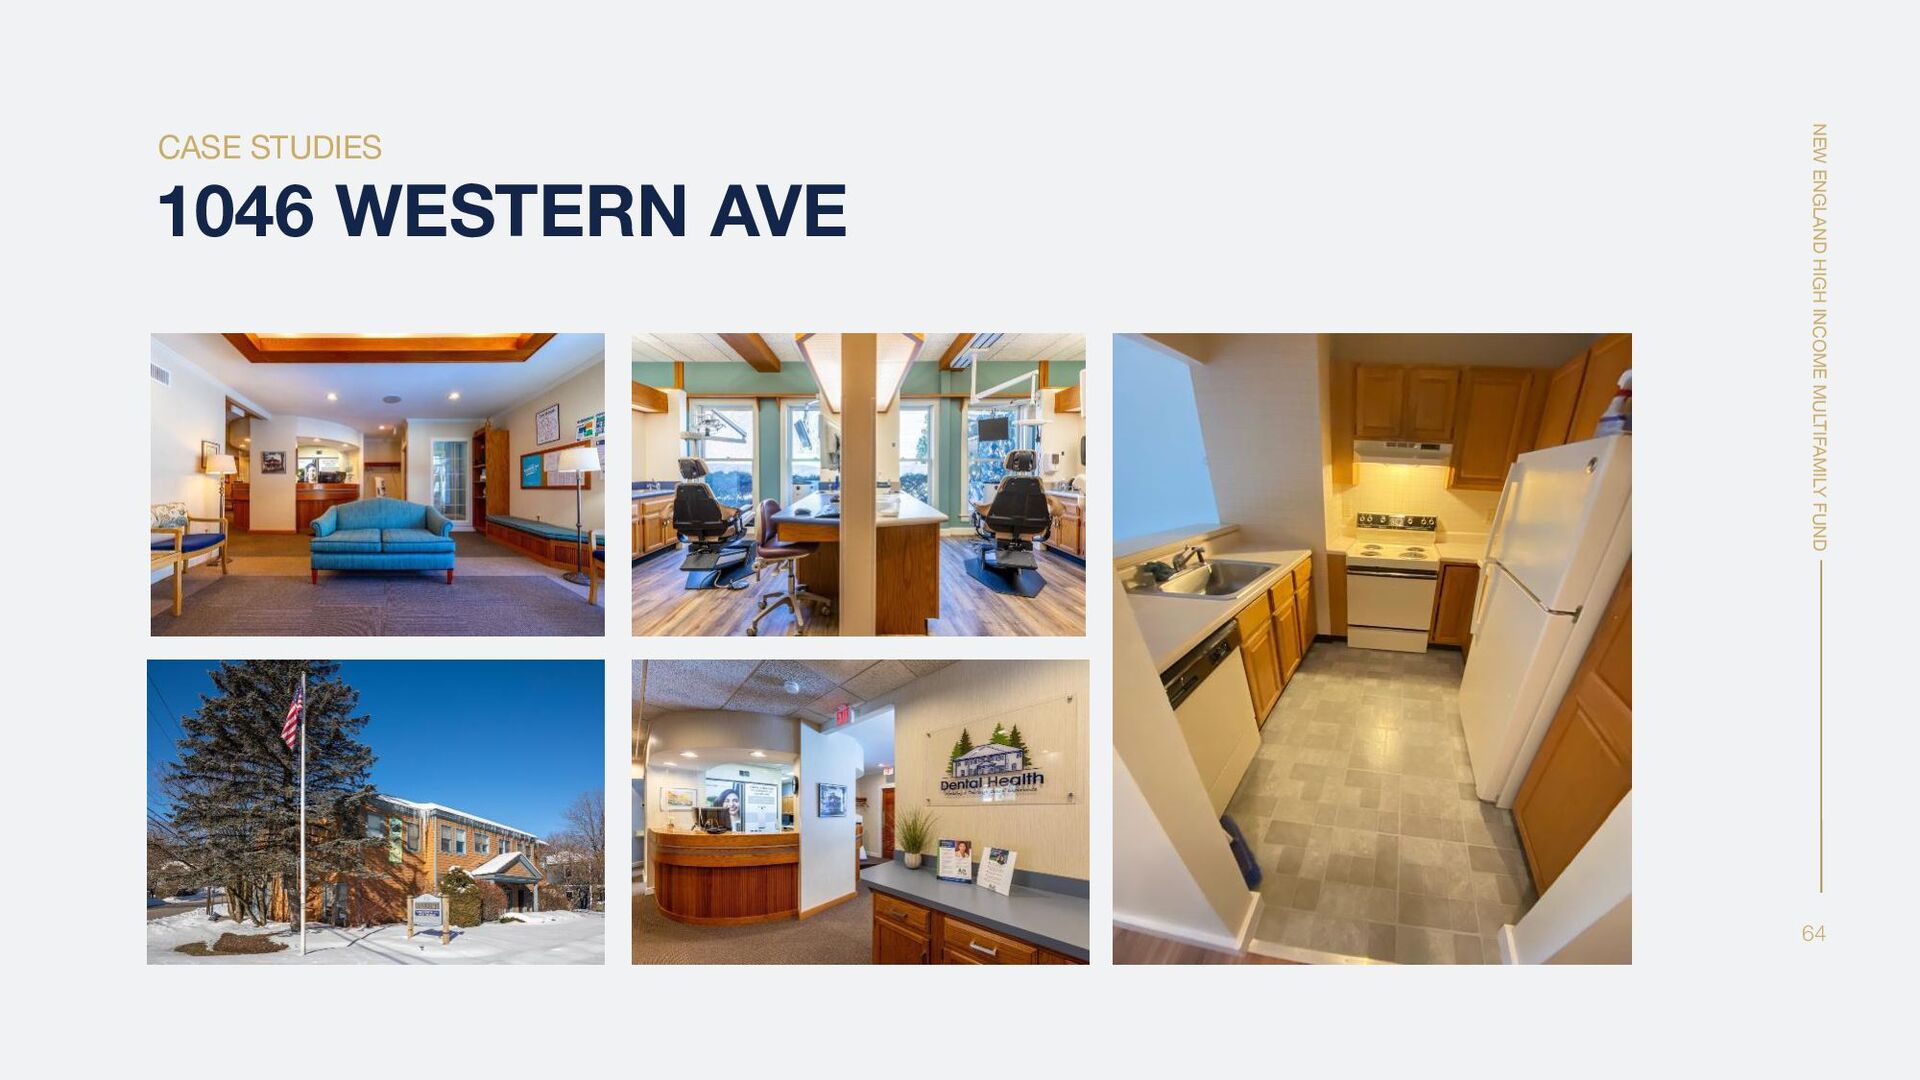
    Yr. Acquired Avg Cash on Cash Est. IRR Est. EMx Notes Beaumont Woods (8-unit) 2016 181.5% 100.4% 19.18x Stable, long-term hold with great cash flow Little Beaumont (duplex) 2016 10.1% 27.8% 2.01x Constructed by CMC in 2017 on owned land School House Apts (20-unit) 2015 169.9% 643.9% 3.38x Value-add renovations almost doubled value 1046 Western Ave (Dentist Office + 4 unit) 2020 89.0% 45.5% 9.90x Strong cash flow with stable commercial tenant EXAMPLE REFINANCED PROPERTIES These properties are examples of the perpetual return model possible in high cash flow markets like this. The Sponsor achieved a 100%+ return of capital at refinance and was able to hold them for long term cash flow.
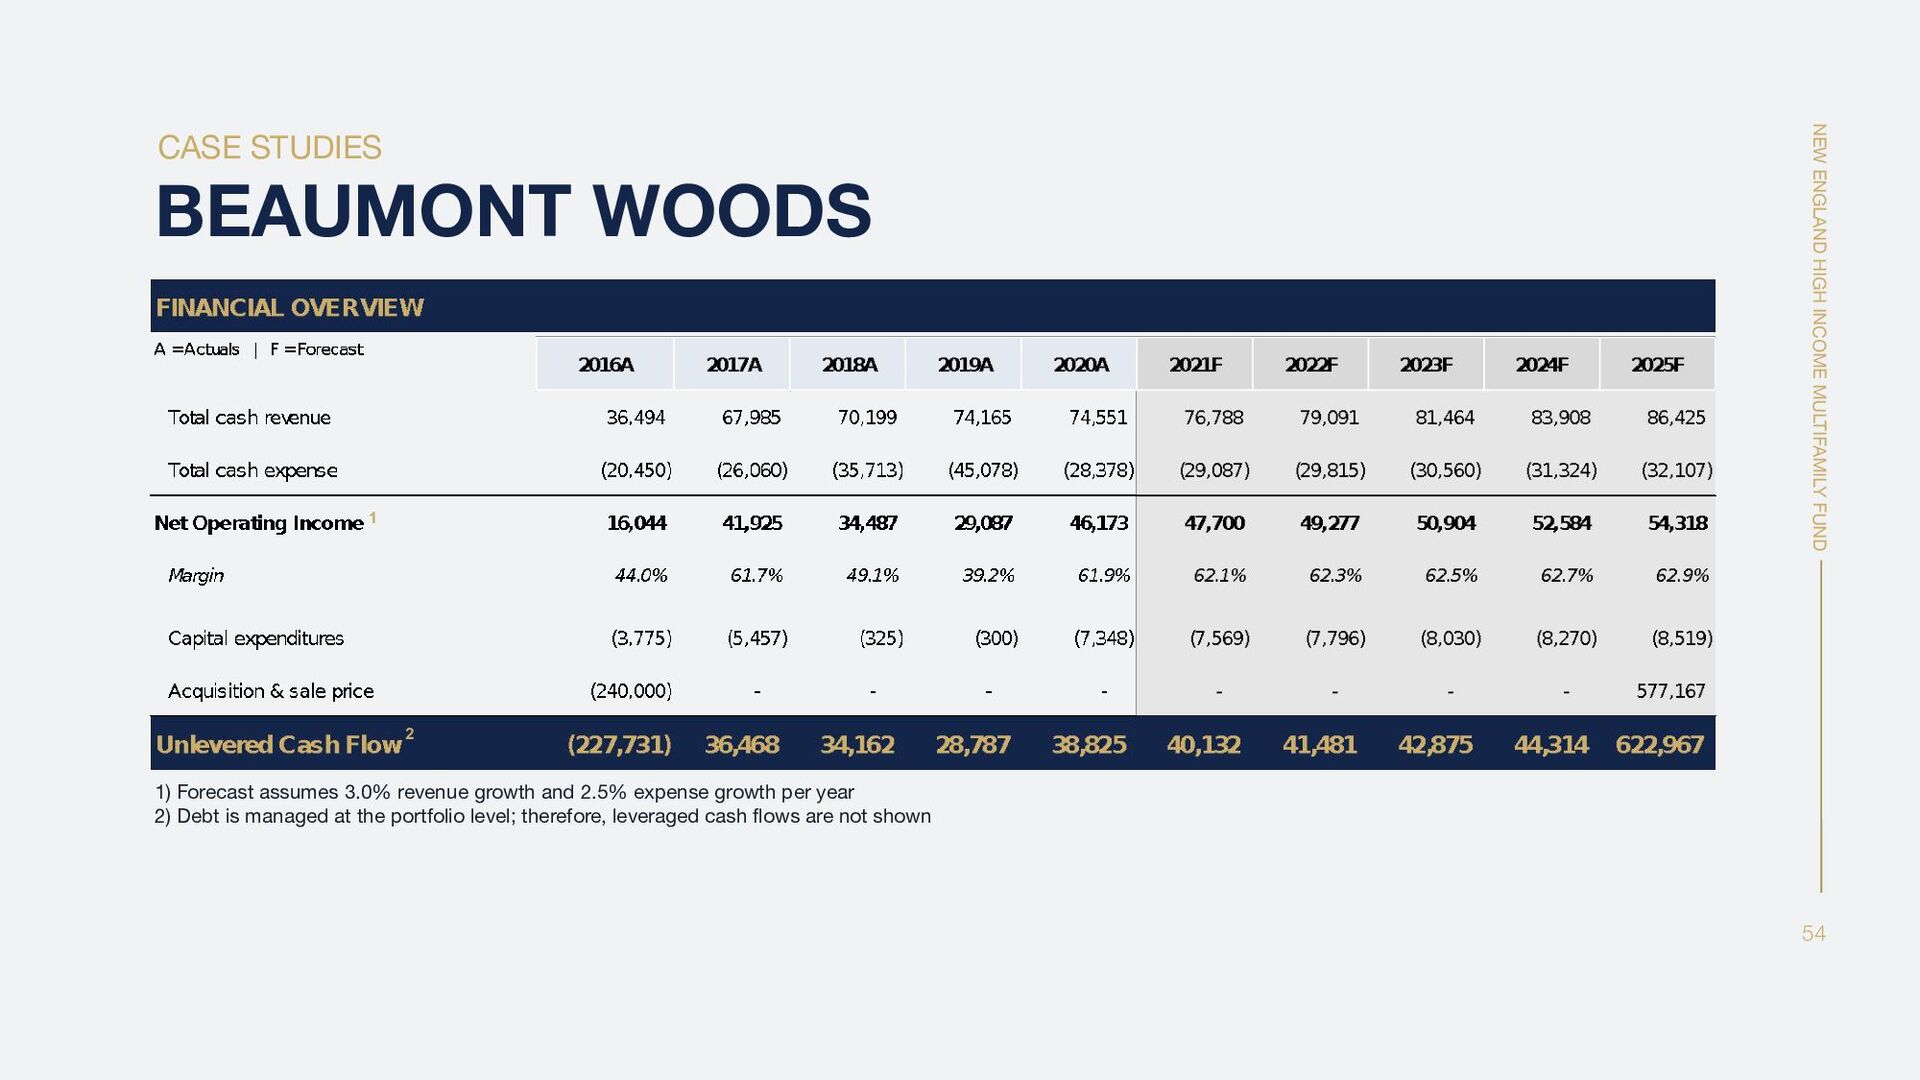
  41. NEW ENGLAND HIGH INCOME MULTIFAMILY FUND CASE STUDIES 54 BEAUMONT

    WOODS 1) Forecast assumes 3.0% revenue growth and 2.5% expense growth per year 2) Debt is managed at the portfolio level; therefore, leveraged cash flows are not shown 2 1
  42. NEW ENGLAND HIGH INCOME MULTIFAMILY FUND CASE STUDIES 57 LITTLE

    BEAUMONT 1) Forecast assumes 3.0% revenue growth and 2.5% expense growth per year 2) Debt is managed at the portfolio level; therefore, leveraged cash flows are not shown 2 1
  43. NEW ENGLAND HIGH INCOME MULTIFAMILY FUND CASE STUDIES 60 SCHOOL

    HOUSE APARTMENTS 1) Forecast assumes 3.0% revenue growth and 2.5% expense growth per year 2) Debt is managed at the portfolio level; therefore, leveraged cash flows are not shown 2 1
  44. NEW ENGLAND HIGH INCOME MULTIFAMILY FUND CASE STUDIES 61 SCHOOL

    HOUSE APARTMENTS Renovations Before After
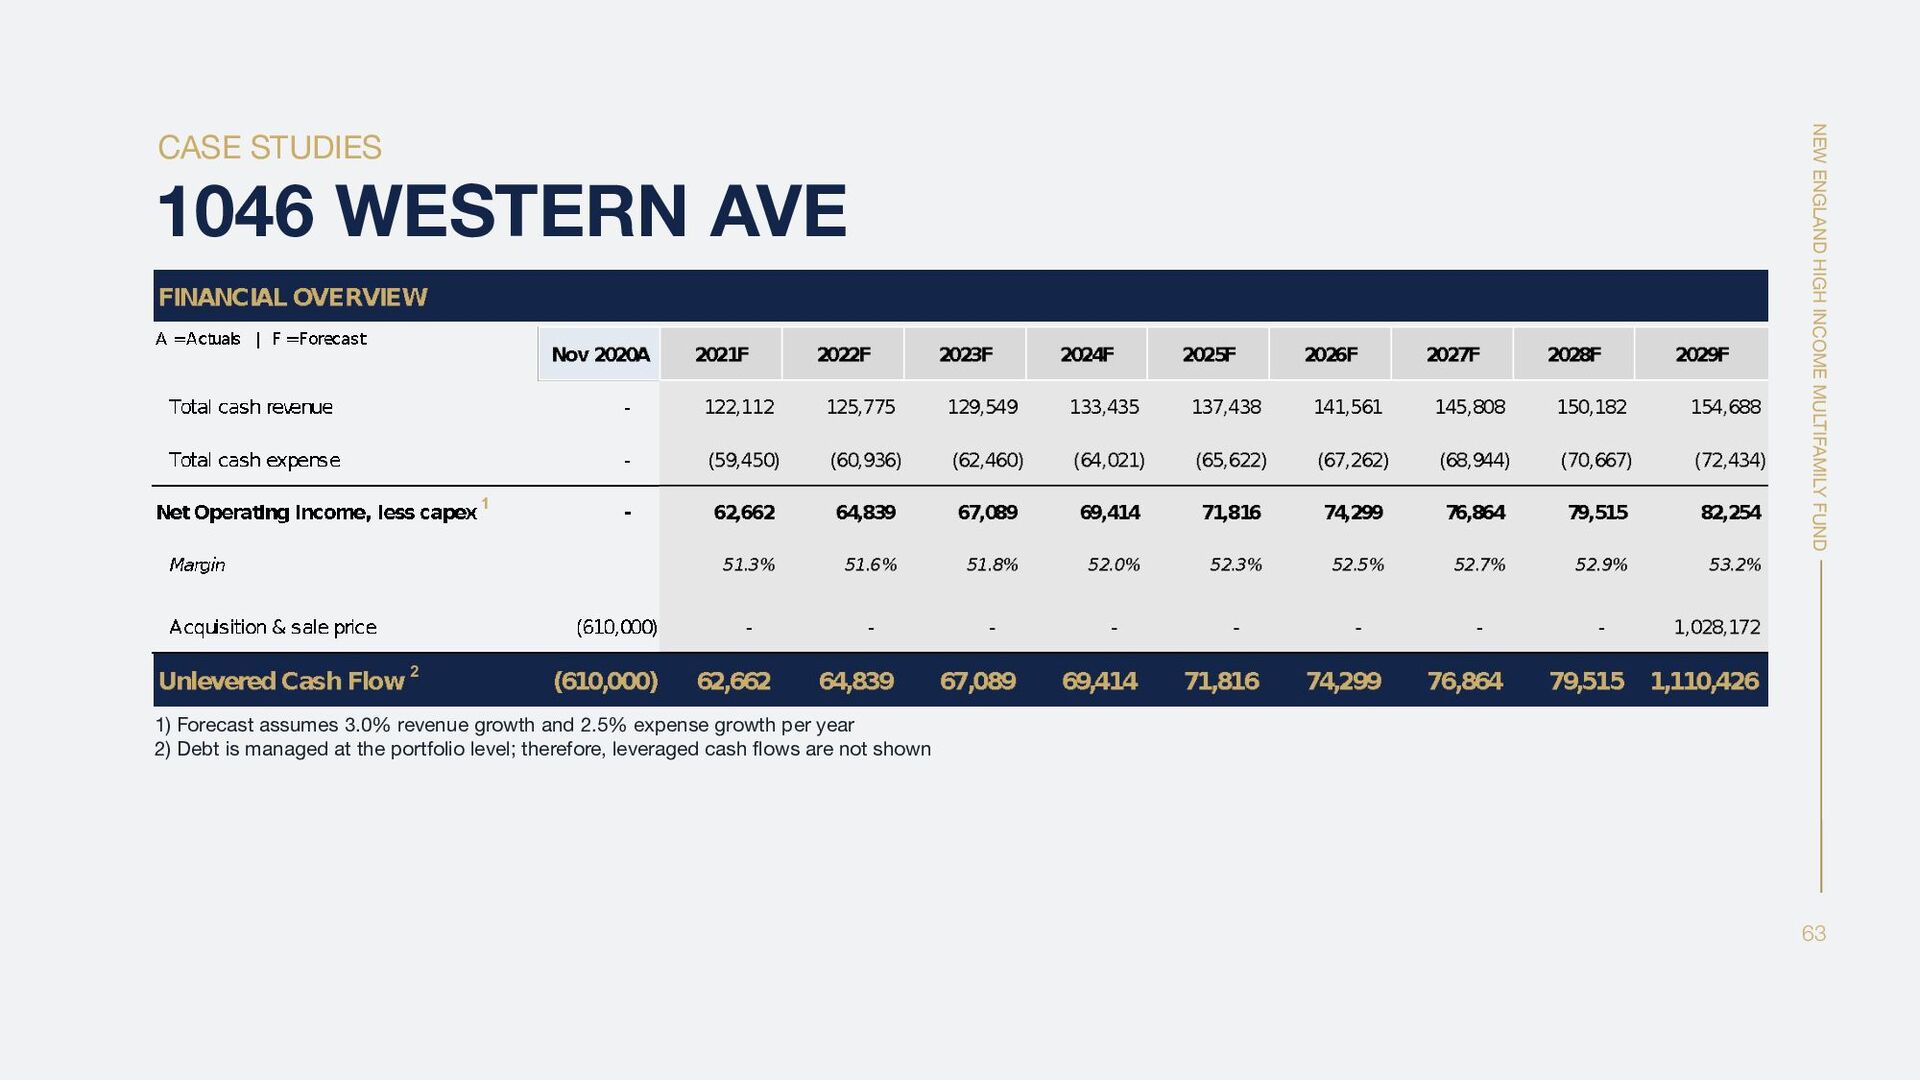
  45. NEW ENGLAND HIGH INCOME MULTIFAMILY FUND CASE STUDIES 63 1046

    WESTERN AVE 1) Forecast assumes 3.0% revenue growth and 2.5% expense growth per year 2) Debt is managed at the portfolio level; therefore, leveraged cash flows are not shown 2 1