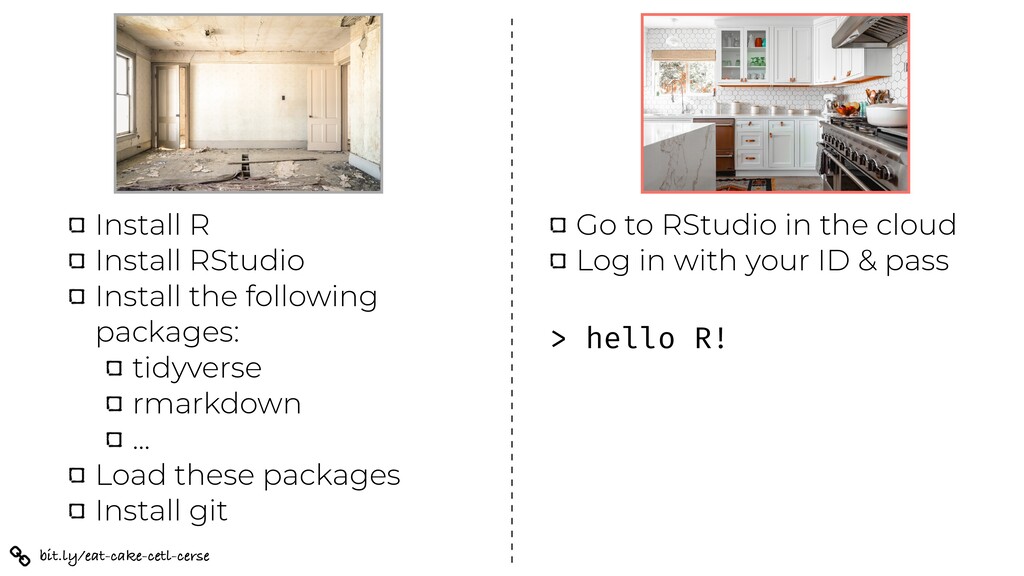
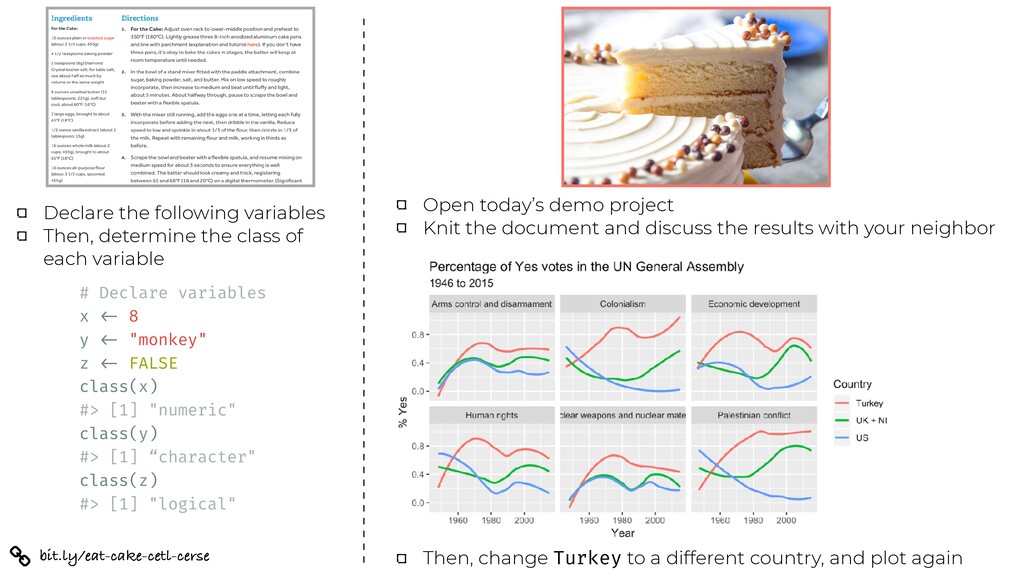
z <- FALSE class(x) #> [1] "numeric" class(y) #> [1] “character" class(z) #> [1] "logical" Declare the following variables Then, determine the class of each variable Open today’s demo project Knit the document and discuss the results with your neighbor Then, change Turkey to a different country, and plot again
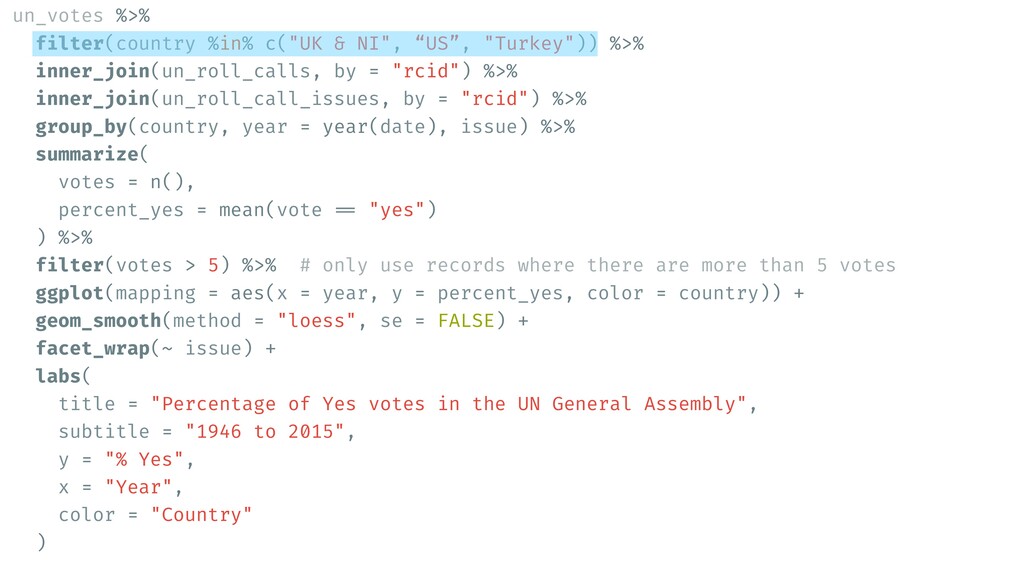
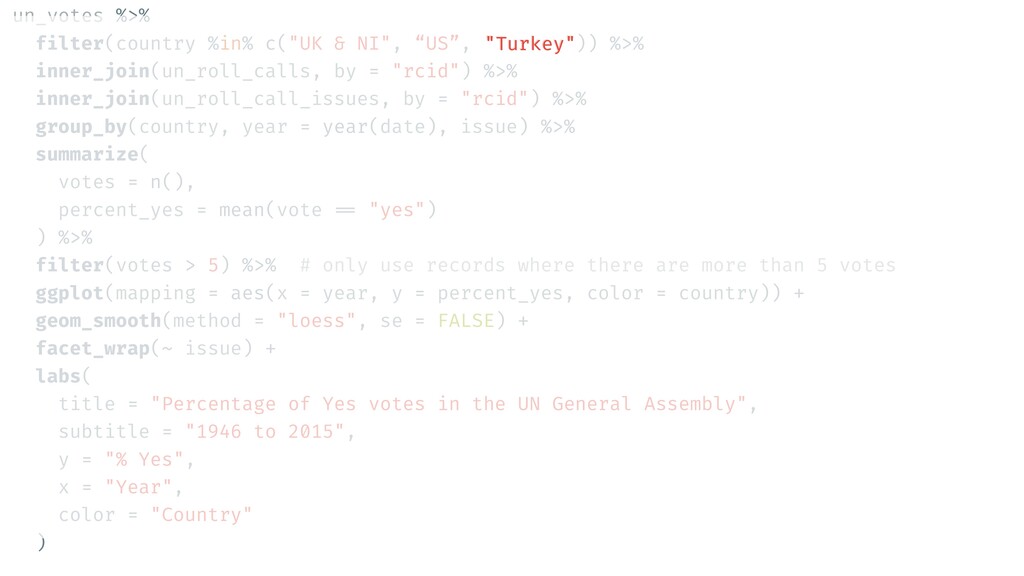
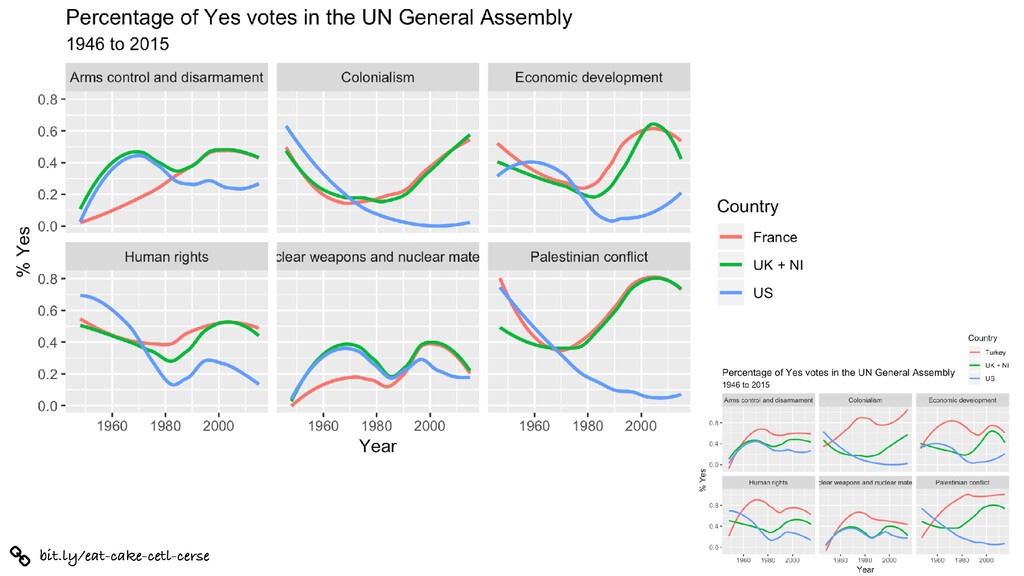
inner_join(un_roll_calls, by = "rcid") %>% inner_join(un_roll_call_issues, by = "rcid") %>% group_by(country, year = year(date), issue) %>% summarize( votes = n(), percent_yes = mean(vote == "yes") ) %>% filter(votes > 5) %>% # only use records where there are more than 5 votes ggplot(mapping = aes(x = year, y = percent_yes, color = country)) + geom_smooth(method = "loess", se = FALSE) + facet_wrap(~ issue) + labs( title = "Percentage of Yes votes in the UN General Assembly", subtitle = "1946 to 2015", y = "% Yes", x = "Year", color = "Country" )
inner_join(un_roll_calls, by = "rcid") %>% inner_join(un_roll_call_issues, by = "rcid") %>% group_by(country, year = year(date), issue) %>% summarize( votes = n(), percent_yes = mean(vote == "yes") ) %>% filter(votes > 5) %>% # only use records where there are more than 5 votes ggplot(mapping = aes(x = year, y = percent_yes, color = country)) + geom_smooth(method = "loess", se = FALSE) + facet_wrap(~ issue) + labs( title = "Percentage of Yes votes in the UN General Assembly", subtitle = "1946 to 2015", y = "% Yes", x = "Year", color = "Country" ) "Turkey"
inner_join(un_roll_calls, by = "rcid") %>% inner_join(un_roll_call_issues, by = "rcid") %>% group_by(country, year = year(date), issue) %>% summarize( votes = n(), percent_yes = mean(vote == "yes") ) %>% filter(votes > 5) %>% # only use records where there are more than 5 votes ggplot(mapping = aes(x = year, y = percent_yes, color = country)) + geom_smooth(method = "loess", se = FALSE) + facet_wrap(~ issue) + labs( title = "Percentage of Yes votes in the UN General Assembly", subtitle = "1946 to 2015", y = "% Yes", x = "Year", color = "Country" ) "France"
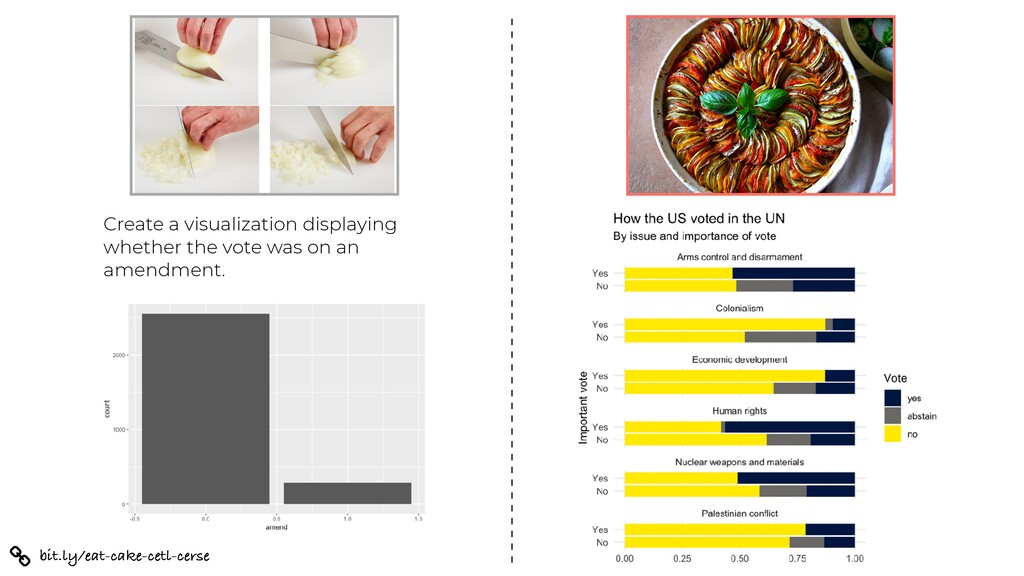
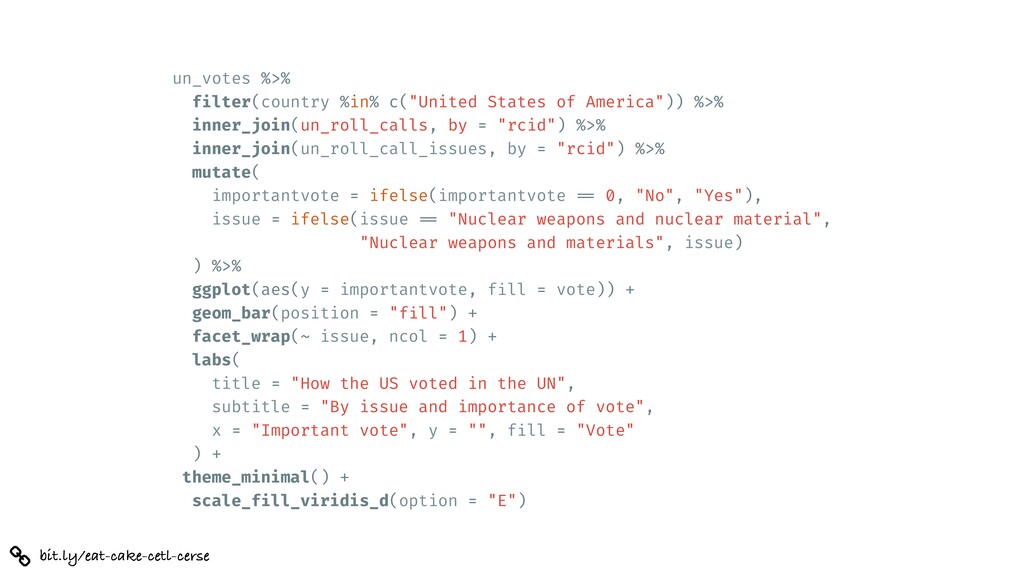
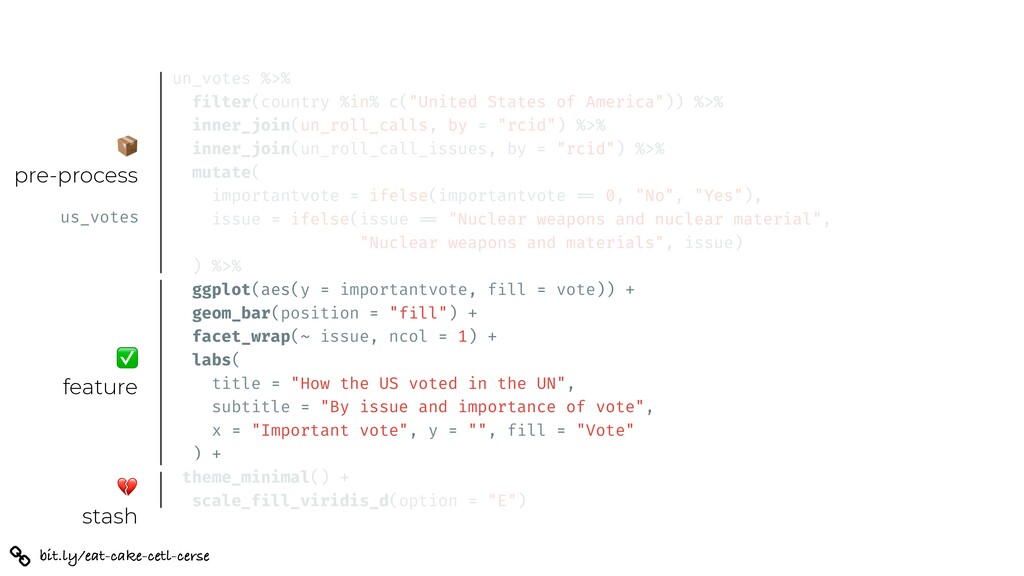
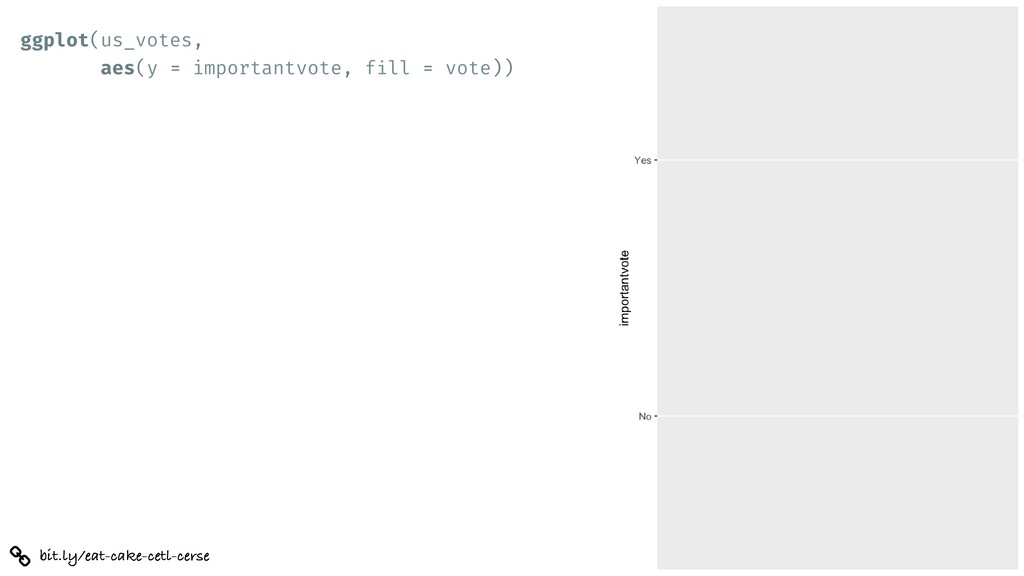
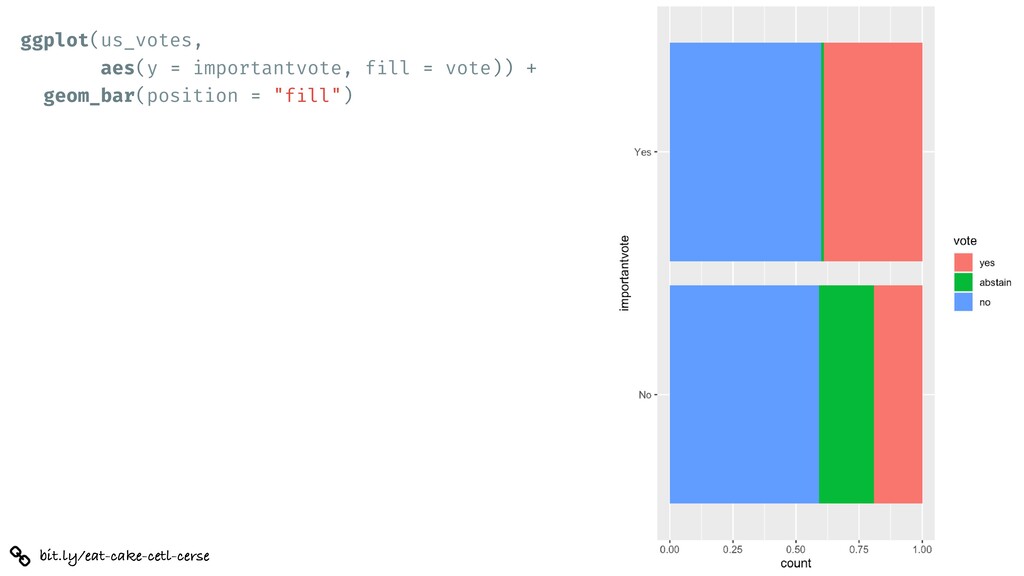
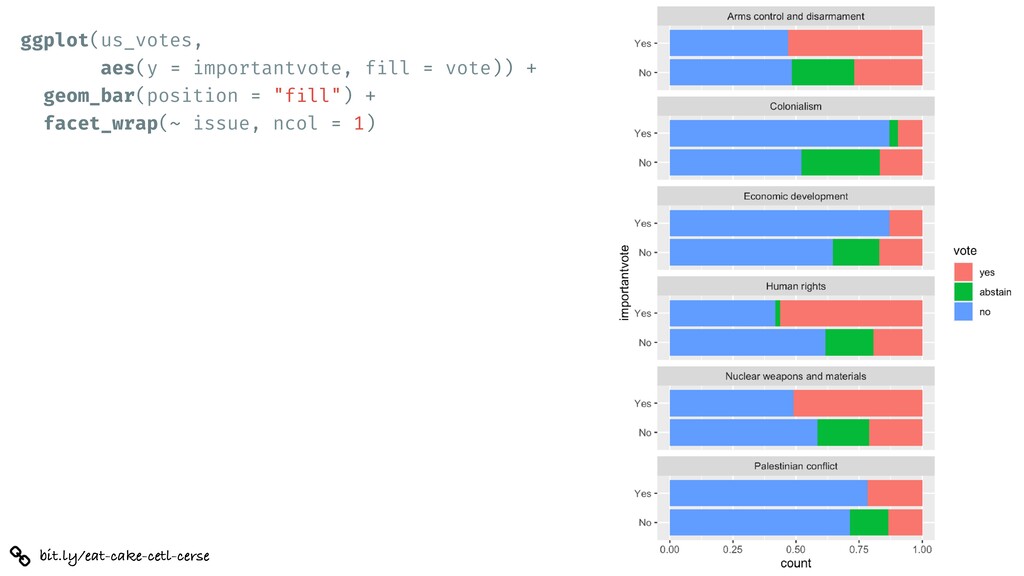
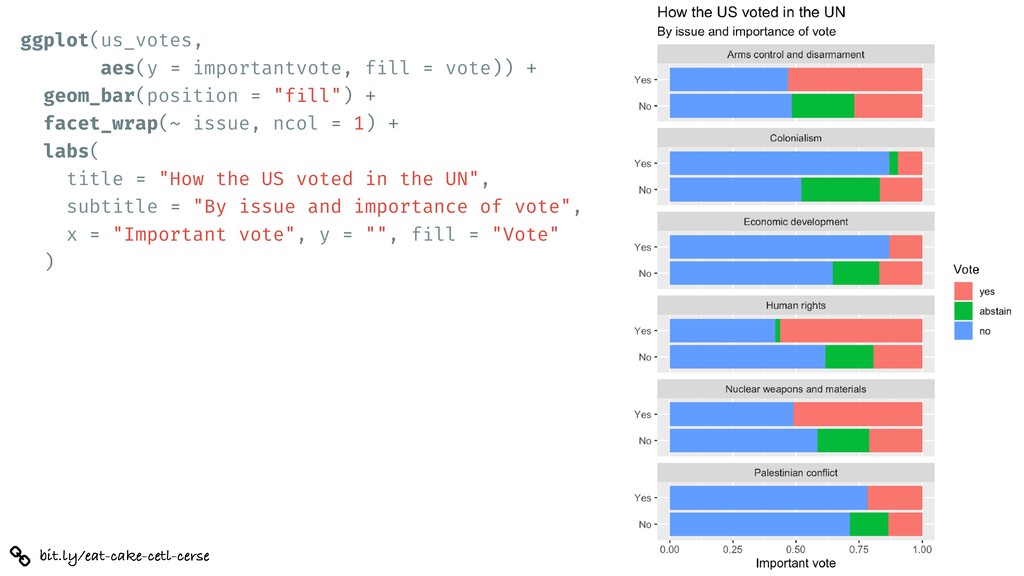
= "fill") + facet_wrap(~ issue, ncol = 1) + labs( title = "How the US voted in the UN", subtitle = "By issue and importance of vote", x = "Important vote", y = "", fill = "Vote" )
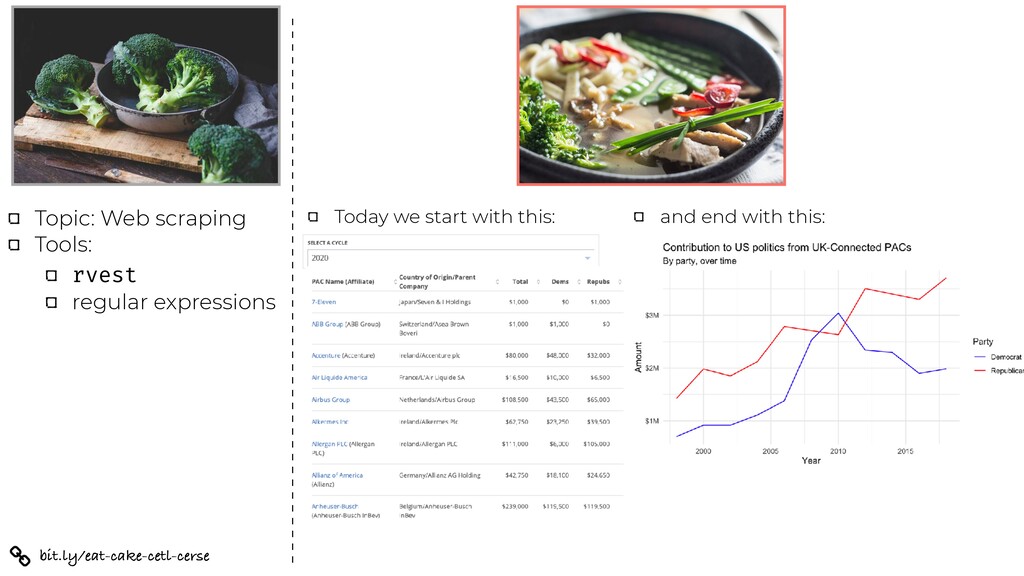
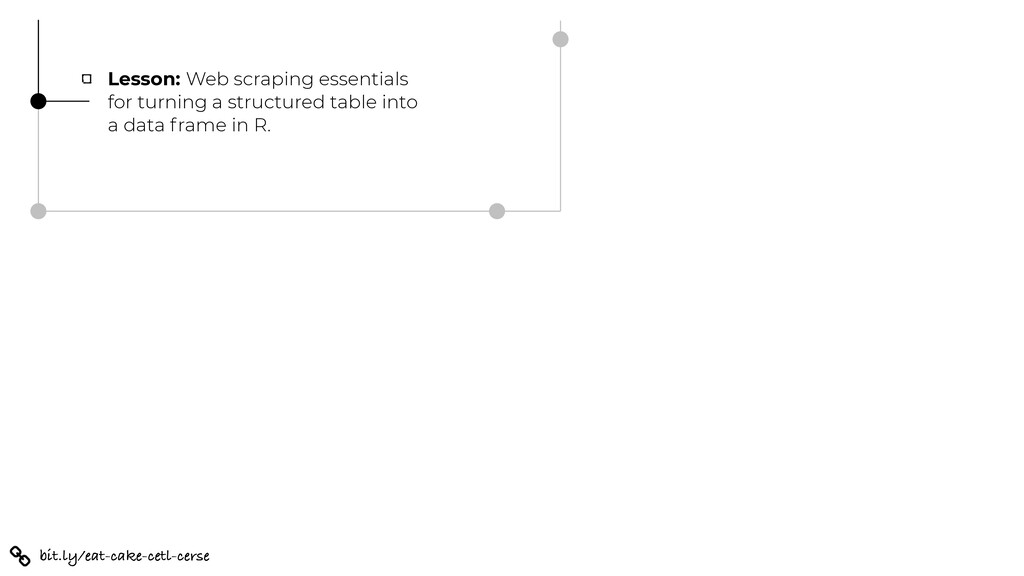
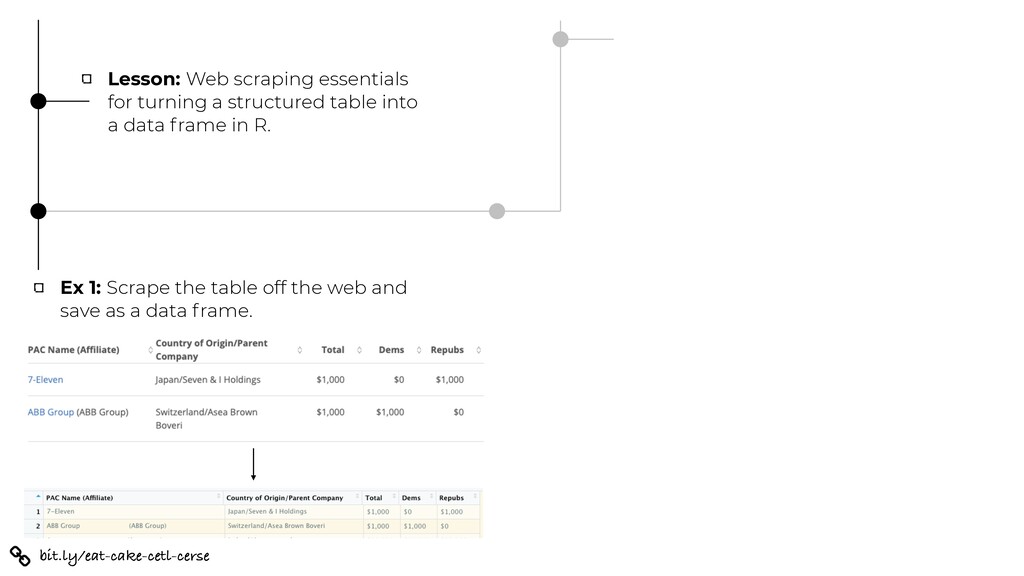
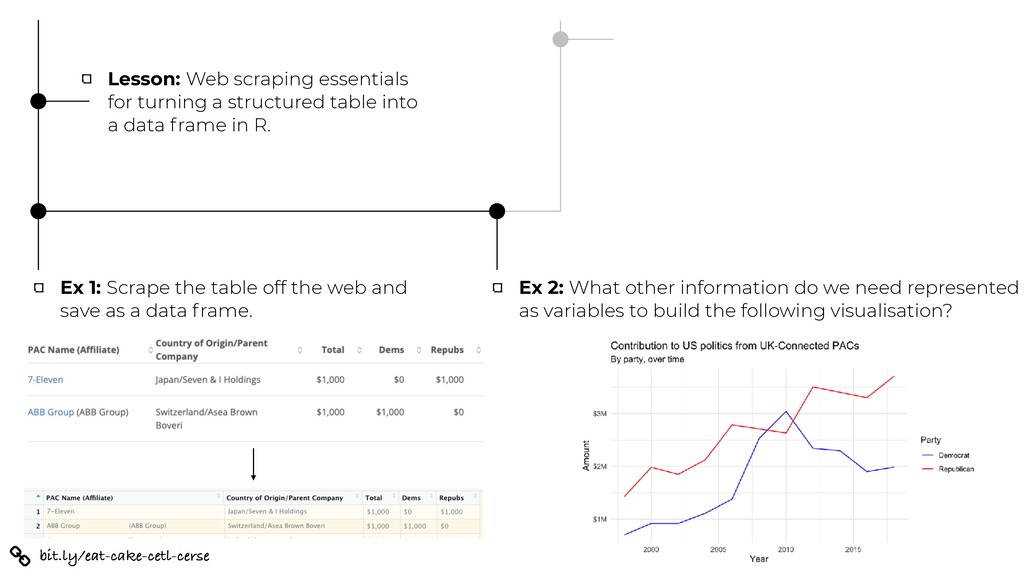
into a data frame in R. Ex 1: Scrape the table off the web and save as a data frame. Ex 2: What other information do we need represented as variables to build the following visualisation?
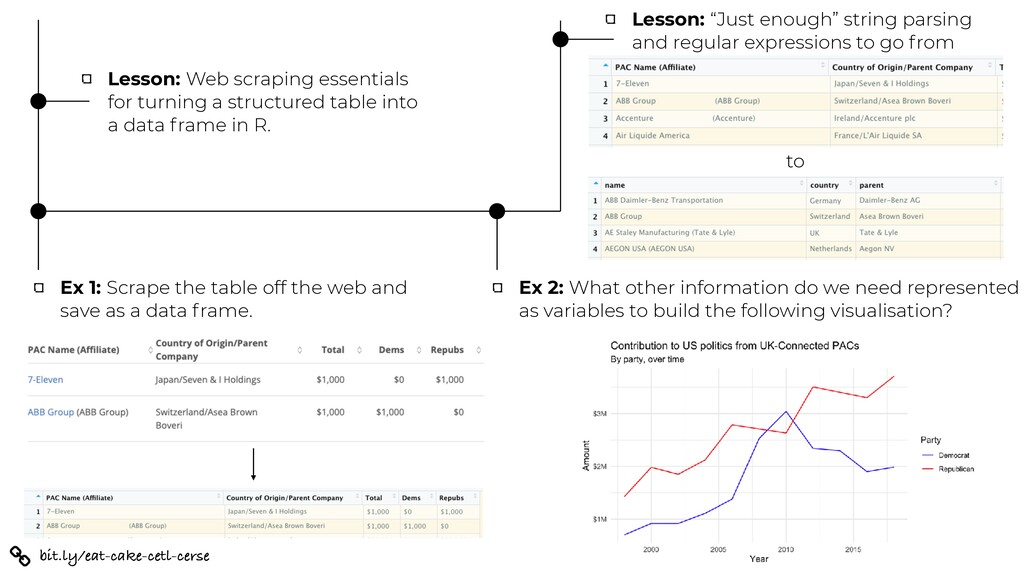
into a data frame in R. Ex 1: Scrape the table off the web and save as a data frame. Lesson: “Just enough” string parsing and regular expressions to go from Ex 2: What other information do we need represented as variables to build the following visualisation? to
![bit.ly/eat-cake-cetl-cerse Let them eat cake (first)! mine-cetinkaya-rundel [email protected] @minebocek bit.ly/eat-cake-cetl-cerse](https://files.speakerdeck.com/presentations/4a04975e0de94155b6b9e653123c05dd/slide_0.jpg)
![bit.ly/eat-cake-cetl-cerse Let them eat cake (first)!* mine-cetinkaya-rundel [email protected] @minebocek *](https://files.speakerdeck.com/presentations/4a04975e0de94155b6b9e653123c05dd/slide_61.jpg)