Upgrade to Pro — share decks privately, control downloads, hide ads and more …

High_Performance_In-free_TCOs_EMRS2016.pdf

Avatar for Monica Morales Masis Monica Morales Masis
December 05, 2018
11

 High_Performance_In-free_TCOs_EMRS2016.pdf

Avatar for Monica Morales Masis

Monica Morales Masis

December 05, 2018

Transcript

  1. Advances in the Development of High Performance In-free TCOs M.

    Morales-Masis, , Q. Jeangros, E. Rucavado, F. Landucci, F. Dauzou, A. Dabirian, L. Fanni, A. Hessler- Wyser, C. Ballif E-MRS Spring meeting 2016 Lille, France
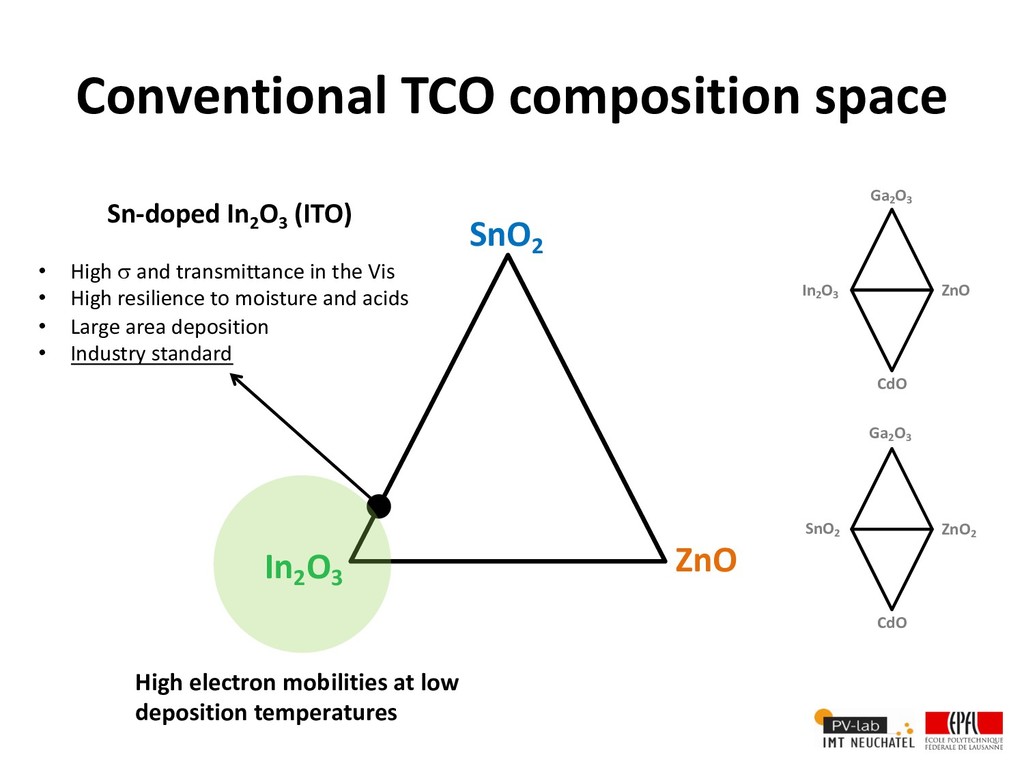
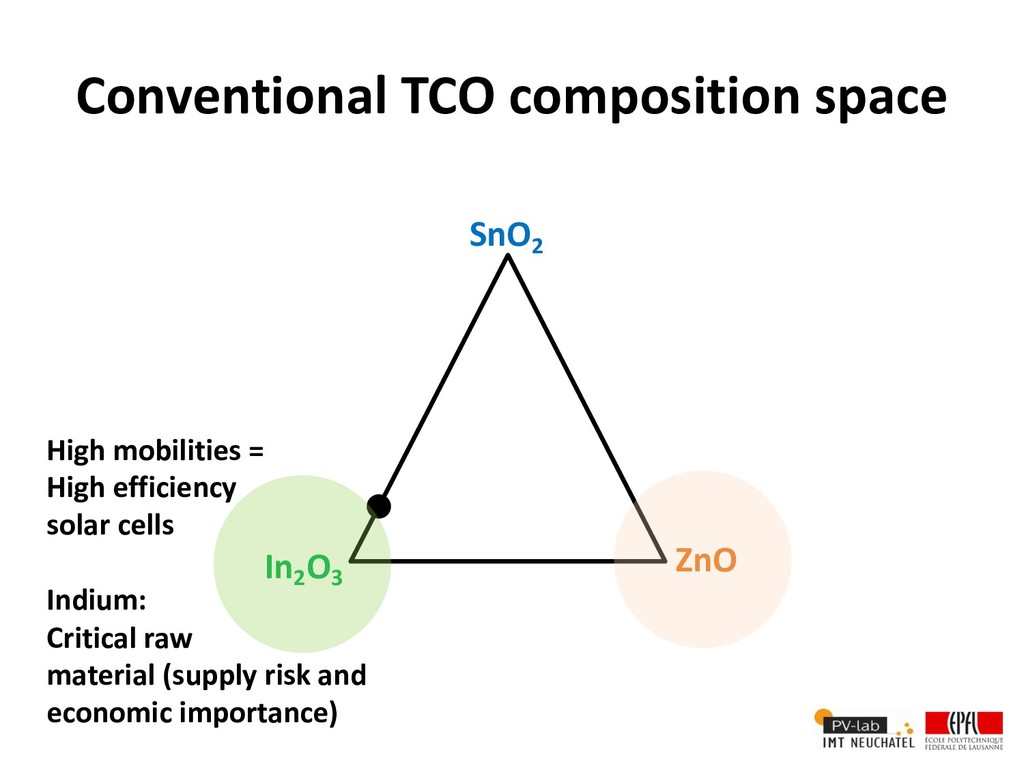
  2. Conventional TCO composition space SnO2 ZnO In2 O3 Sn-doped In

    2 O 3 (ITO) • High s and transmittance in the Vis • High resilience to moisture and acids • Large area deposition • Industry standard SnO2 Ga2 O3 ZnO In2 O3 Ga2 O3 ZnO2 CdO CdO High electron mobilities at low deposition temperatures
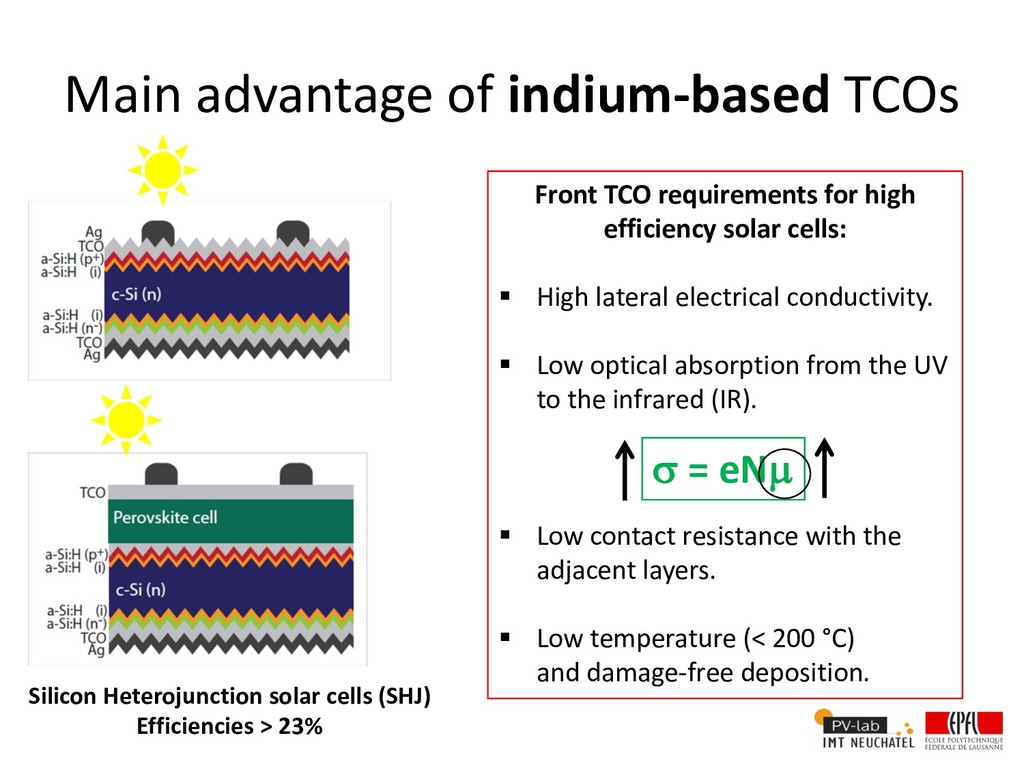
  3. Main advantage of indium-based TCOs Silicon Heterojunction solar cells (SHJ)

    Efficiencies > 23% Front TCO requirements for high efficiency solar cells: § High lateral electrical conductivity. § Low optical absorption from the UV to the infrared (IR). § Low contact resistance with the adjacent layers. § Low temperature (< 200 °C) and damage-free deposition. s = eNµ
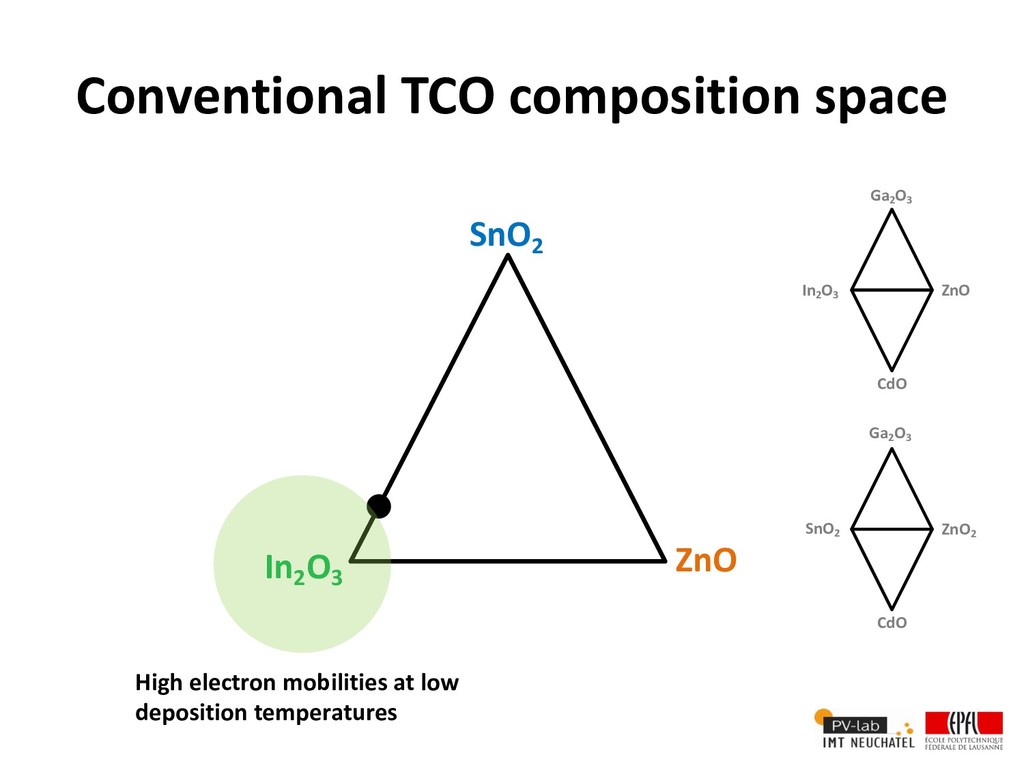
  4. Conventional TCO composition space SnO2 ZnO In2 O3 SnO2 Ga2

    O3 ZnO In2 O3 Ga2 O3 ZnO2 CdO CdO High electron mobilities at low deposition temperatures
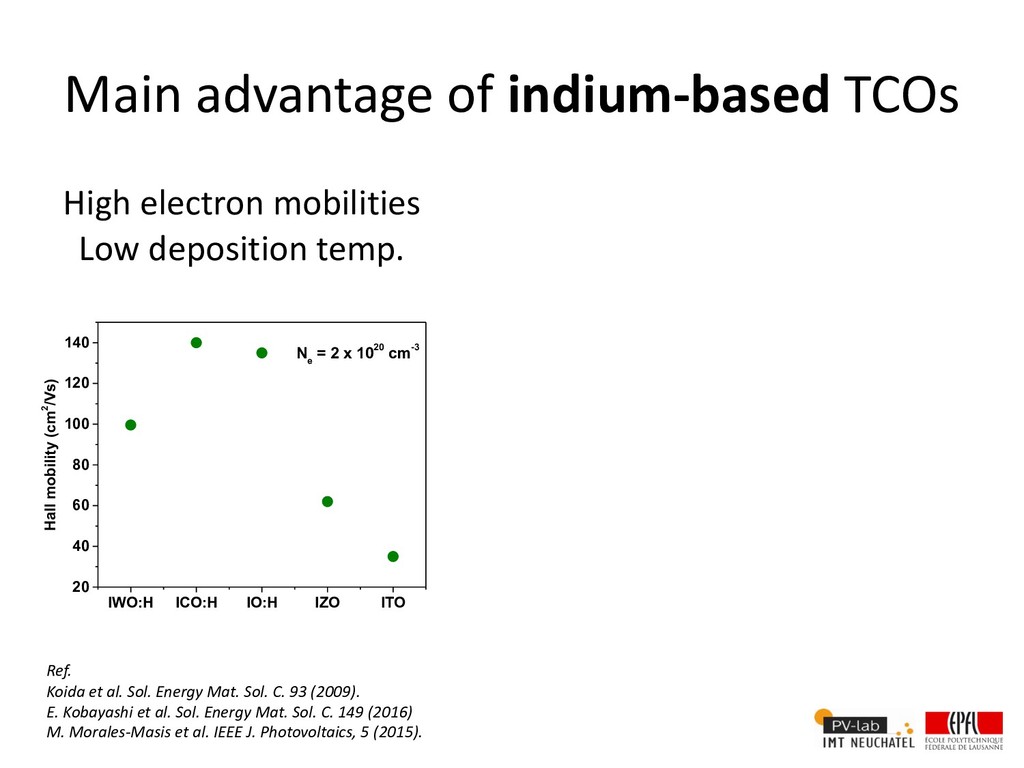
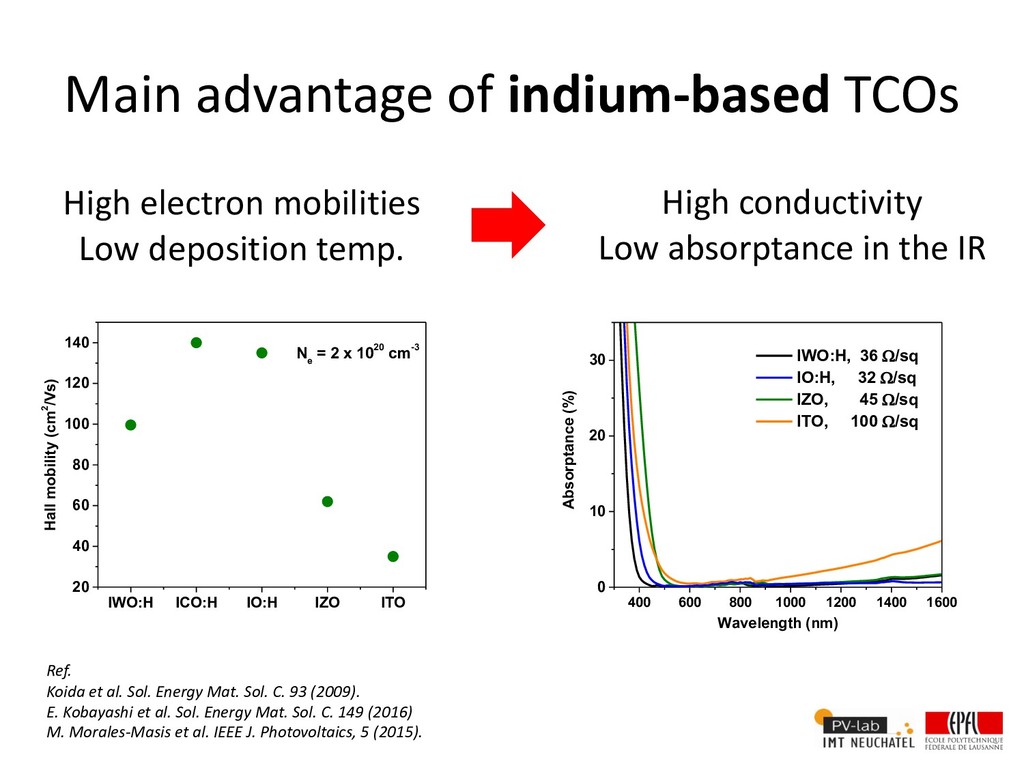
  5. Main advantage of indium-based TCOs High electron mobilities Low deposition

    temp. Ref. Koida et al. Sol. Energy Mat. Sol. C. 93 (2009). E. Kobayashi et al. Sol. Energy Mat. Sol. C. 149 (2016) M. Morales-Masis et al. IEEE J. Photovoltaics, 5 (2015). IWO:H ICO:H IO:H IZO ITO 20 40 60 80 100 120 140 N e = 2 x 1020 cm-3 Hall mobility (cm2/Vs)
  6. Main advantage of indium-based TCOs High electron mobilities Low deposition

    temp. High conductivity Low absorptance in the IR Ref. Koida et al. Sol. Energy Mat. Sol. C. 93 (2009). E. Kobayashi et al. Sol. Energy Mat. Sol. C. 149 (2016) M. Morales-Masis et al. IEEE J. Photovoltaics, 5 (2015). IWO:H ICO:H IO:H IZO ITO 20 40 60 80 100 120 140 N e = 2 x 1020 cm-3 Hall mobility (cm2/Vs) 400 600 800 1000 1200 1400 1600 0 10 20 30 Absorptance (%) Wavelength (nm) IWO:H, 36 W/sq IO:H, 32 W/sq IZO, 45 W/sq ITO, 100 W/sq
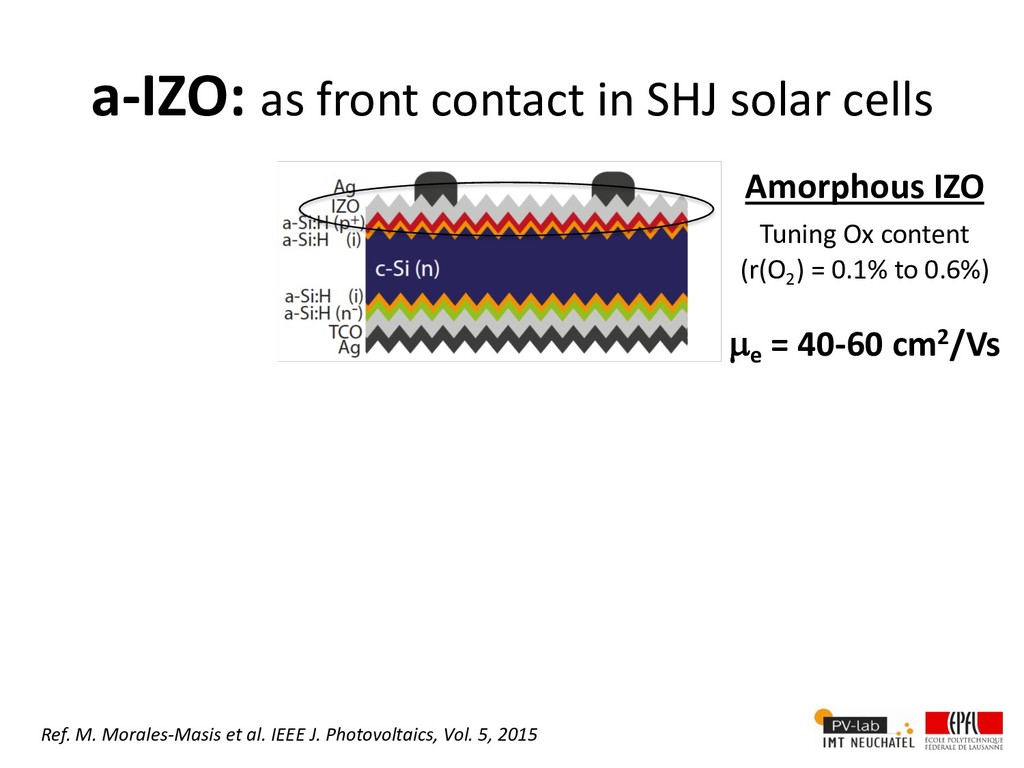
  7. a-IZO: as front contact in SHJ solar cells Ref. M.

    Morales-Masis et al. IEEE J. Photovoltaics, Vol. 5, 2015 Amorphous IZO Tuning Ox content (r(O 2 ) = 0.1% to 0.6%) µ e = 40-60 cm2/Vs
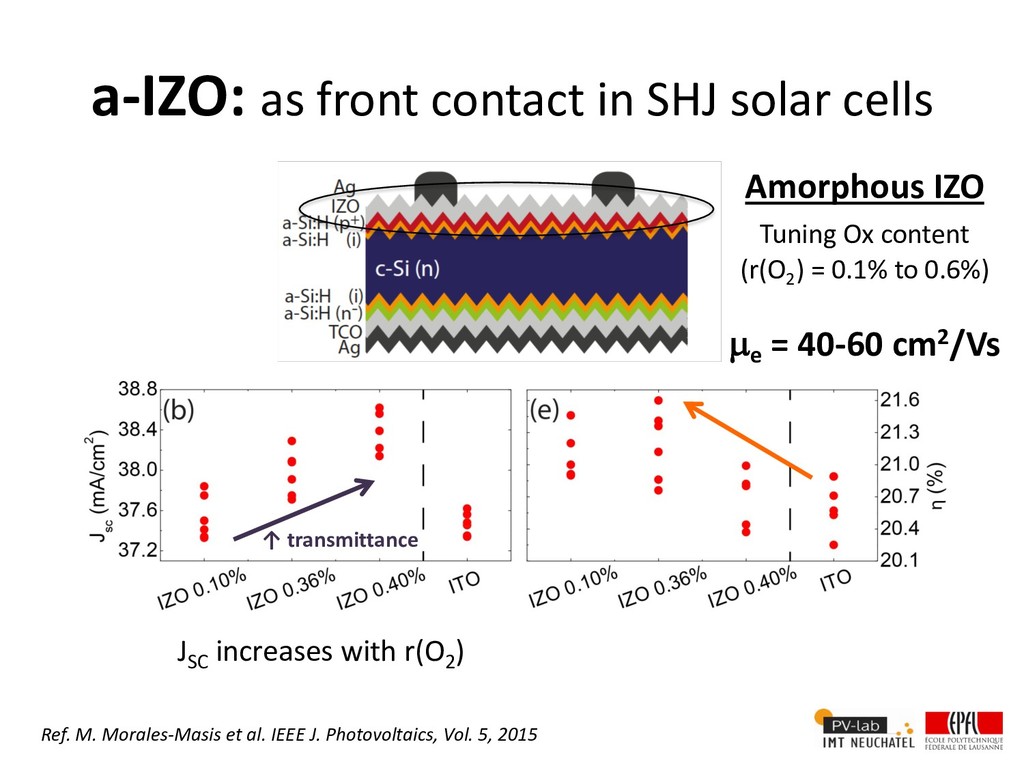
  8. a-IZO: as front contact in SHJ solar cells Ref. M.

    Morales-Masis et al. IEEE J. Photovoltaics, Vol. 5, 2015 Amorphous IZO Tuning Ox content (r(O 2 ) = 0.1% to 0.6%) µ e = 40-60 cm2/Vs ↑ transmittance JSC increases with r(O2 )
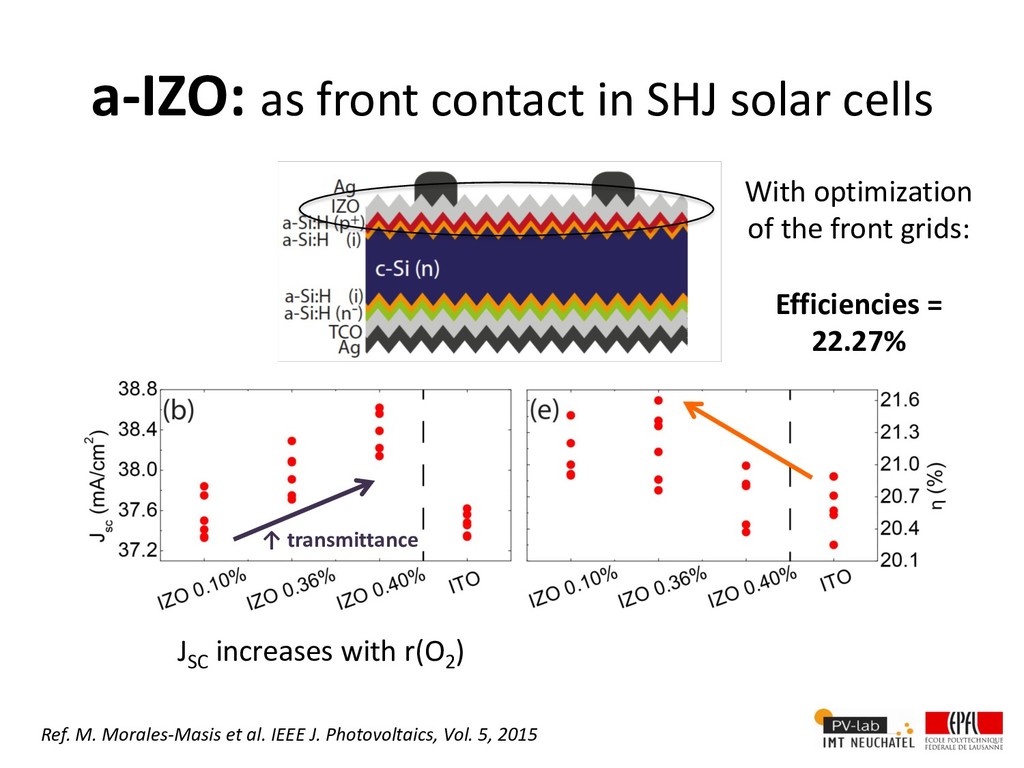
  9. a-IZO: as front contact in SHJ solar cells Ref. M.

    Morales-Masis et al. IEEE J. Photovoltaics, Vol. 5, 2015 ↑ transmittance JSC increases with r(O2 ) With optimization of the front grids: Efficiencies = 22.27%
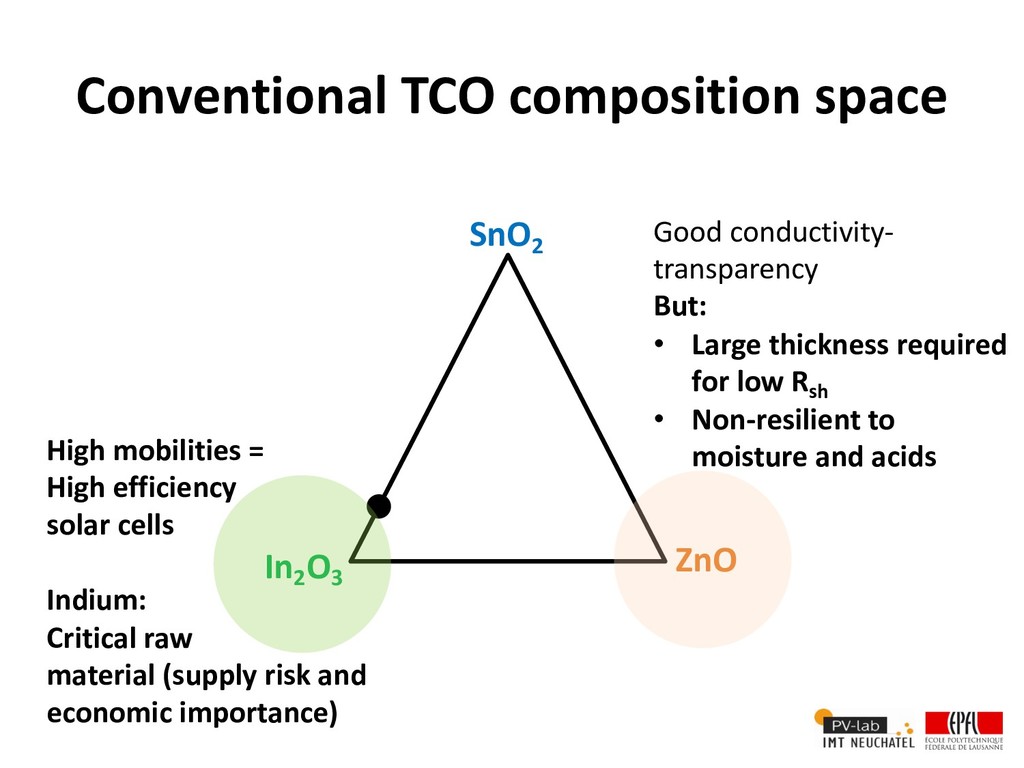
  10. Conventional TCO composition space SnO2 ZnO In2 O3 High mobilities

    = High efficiency solar cells Indium: Critical raw material (supply risk and economic importance)
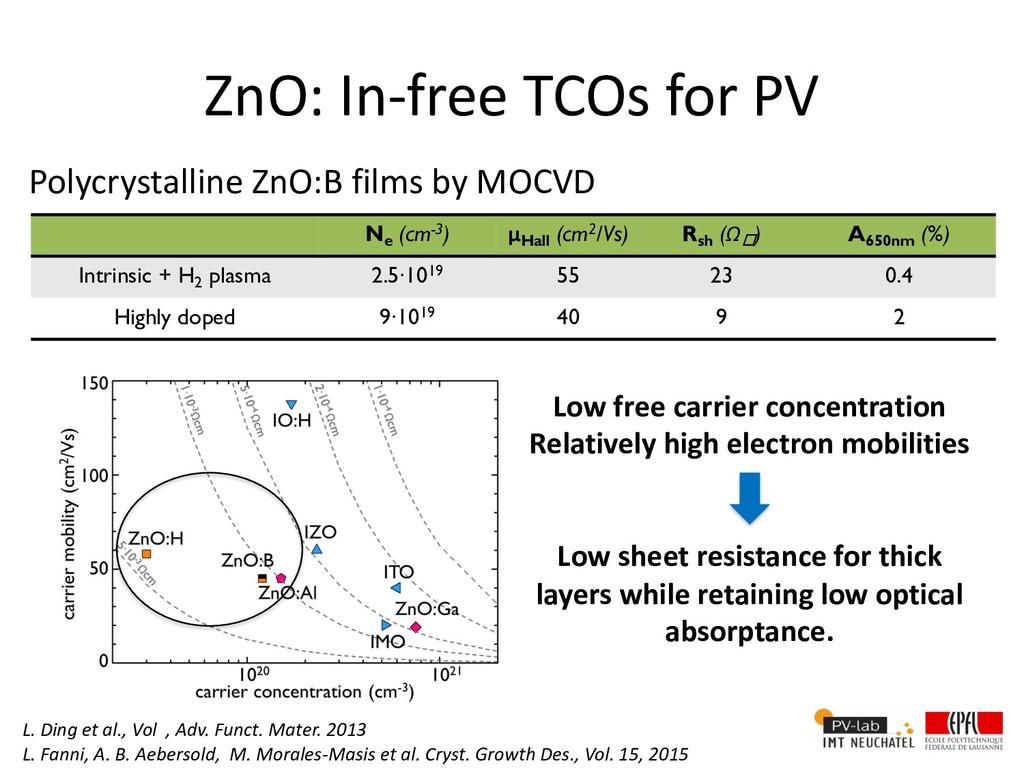
  11. ZnO: In-free TCOs for PV Polycrystalline ZnO:B films by MOCVD

    Ne (cm-3) μ Hall (cm2/Vs) Rsh (Ωo ) A650nm (%) Intrinsic + H2 plasma 2.5·1019 55 23 0.4 Highly doped 9·1019 40 9 2 Low free carrier concentration Relatively high electron mobilities Low sheet resistance for thick layers while retaining low optical absorptance. L. Ding et al., Vol , Adv. Funct. Mater. 2013 L. Fanni, A. B. Aebersold, M. Morales-Masis et al. Cryst. Growth Des., Vol. 15, 2015
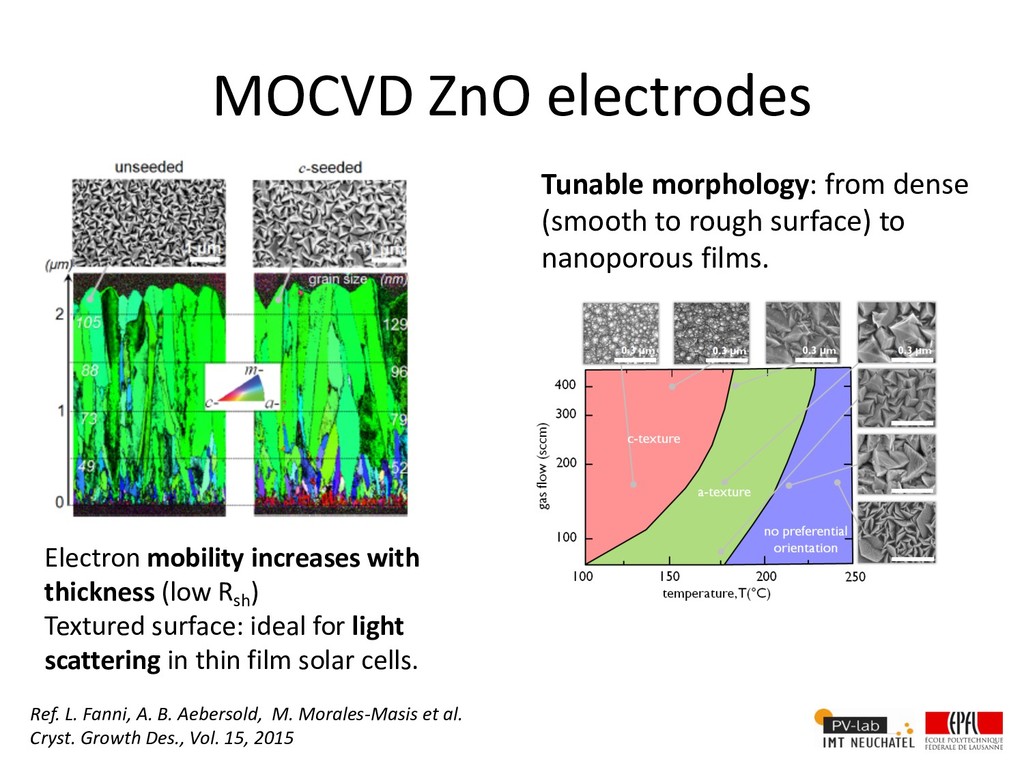
  12. MOCVD ZnO electrodes Electron mobility increases with thickness (low R

    sh ) Textured surface: ideal for light scattering in thin film solar cells. Tunable morphology: from dense (smooth to rough surface) to nanoporous films. Ref. L. Fanni, A. B. Aebersold, M. Morales-Masis et al. Cryst. Growth Des., Vol. 15, 2015
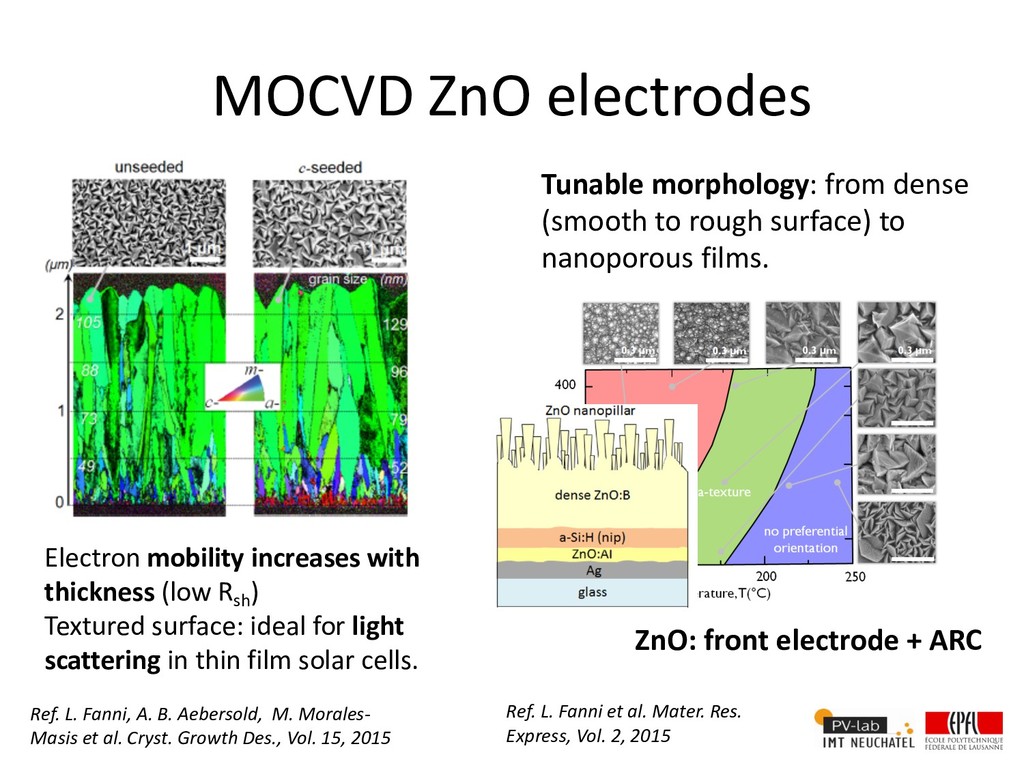
  13. MOCVD ZnO electrodes Electron mobility increases with thickness (low R

    sh ) Textured surface: ideal for light scattering in thin film solar cells. Tunable morphology: from dense (smooth to rough surface) to nanoporous films. Ref. L. Fanni, A. B. Aebersold, M. Morales- Masis et al. Cryst. Growth Des., Vol. 15, 2015 ZnO: front electrode + ARC Ref. L. Fanni et al. Mater. Res. Express, Vol. 2, 2015
  14. Conventional TCO composition space SnO2 ZnO In2 O3 High mobilities

    = High efficiency solar cells Indium: Critical raw material (supply risk and economic importance) Good conductivity- transparency But: • Large thickness required for low Rsh • Non-resilient to moisture and acids
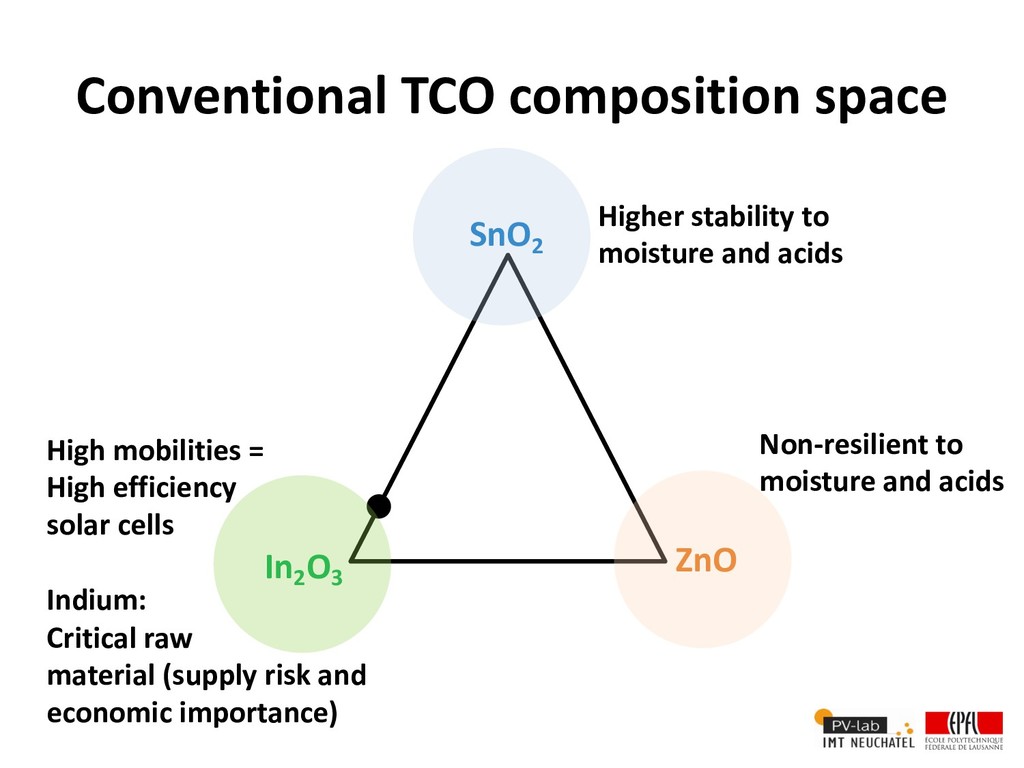
  15. Conventional TCO composition space SnO2 ZnO In2 O3 High mobilities

    = High efficiency solar cells Indium: Critical raw material (supply risk and economic importance) Non-resilient to moisture and acids Higher stability to moisture and acids
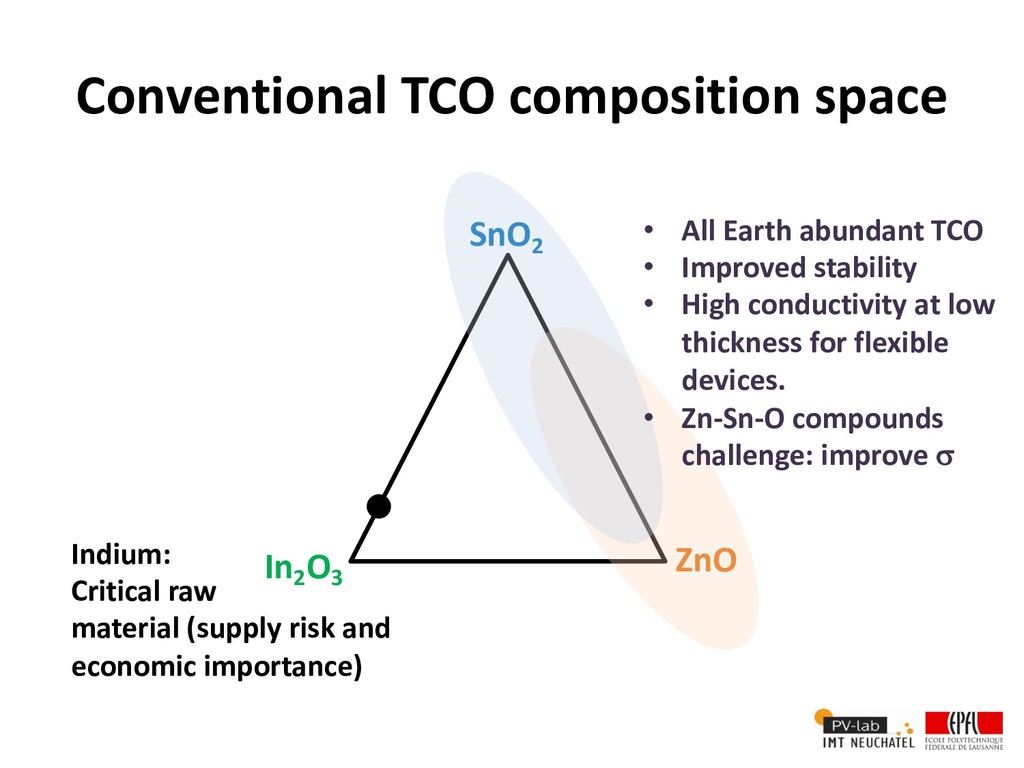
  16. Conventional TCO composition space SnO2 ZnO In2 O3 Indium: Critical

    raw material (supply risk and economic importance) • All Earth abundant TCO • Improved stability • High conductivity at low thickness for flexible devices. • Zn-Sn-O compounds challenge: improve s
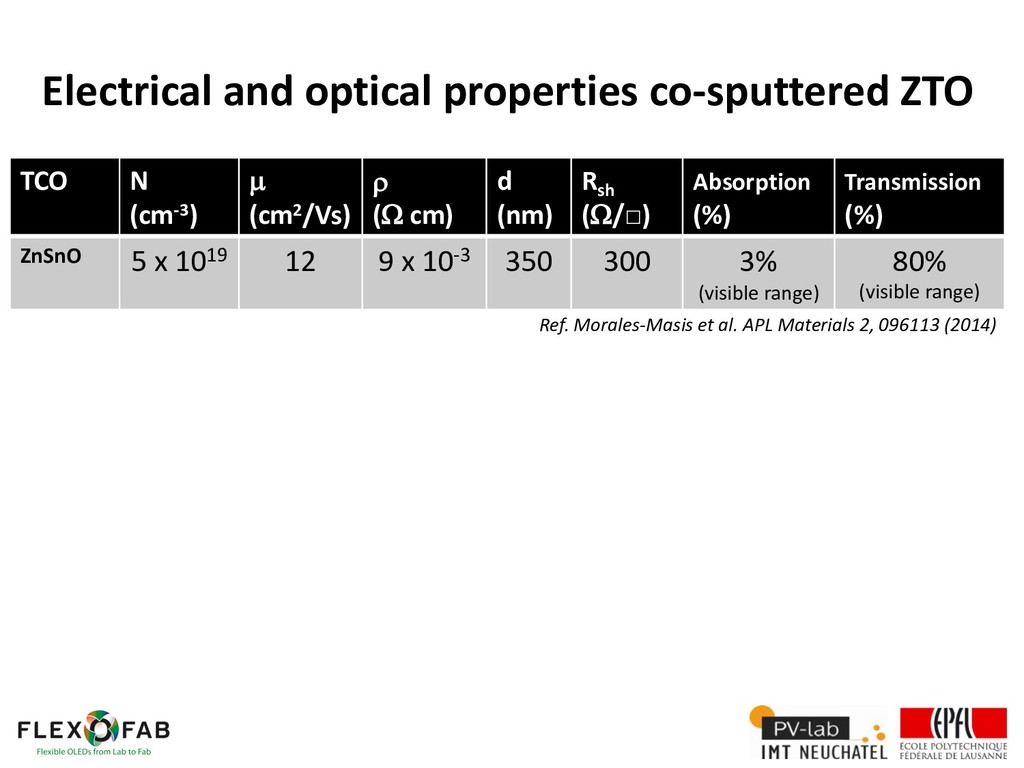
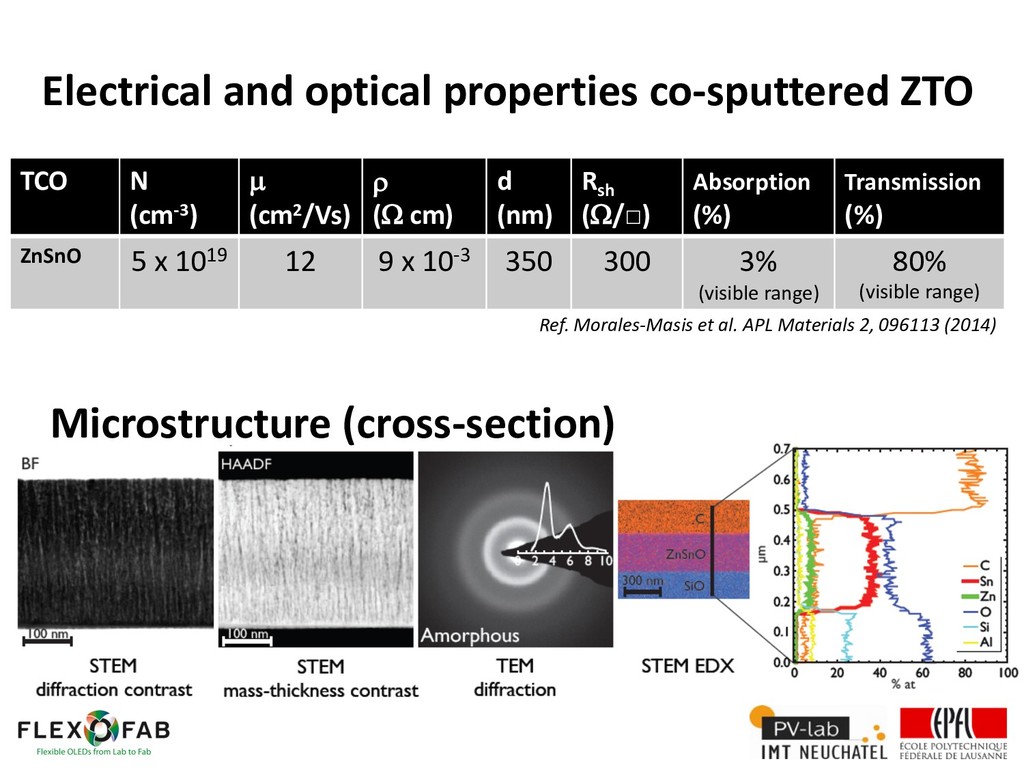
  17. TCO N (cm-3) µ (cm2/Vs) r (W cm) d (nm)

    R sh (W/□) Absorption (%) Transmission (%) ZnSnO 5 x 10¹⁹ 12 9 x 10⁻³ 350 300 3% (visible range) 80% (visible range) Electrical and optical properties co-sputtered ZTO Ref. Morales-Masis et al. APL Materials 2, 096113 (2014)
  18. TCO N (cm-3) µ (cm2/Vs) r (W cm) d (nm)

    R sh (W/□) Absorption (%) Transmission (%) ZnSnO 5 x 10¹⁹ 12 9 x 10⁻³ 350 300 3% (visible range) 80% (visible range) Electrical and optical properties co-sputtered ZTO Microstructure (cross-section) Microstructure (cross-section) Ref. Morales-Masis et al. APL Materials 2, 096113 (2014)
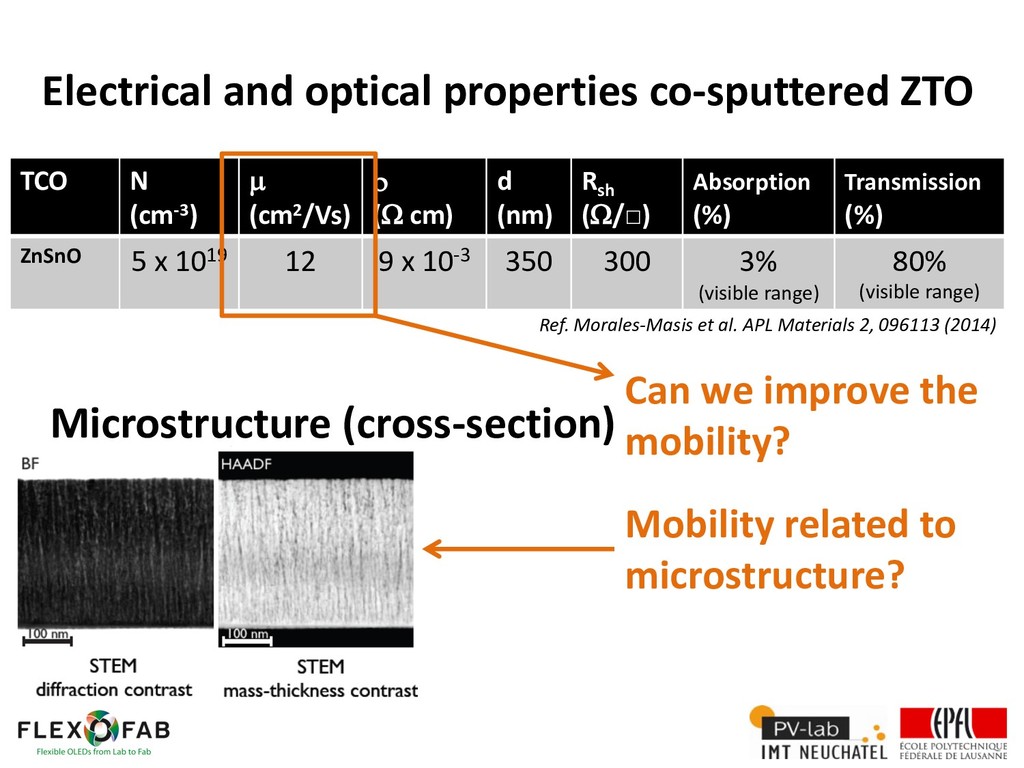
  19. Electrical and optical properties co-sputtered ZTO TCO N (cm-3) µ

    (cm2/Vs) r (W cm) d (nm) Rsh (W/□) Absorption (%) Transmission (%) ZnSnO 5 x 10¹⁹ 12 9 x 10⁻³ 350 300 3% (visible range) 80% (visible range) Can we improve the mobility? Mobility related to microstructure? Ref. Morales-Masis et al. APL Materials 2, 096113 (2014) Microstructure (cross-section)
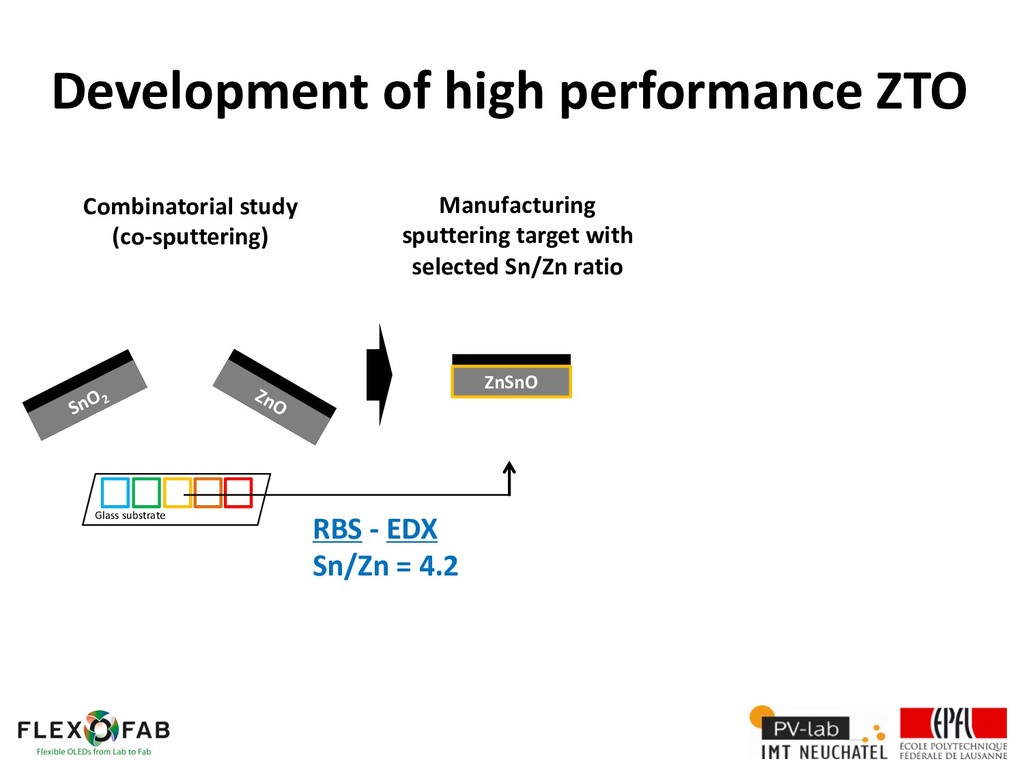
  20. Optimization of sputtering parameters ZnSnO Glass substrate Power density Partial

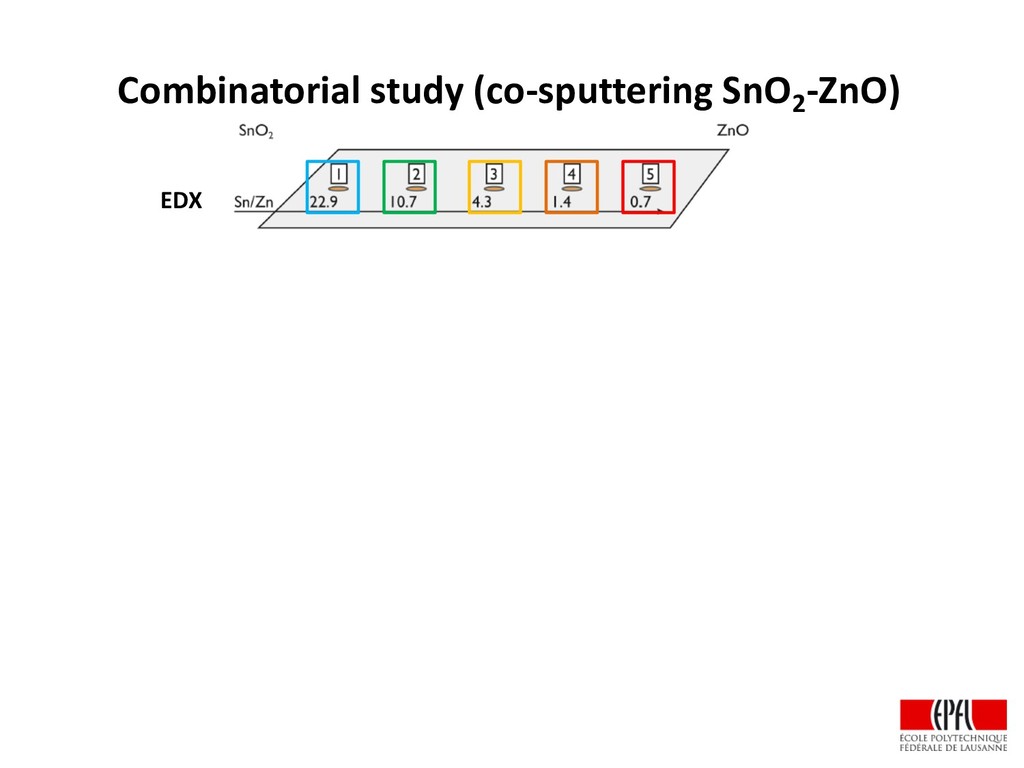
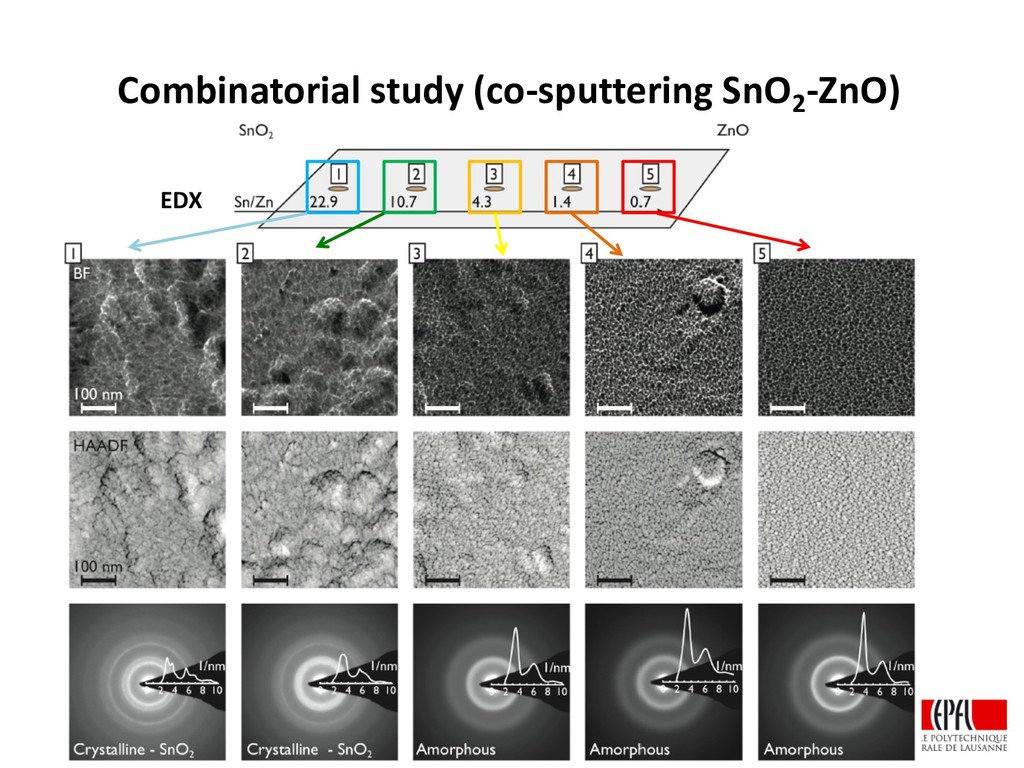
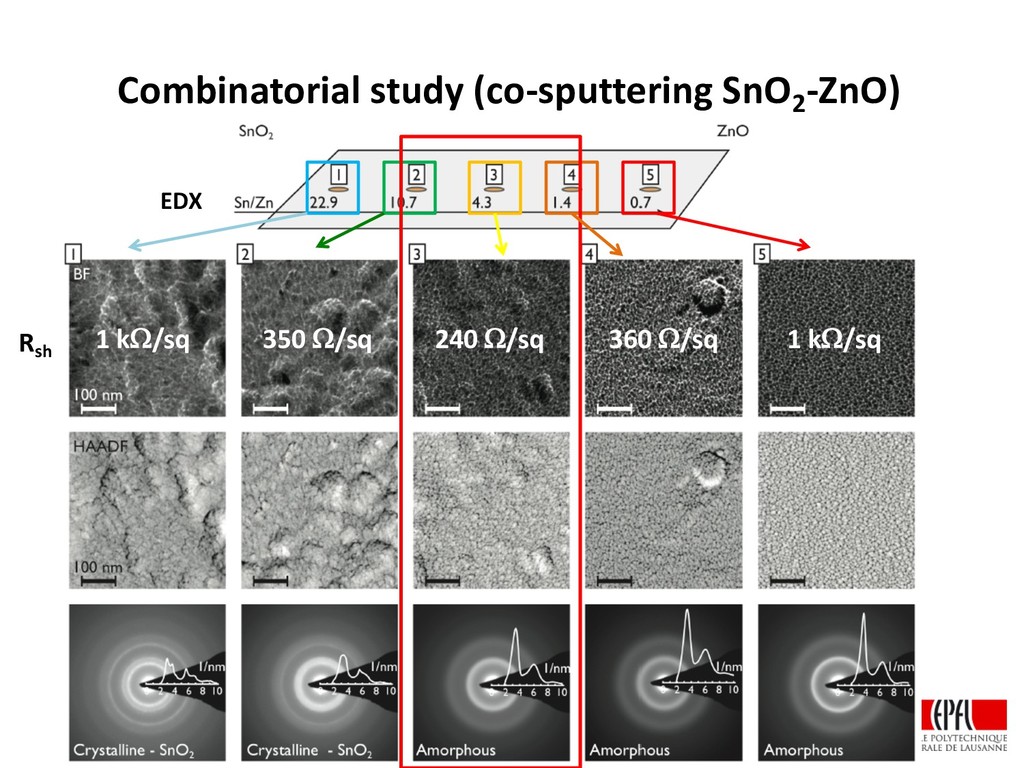
    pressure Oxygen flow Development of high performance ZTO SnO2 ZnO Glass substrate Manufacturing sputtering target with selected Sn/Zn ratio ZnSnO Combinatorial study (co-sputtering) RBS - EDX Sn/Zn = 4.2
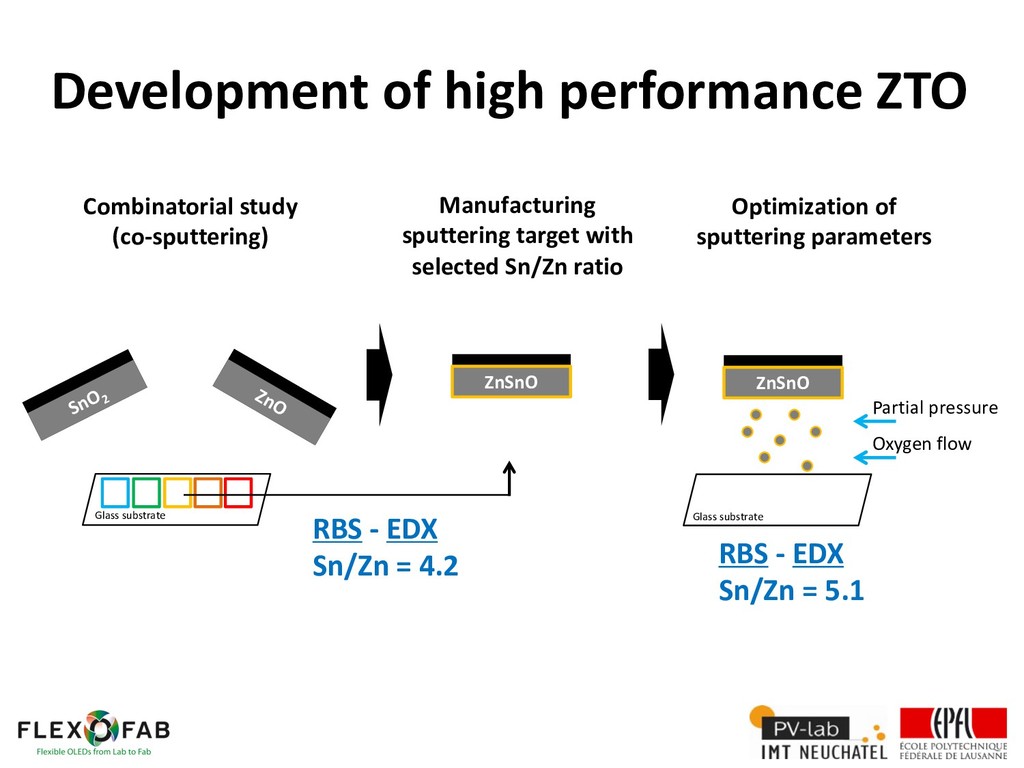
  21. Combinatorial study (co-sputtering) Manufacturing sputtering target with selected Sn/Zn ratio

    Optimization of sputtering parameters ZnSnO SnO2 ZnO Glass substrate RBS - EDX Sn/Zn = 4.2 ZnSnO Glass substrate Partial pressure Oxygen flow RBS - EDX Sn/Zn = 5.1 Development of high performance ZTO
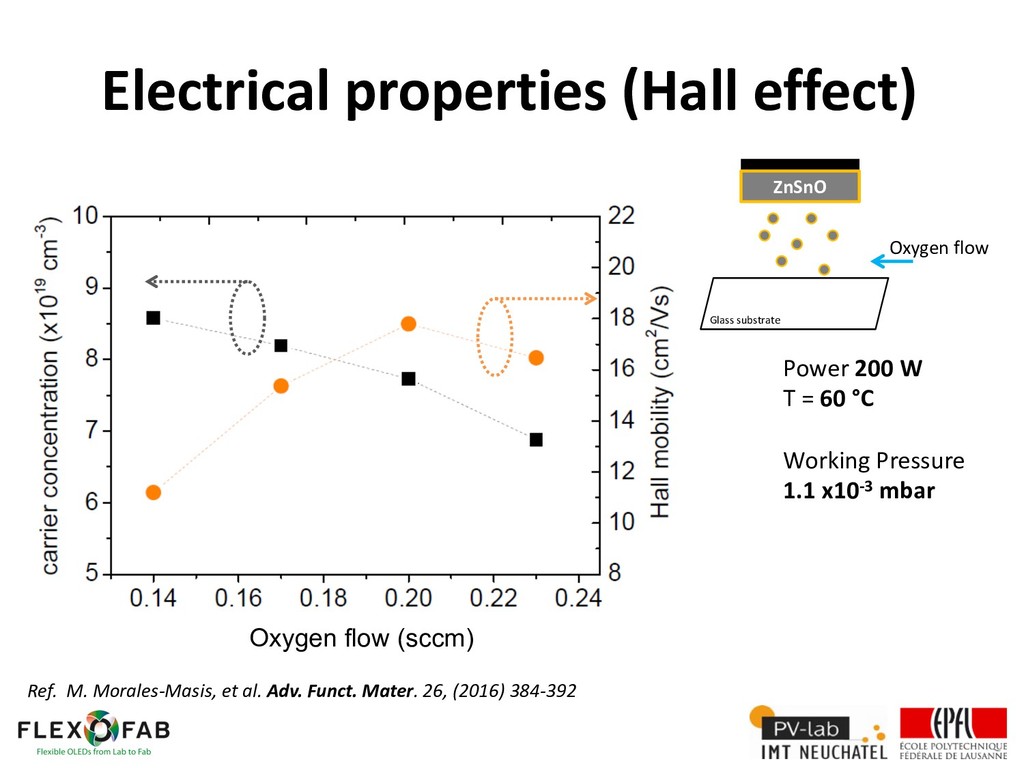
  22. ZnSnO Glass substrate Oxygen flow Power 200 W T =

    60 °C Working Pressure 1.1 x10⁻³ mbar Oxygen flow (sccm) Electrical properties (Hall effect) Ref. M. Morales-Masis, et al. Adv. Funct. Mater. 26, (2016) 384-392
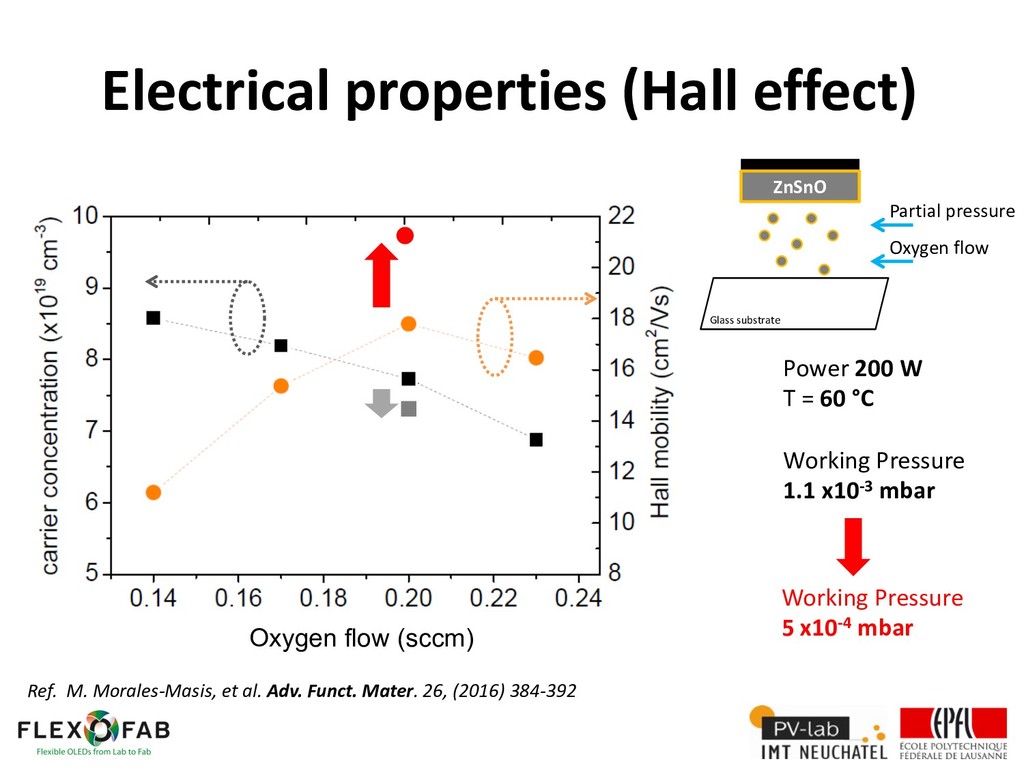
  23. ZnSnO Glass substrate Partial pressure Oxygen flow Power 200 W

    T = 60 °C Working Pressure 1.1 x10⁻³ mbar Working Pressure 5 x10⁻⁴ mbar Oxygen flow (sccm) Electrical properties (Hall effect) Ref. M. Morales-Masis, et al. Adv. Funct. Mater. 26, (2016) 384-392
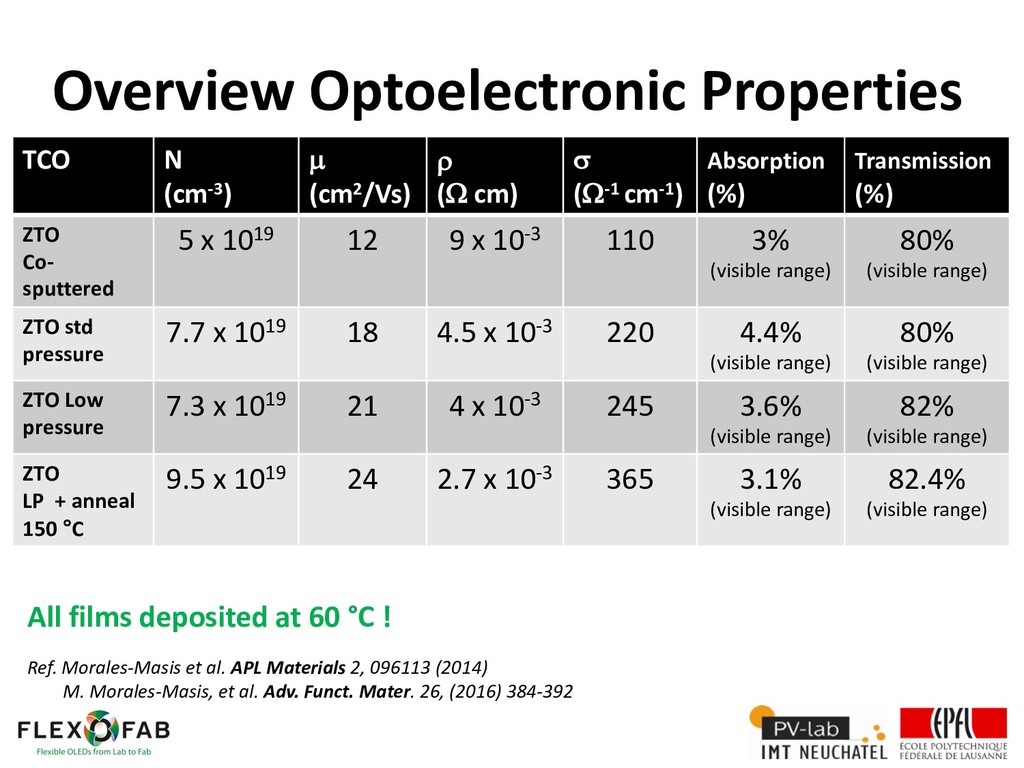
  24. TCO N (cm-3) µ (cm2/Vs) r (W cm) s (W-1

    cm-1) Absorption (%) Transmission (%) ZTO Co- sputtered 5 x 10¹⁹ 12 9 x 10⁻³ 110 3% (visible range) 80% (visible range) ZTO std pressure 7.7 x 10¹⁹ 18 4.5 x 10⁻³ 220 4.4% (visible range) 80% (visible range) ZTO Low pressure 7.3 x 10¹⁹ 21 4 x 10⁻³ 245 3.6% (visible range) 82% (visible range) ZTO LP + anneal 150 °C 9.5 x 10¹⁹ 24 2.7 x 10⁻³ 365 3.1% (visible range) 82.4% (visible range) Overview Optoelectronic Properties All films deposited at 60 °C ! Ref. Morales-Masis et al. APL Materials 2, 096113 (2014) M. Morales-Masis, et al. Adv. Funct. Mater. 26, (2016) 384-392
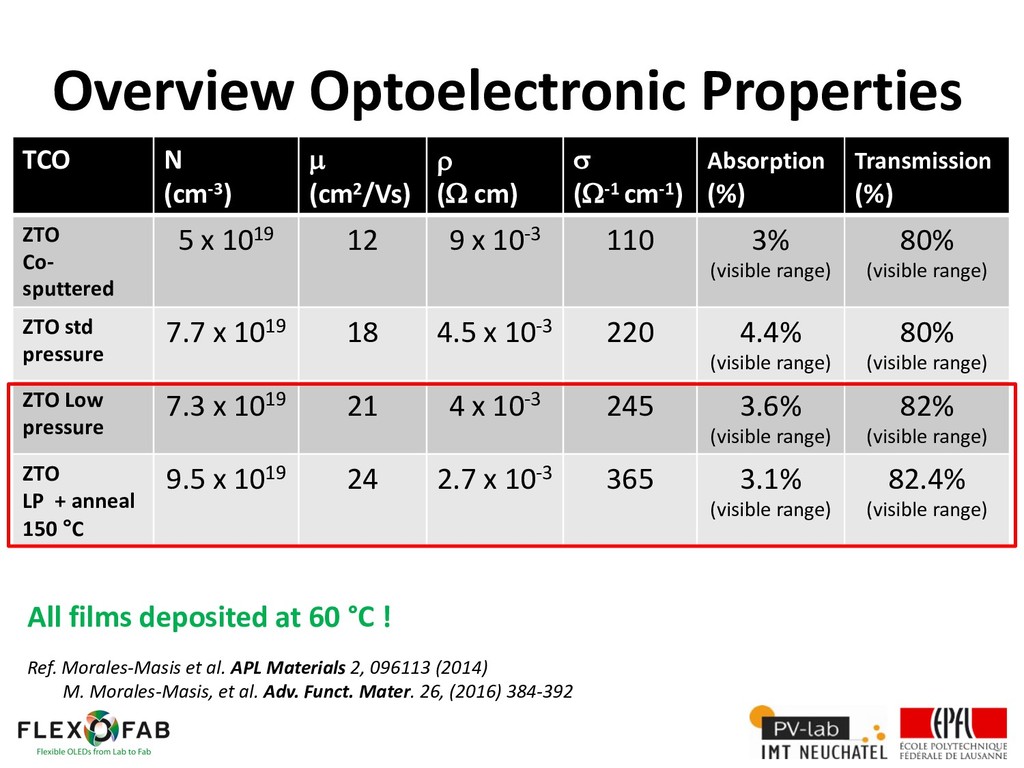
  25. TCO N (cm-3) µ (cm2/Vs) r (W cm) s (W-1

    cm-1) Absorption (%) Transmission (%) ZTO Co- sputtered 5 x 10¹⁹ 12 9 x 10⁻³ 110 3% (visible range) 80% (visible range) ZTO std pressure 7.7 x 10¹⁹ 18 4.5 x 10⁻³ 220 4.4% (visible range) 80% (visible range) ZTO Low pressure 7.3 x 10¹⁹ 21 4 x 10⁻³ 245 3.6% (visible range) 82% (visible range) ZTO LP + anneal 150 °C 9.5 x 10¹⁹ 24 2.7 x 10⁻³ 365 3.1% (visible range) 82.4% (visible range) Overview Optoelectronic Properties All films deposited at 60 °C ! Ref. Morales-Masis et al. APL Materials 2, 096113 (2014) M. Morales-Masis, et al. Adv. Funct. Mater. 26, (2016) 384-392
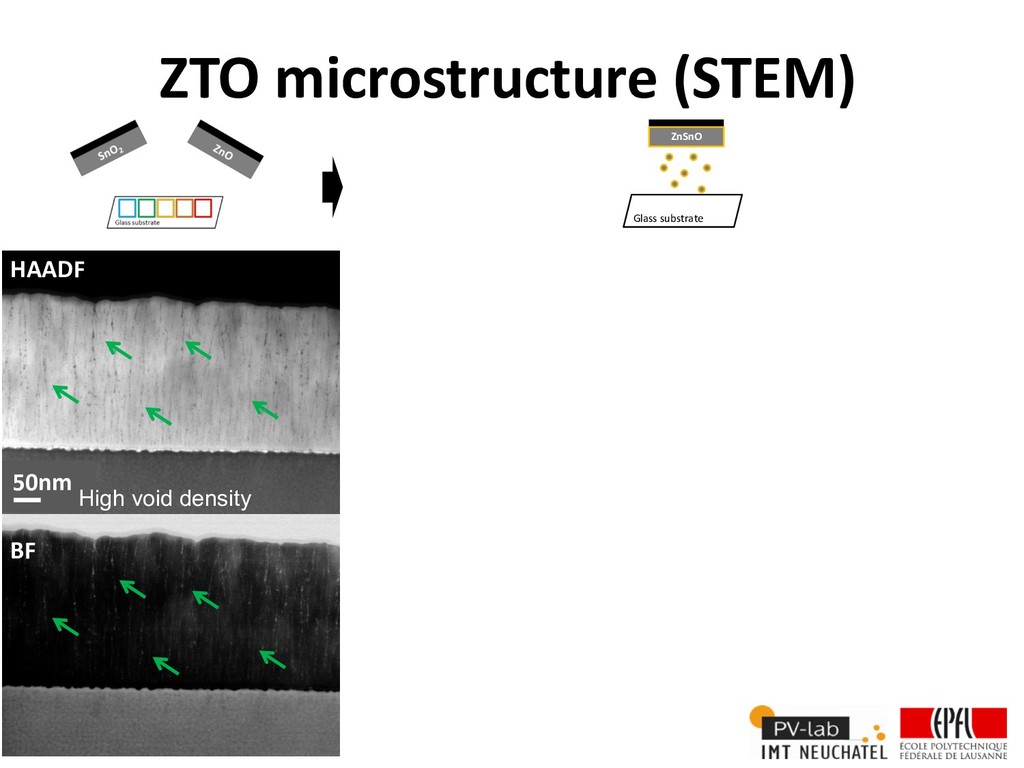
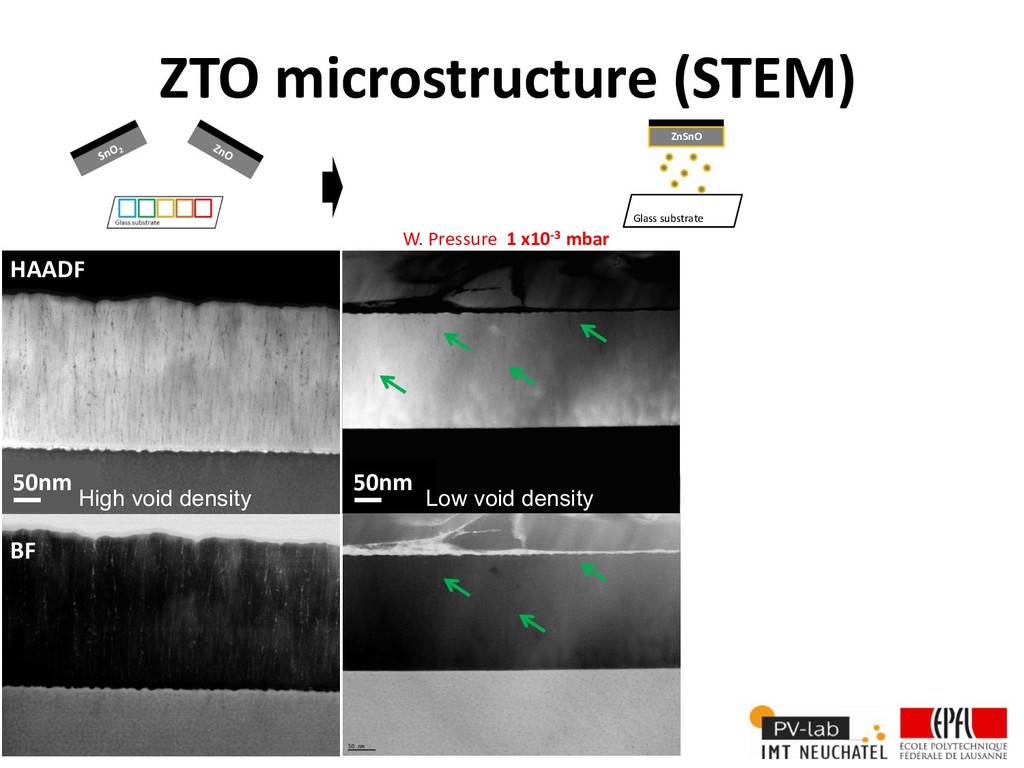
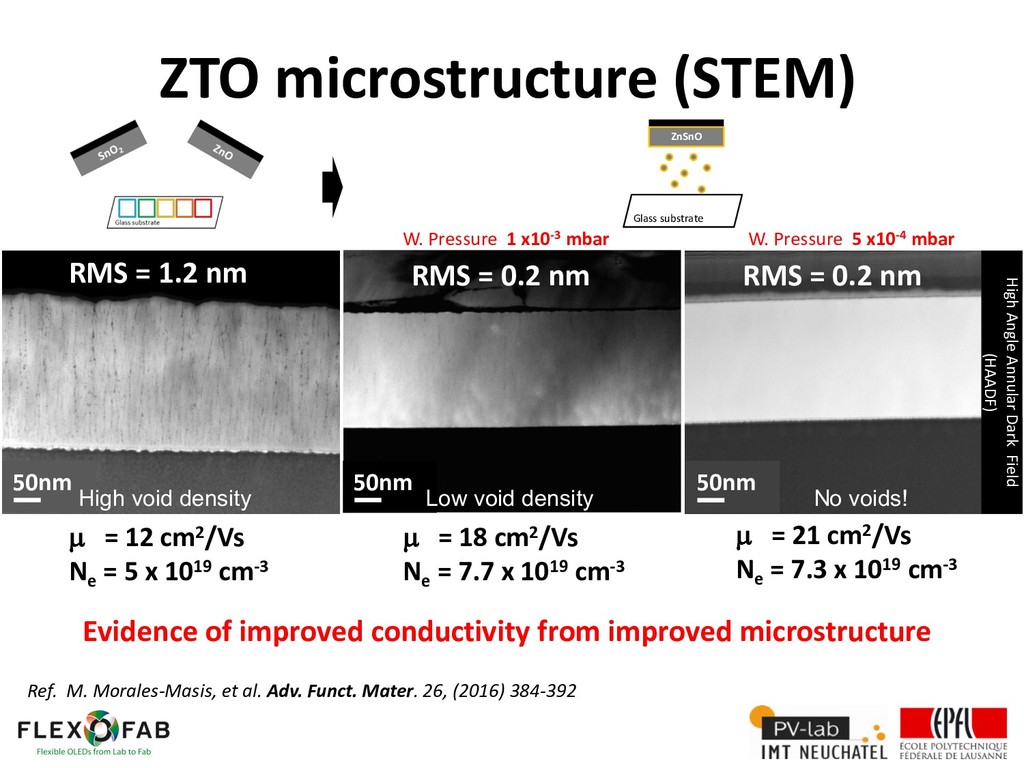
  26. ZTO microstructure (STEM) W. Pressure 1 x10⁻³ mbar HAADF BF

    No voids! ZnSnO Glass substrate 50nm Low void density 50nm High void density
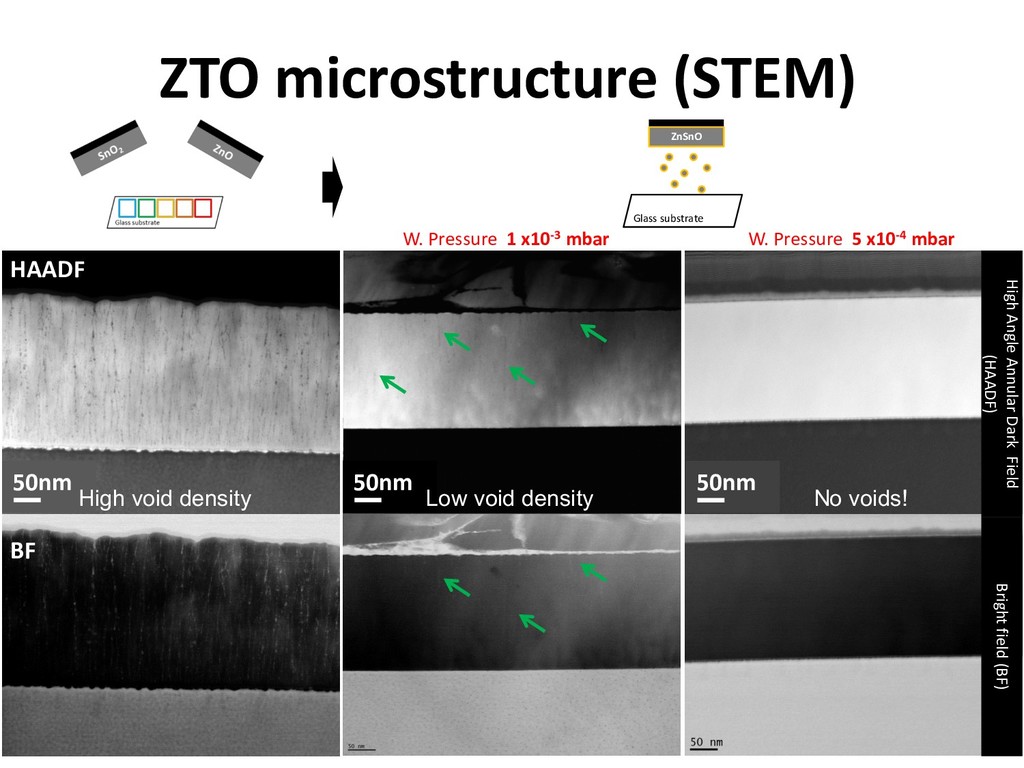
  27. ZTO microstructure (STEM) W. Pressure 1 x10⁻³ mbar W. Pressure

    5 x10⁻⁴ mbar HAADF BF Bright field (BF) High Angle Annular Dark Field (HAADF) No voids! ZnSnO Glass substrate 50nm 50nm Low void density 50nm High void density
  28. ZnSnO Glass substrate W. Pressure 1 x10⁻³ mbar W. Pressure

    5 x10⁻⁴ mbar ZTO microstructure (STEM) Low void density No voids! BF High Angle Annular Dark Field (HAADF) RMS = 1.2 nm RMS = 0.2 nm µ = 12 cm2/Vs Ne = 5 x 1019 cm-3 µ = 18 cm2/Vs Ne = 7.7 x 1019 cm-3 µ = 21 cm2/Vs Ne = 7.3 x 1019 cm-3 Evidence of improved conductivity from improved microstructure RMS = 0.2 nm RMS = 0.2 nm 50nm 50nm 50nm High void density Low void density Ref. M. Morales-Masis, et al. Adv. Funct. Mater. 26, (2016) 384-392
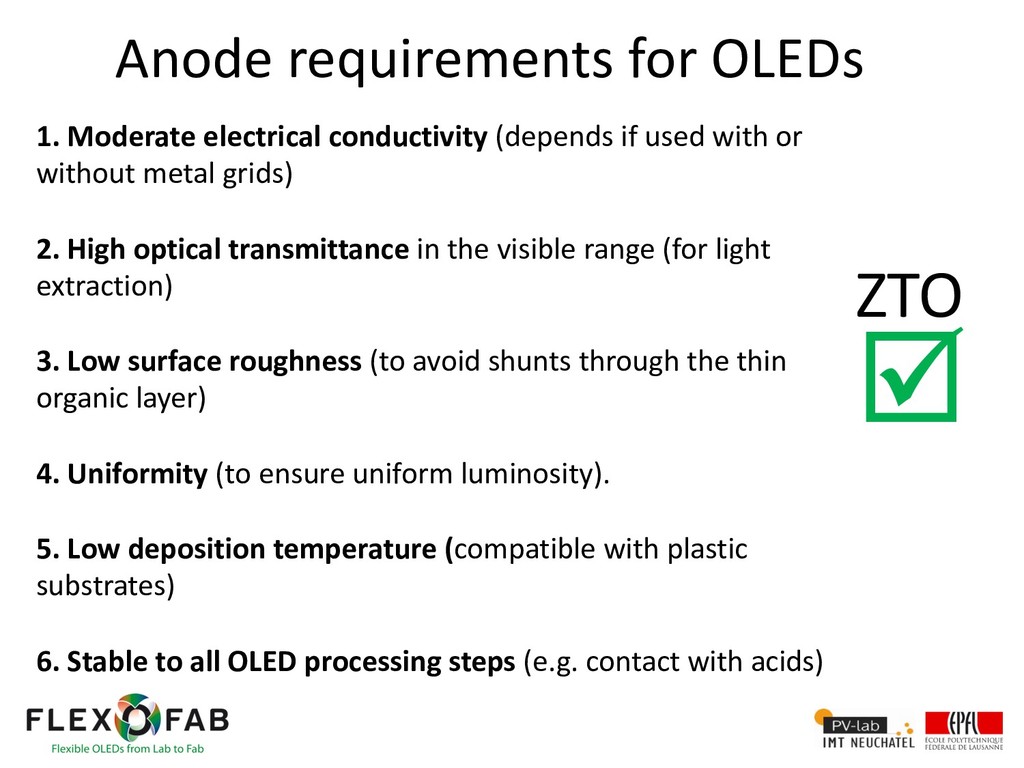
  29. Anode requirements for OLEDs 1. Moderate electrical conductivity (depends if

    used with or without metal grids) 2. High optical transmittance in the visible range (for light extraction) 3. Low surface roughness (to avoid shunts through the thin organic layer) 4. Uniformity (to ensure uniform luminosity). 5. Low deposition temperature (compatible with plastic substrates) 6. Stable to all OLED processing steps (e.g. contact with acids) þ ZTO
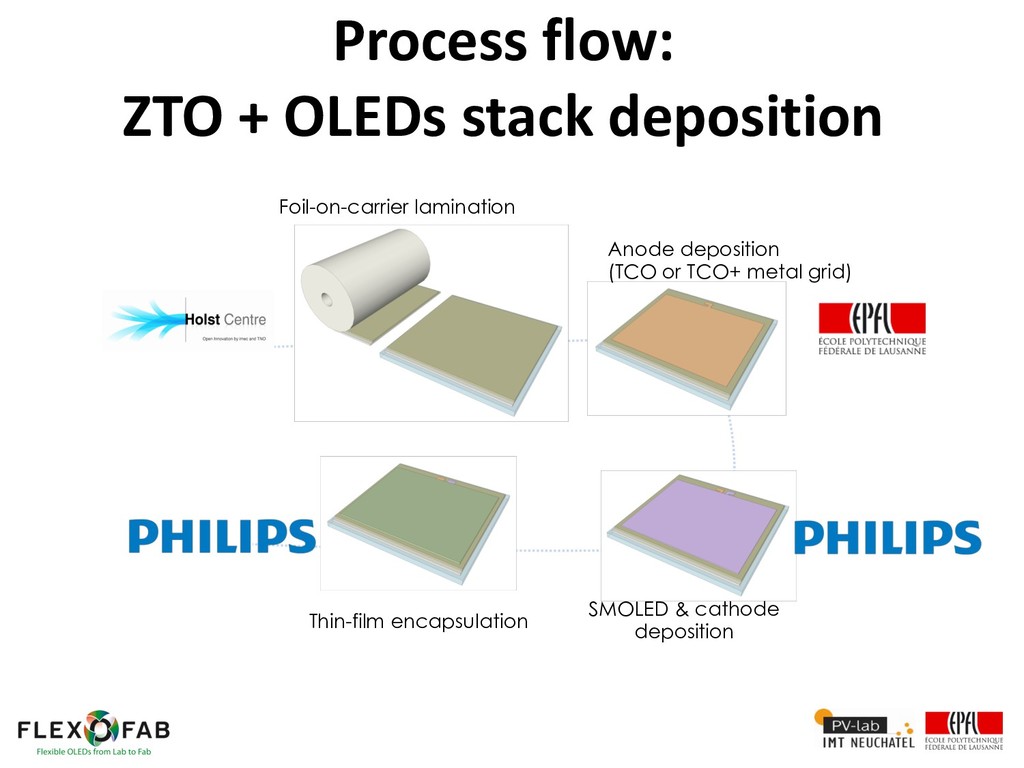
  30. Foil-on-carrier lamination Anode deposition (TCO or TCO+ metal grid) SMOLED

    & cathode deposition Thin-film encapsulation Process flow: ZTO + OLEDs stack deposition
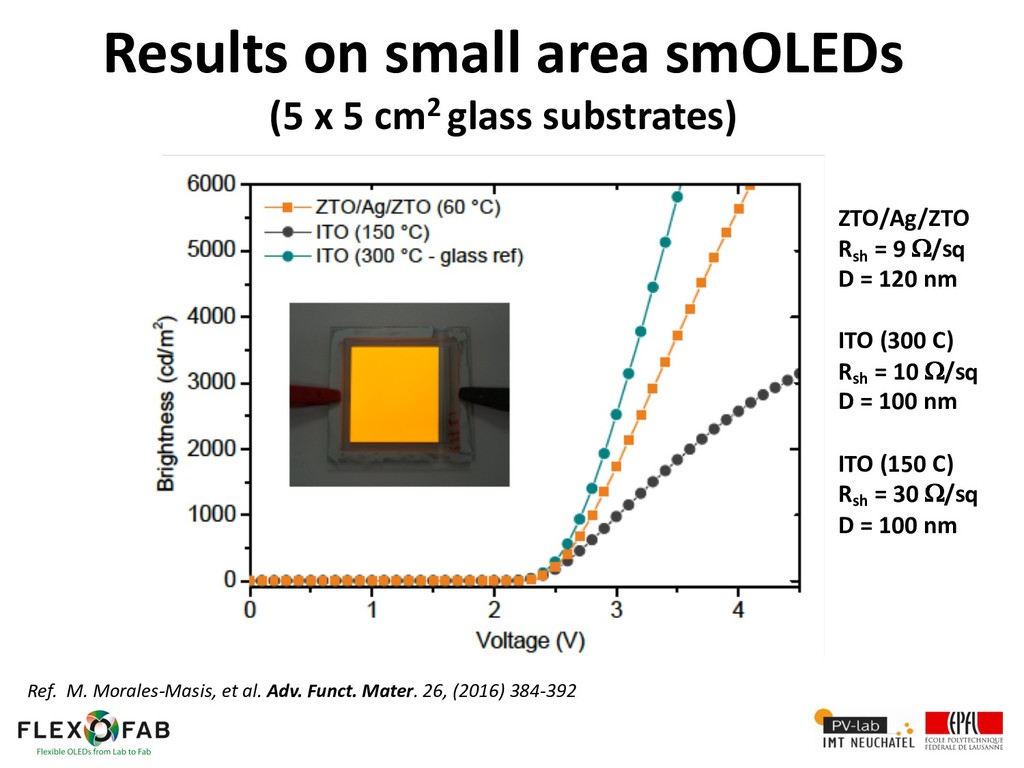
  31. Results on small area smOLEDs (5 x 5 cm2 glass

    substrates) Turn on voltage: 3V Ref. M. Morales-Masis, et al. Adv. Funct. Mater. 26, (2016) 384-392 ZTO/Ag/ZTO Rsh = 9 W/sq D = 120 nm ITO (300 C) Rsh = 10 W/sq D = 100 nm ITO (150 C) Rsh = 30 W/sq D = 100 nm
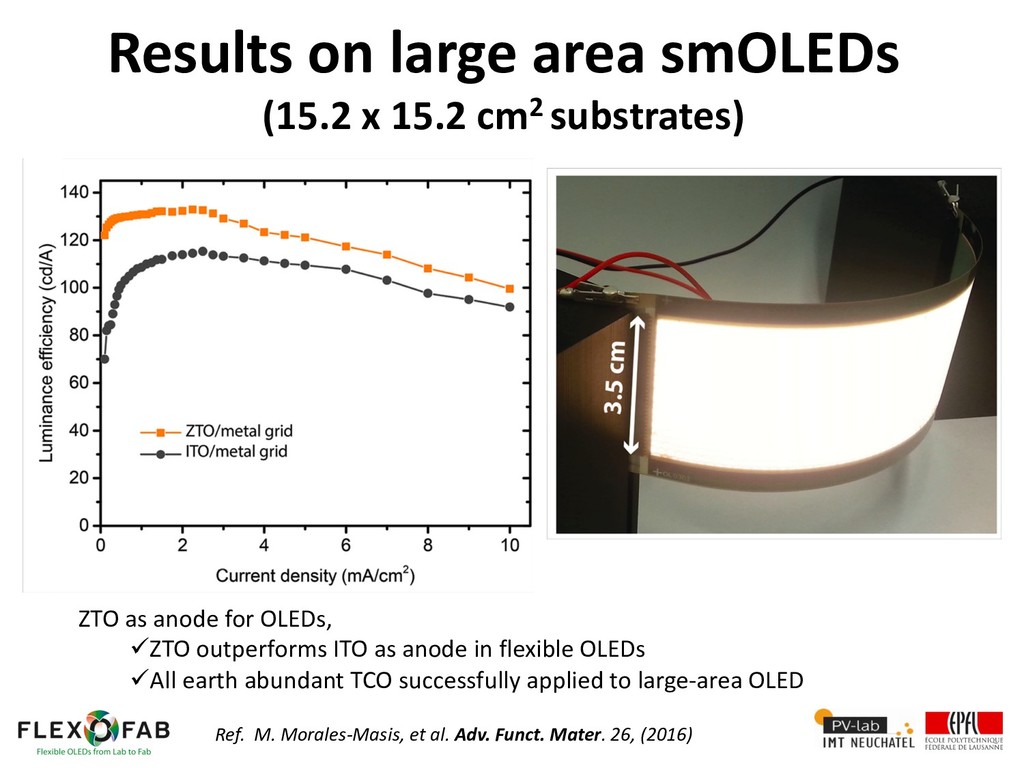
  32. Results on large area smOLEDs (15.2 x 15.2 cm2 substrates)

    Turn on voltage: 3V ZTO as anode for OLEDs, üZTO outperforms ITO as anode in flexible OLEDs üAll earth abundant TCO successfully applied to large-area OLED Ref. M. Morales-Masis, et al. Adv. Funct. Mater. 26, (2016)
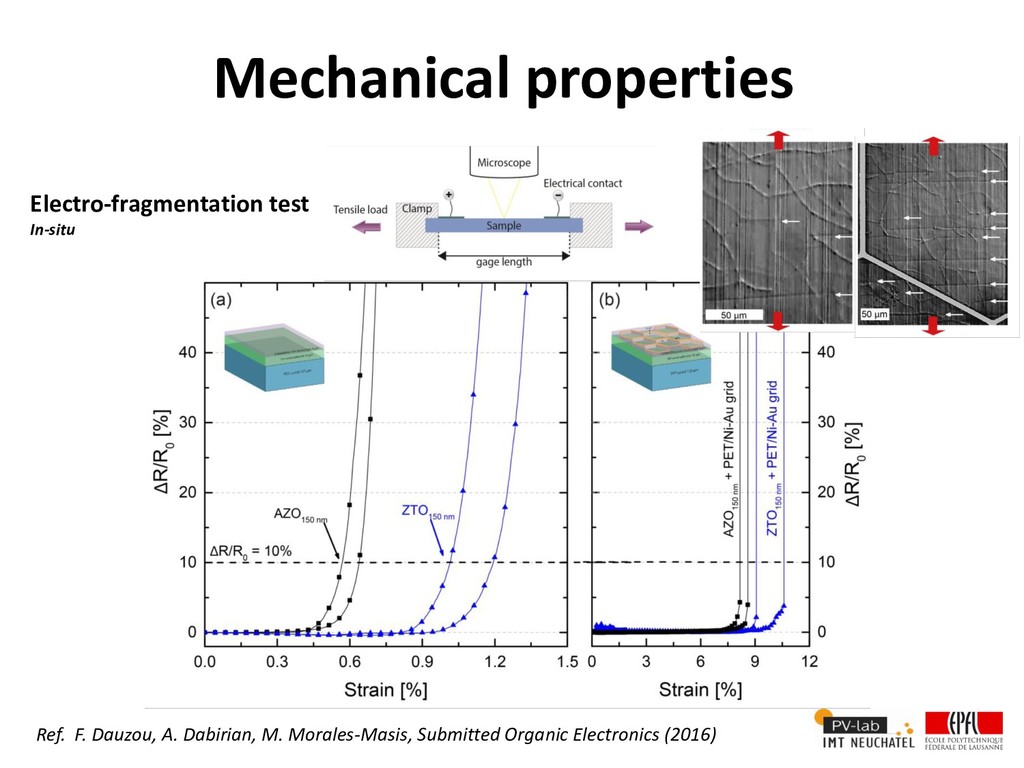
  33. Mechanical properties Ref. F. Dauzou, A. Dabirian, M. Morales-Masis, Submitted

    Organic Electronics (2016) Electro-fragmentation test In-situ
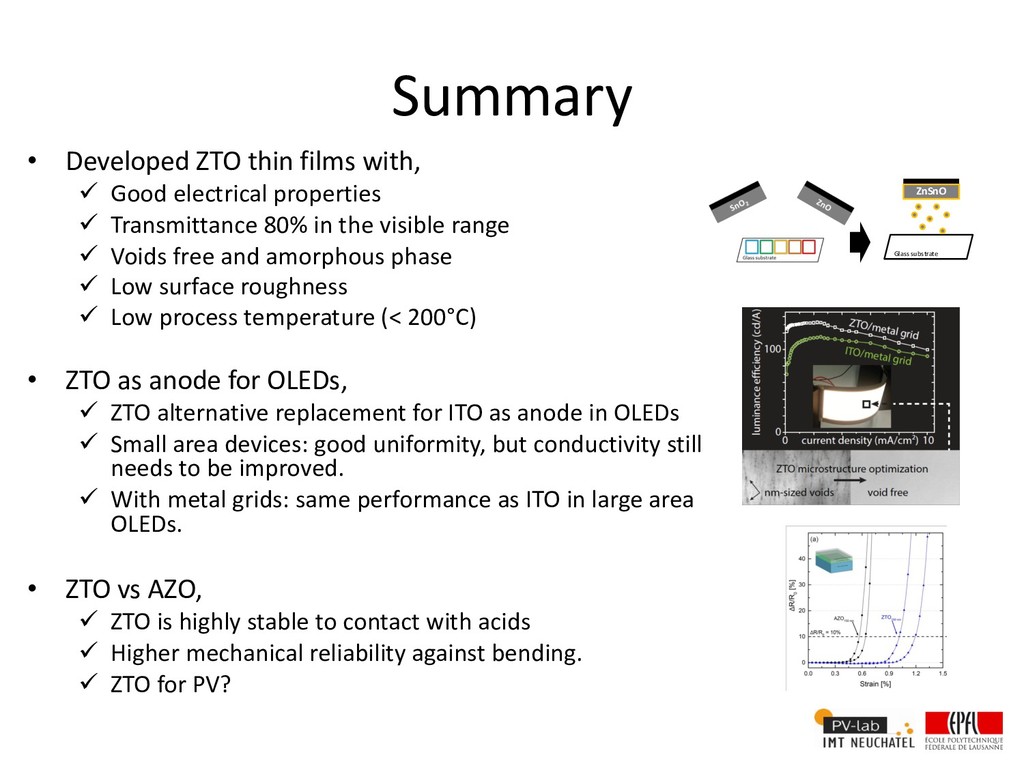
  34. Summary • Developed ZTO thin films with, ü Good electrical

    properties ü Transmittance 80% in the visible range ü Voids free and amorphous phase ü Low surface roughness ü Low process temperature (< 200°C) • ZTO as anode for OLEDs, ü ZTO alternative replacement for ITO as anode in OLEDs ü Small area devices: good uniformity, but conductivity still needs to be improved. ü With metal grids: same performance as ITO in large area OLEDs. • ZTO vs AZO, ü ZTO is highly stable to contact with acids ü Higher mechanical reliability against bending. ü ZTO for PV? ZnSnO Glass substrate
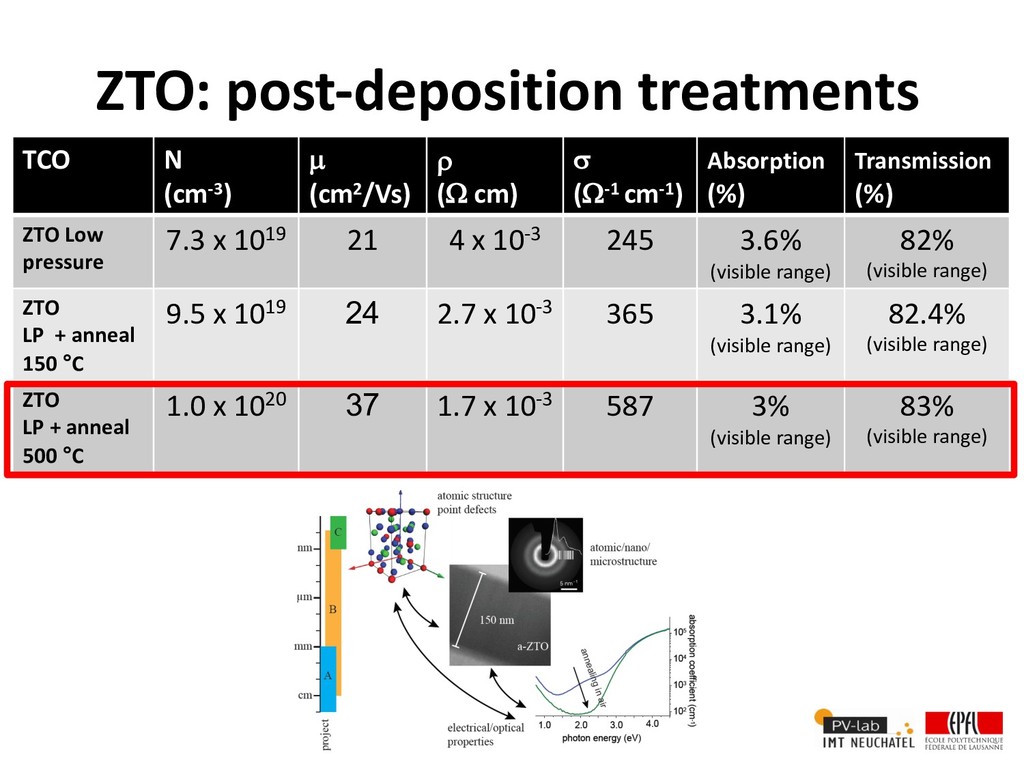
  35. TCO N (cm-3) µ (cm2/Vs) r (W cm) s (W-1

    cm-1) Absorption (%) Transmission (%) ZTO Low pressure 7.3 x 10¹⁹ 21 4 x 10⁻³ 245 3.6% (visible range) 82% (visible range) ZTO LP + anneal 150 °C 9.5 x 10¹⁹ 24 2.7 x 10⁻³ 365 3.1% (visible range) 82.4% (visible range) ZTO LP + anneal 500 °C 1.0 x 10²⁰ 37 1.7 x 10⁻³ 587 3% (visible range) 83% (visible range) ZTO: post-deposition treatments