Upgrade to Pro — share decks privately, control downloads, hide ads and more …

An Evening with MongoDB - San Diego: Real User Measurements with MongoDB

mongodb
July 25, 2012
1.1k

An Evening with MongoDB - San Diego: Real User Measurements with MongoDB

Eric Azoulay, Neustar
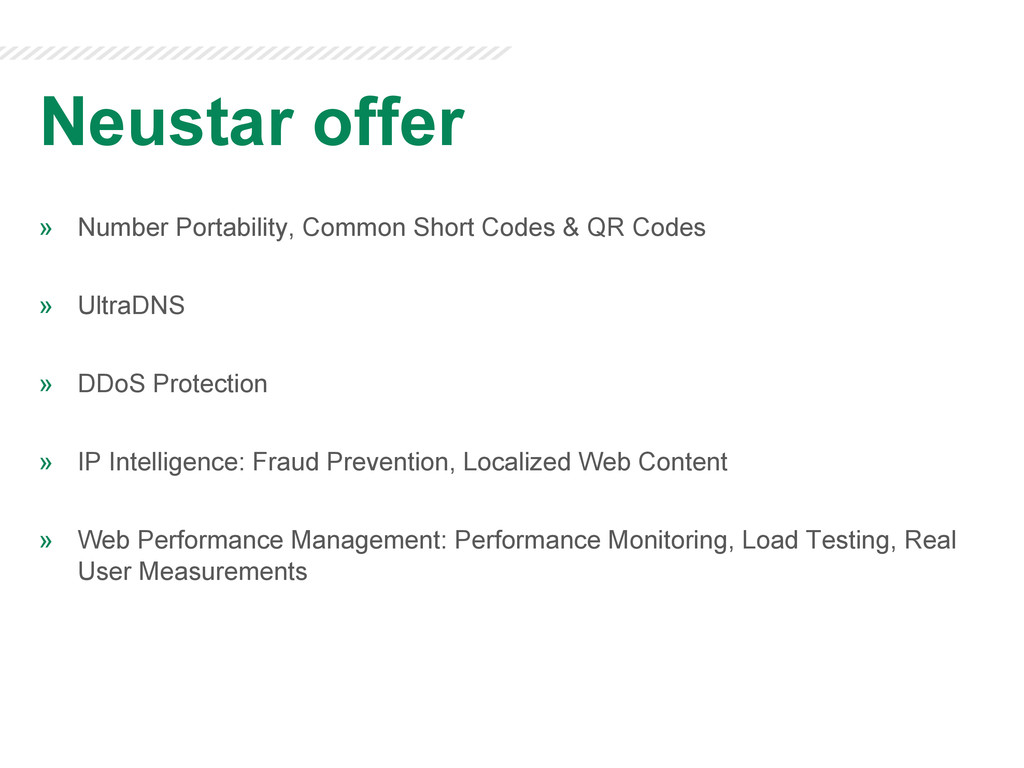
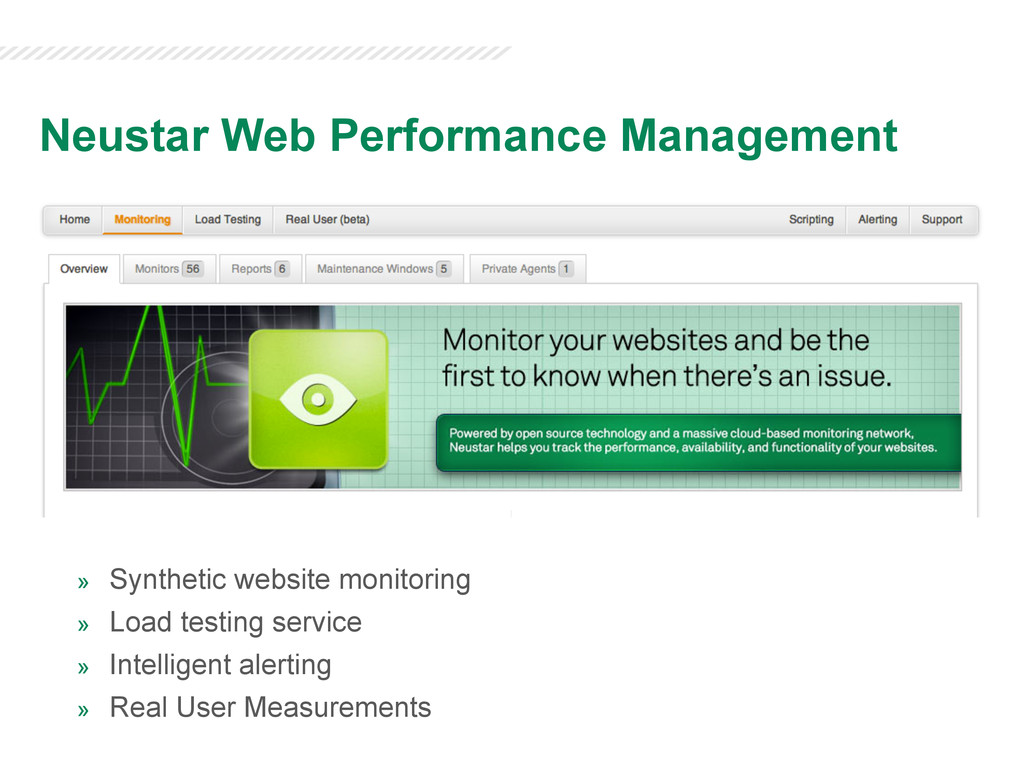
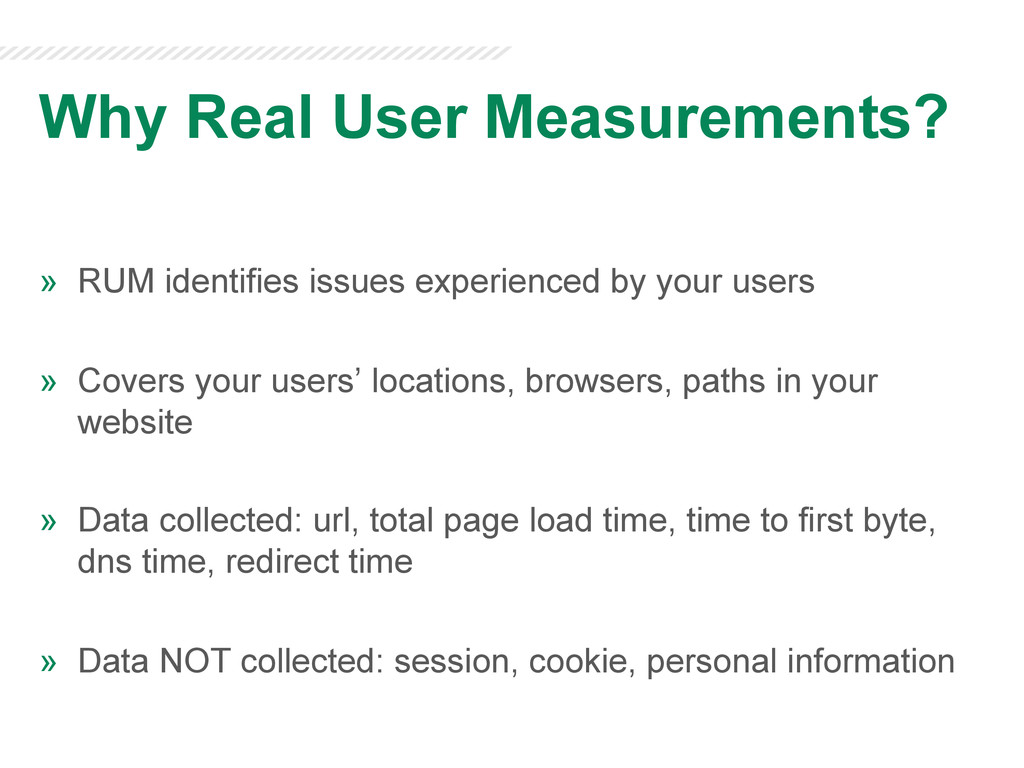
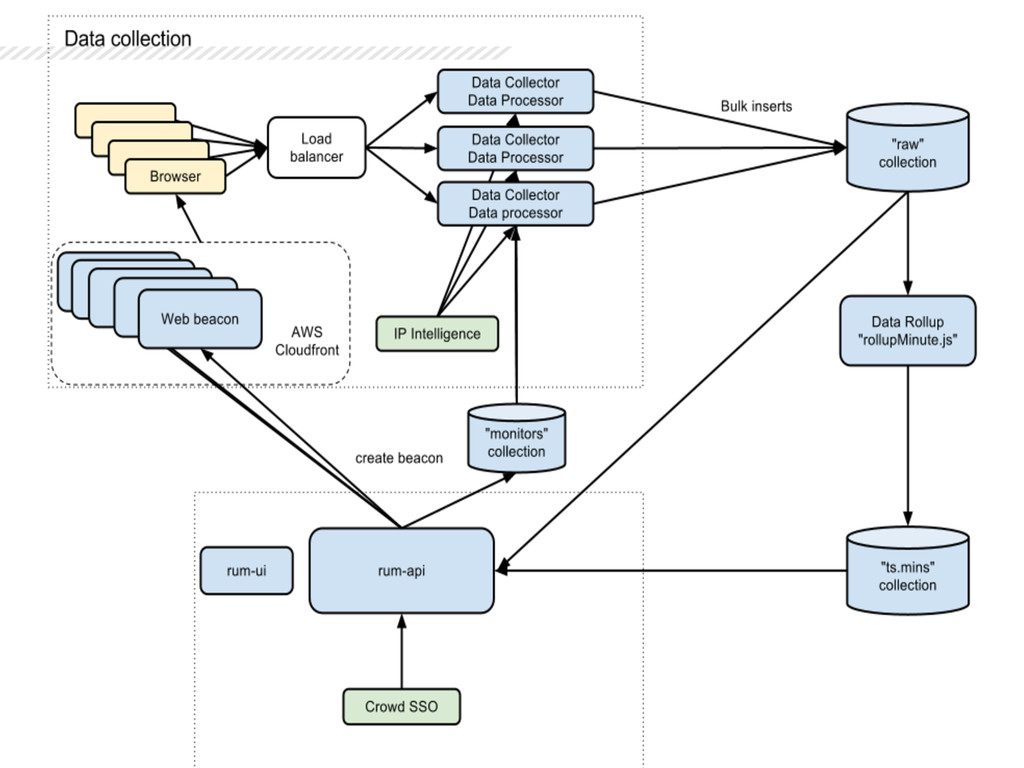
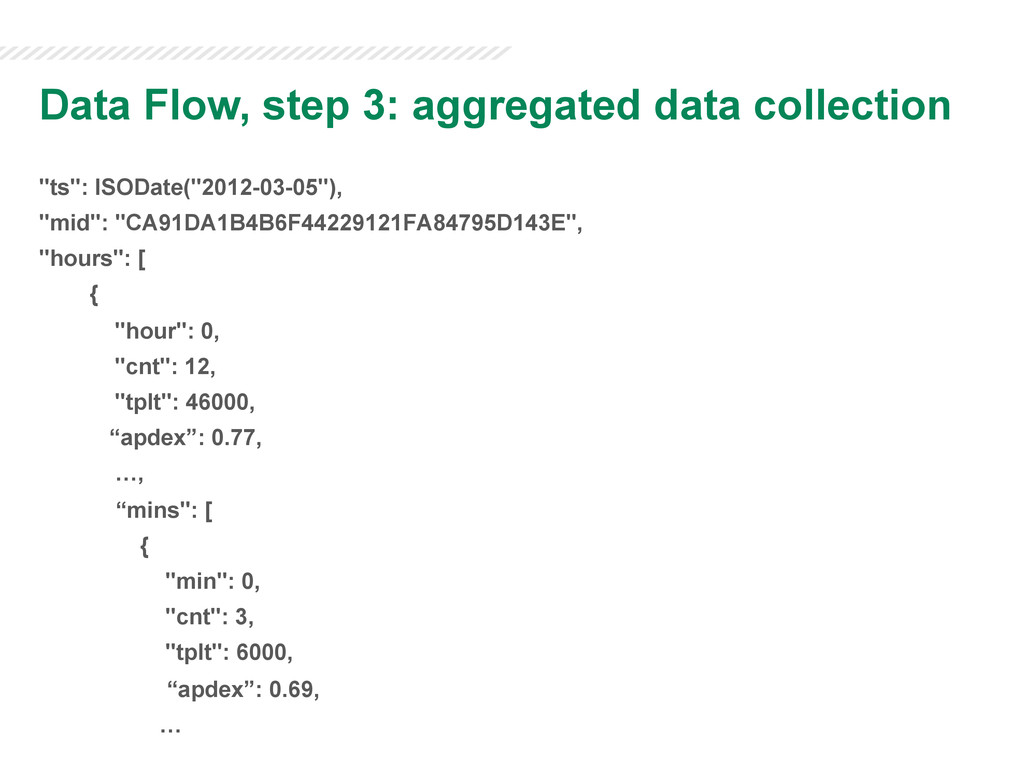
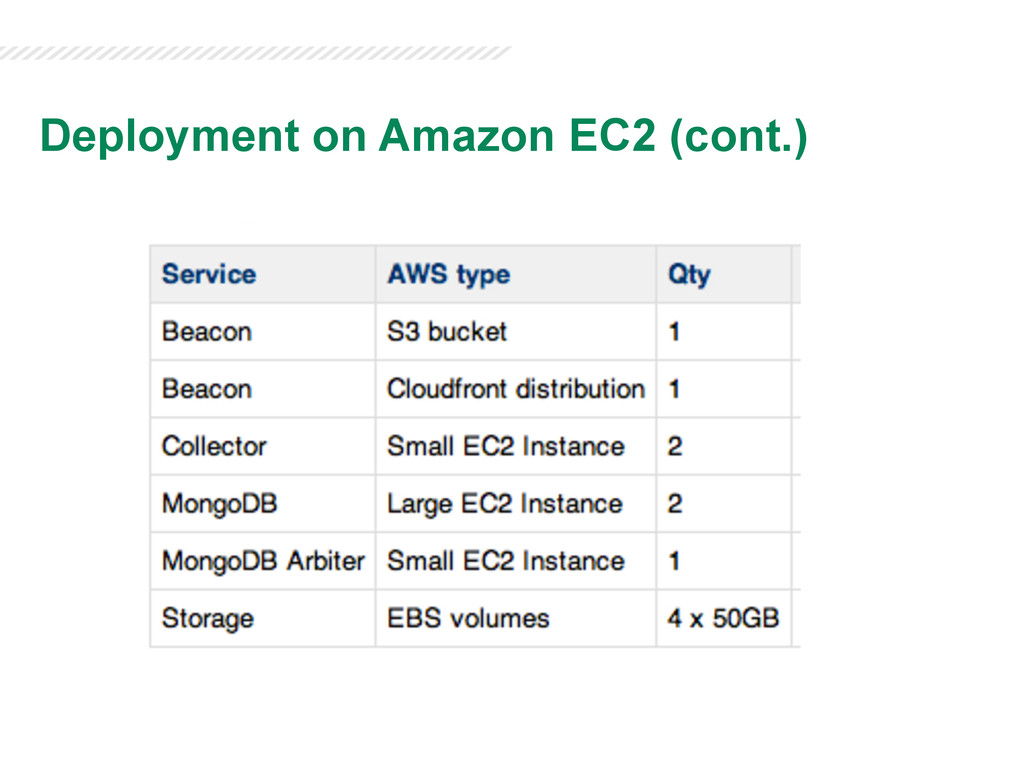
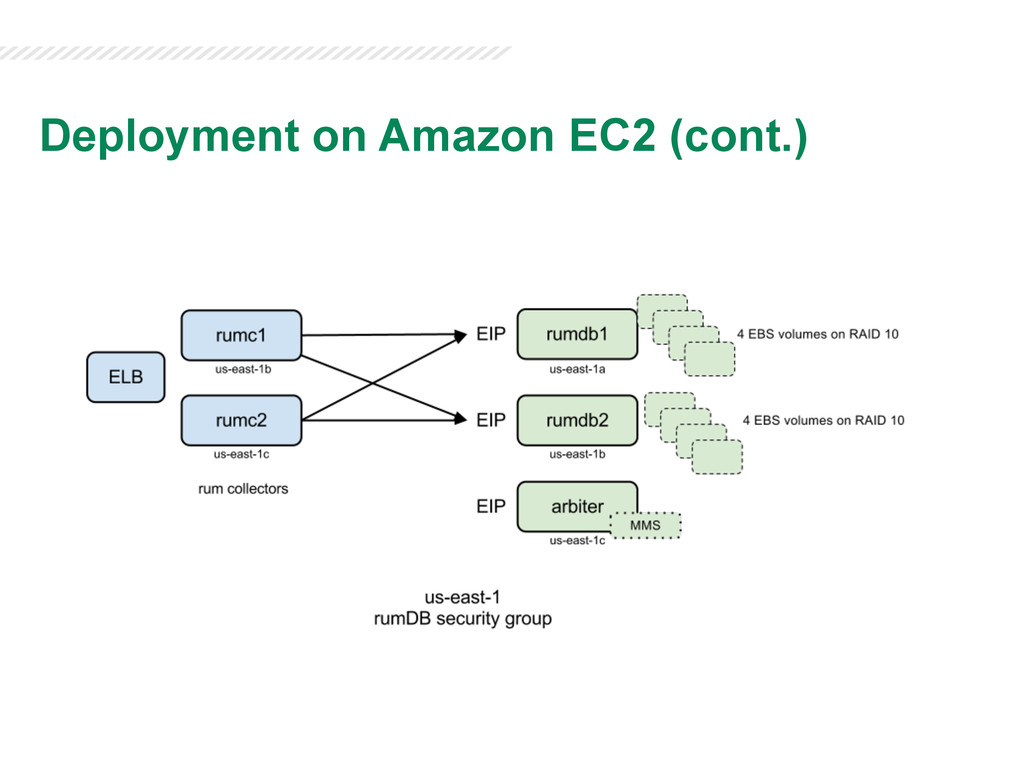
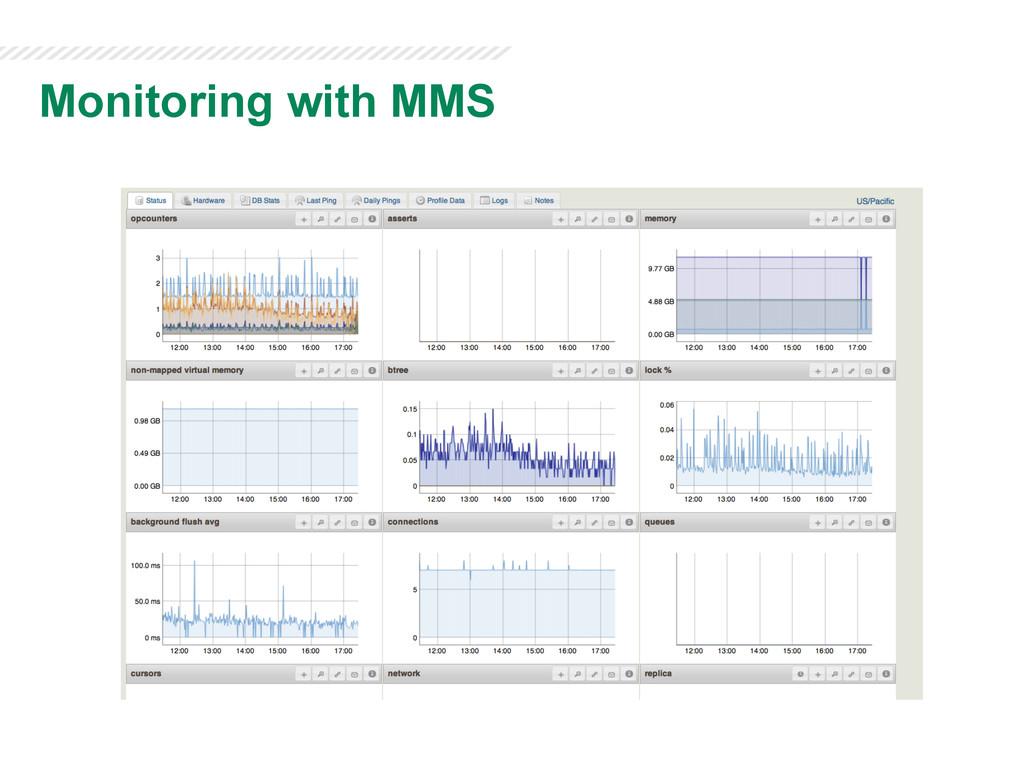
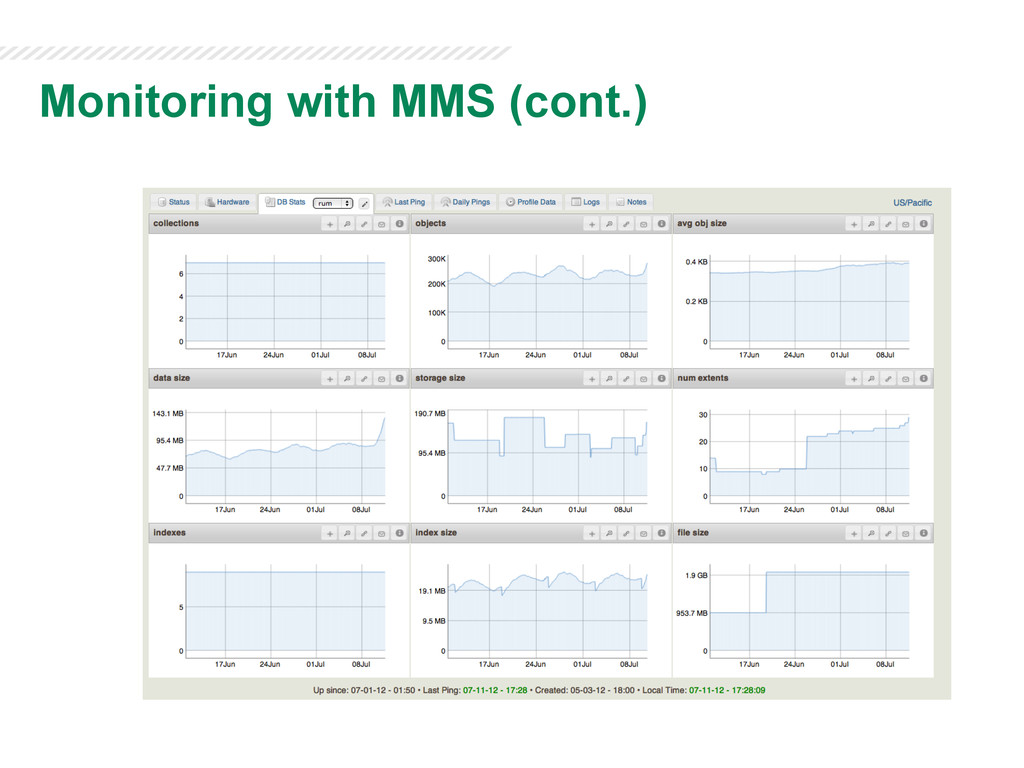
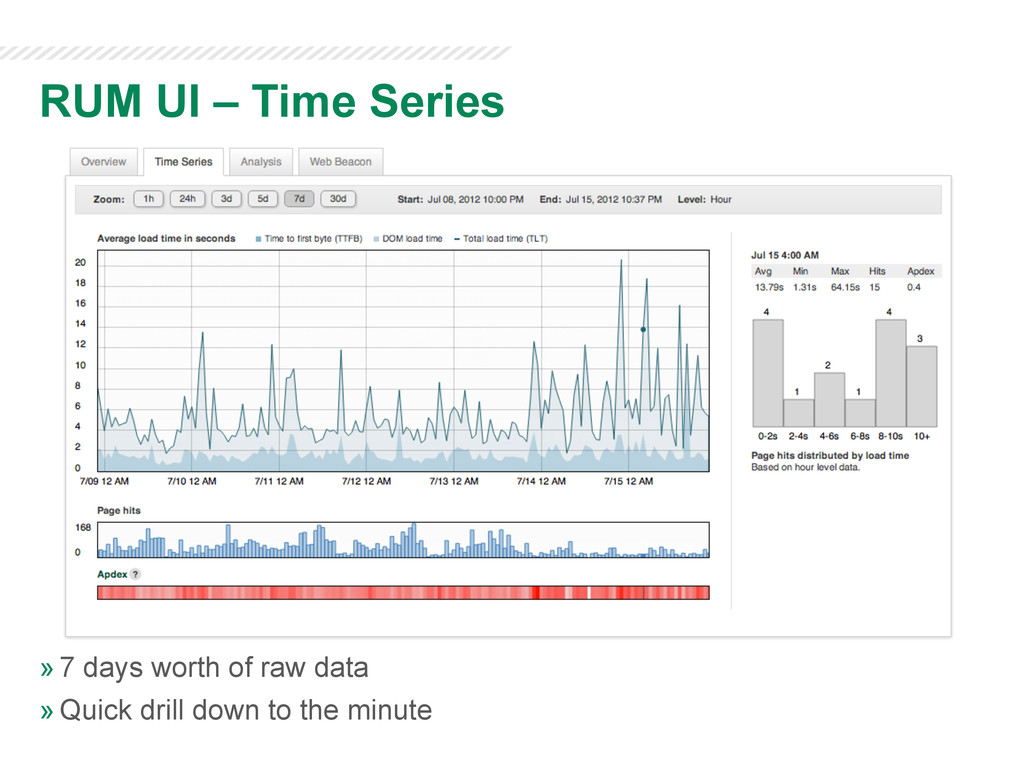
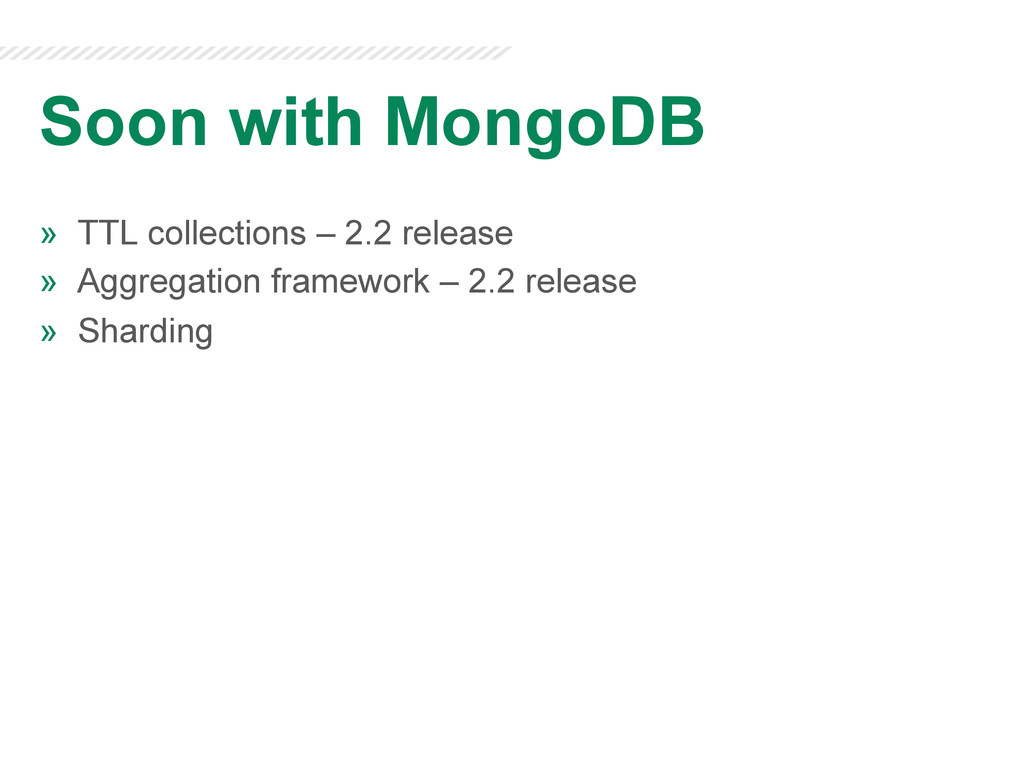
In this talk I will briefly go over what Neustar does and what real user monitoring is. Then I will talk about why we chose MongoDB as our storage solution for the expected massive amount of data we plan to collect. Then I will go more into details about our data model, our architecture with Amazon AWS, aggregation jobs, etc. After that I will talk about daily operations such as maintenance, backups, and using Mongo MMS for monitoring. Finally I will talk about what is coming up with MongoDB in this project: using sharding for scaling out and the new aggregation framework for advanced features of our product.

mongodb

July 25, 2012
Tweet

Transcript

  1. Neustar offer »  Number Portability, Common Short Codes & QR

    Codes »  UltraDNS »  DDoS Protection »  IP Intelligence: Fraud Prevention, Localized Web Content »  Web Performance Management: Performance Monitoring, Load Testing, Real User Measurements
  2. »  Synthetic website monitoring »  Load testing service »  Intelligent

    alerting »  Real User Measurements Neustar Web Performance Management
  3. Why Real User Measurements? »  RUM identifies issues experienced by

    your users »  Covers your users’ locations, browsers, paths in your website »  Data collected: url, total page load time, time to first byte, dns time, redirect time »  Data NOT collected: session, cookie, personal information
  4. Neustar Web Performance RUM »  Beta product – free! » 

    Captures experience of actual users on your site »  Only thing to do is copy a tiny piece of JavaScript code into your web page template »  Performance data is collected for every page visit after the page is done loading »  THIS COULD TURN INTO A LOT OF DATA
  5. Why MongoDB? »  Built to scale »  JSON everywhere in

    a Javascript ecosystem (Node.js) »  No alter table!! »  Ease of use, reduced development time »  Lots of nice features: replica sets, JavaScript shell, mms »  Support from community and 10gen
  6. RUM Web Beacon <!-- Start of Neustar Real User Measurements

    code --> <script type="text/javascript"> ns_rum = {}; ns_rum.init = function () { var s = document.createElement ('script'); s.id = 'rum'; s.type = 'text/javascript'; s.src = 'https://djzsy4s19uaxq.cloudfront.net/[your ID]/neustar.beacon.js'; document.getElementsByTagName('head')[0].appendChild(s); } window.addEventListener ? window.addEventListener('load', ns_rum.init, false) : window.attachEvent ? window.attachEvent('onload', ns_rum.init) : false; </script> <!-- End of Neustar Real User Measurements code -->
  7. Data Flow, step 1: browser to data collector https://rum-collector.wpm.neustar.biz/beacon?u=https%3A %2F%2Fmonitor.wpm.neustar.biz

    %2F&t_done=3505&t_page=1770&r=https%3A%2F %2Frum.wpm.neustar.biz %2F&nt_redirectCount=0&nt_navigationType=0&nt_redirect Time=0&nt_dnsTime=0&nt_connectTime=757&nt_firstPack et=1735&nt_sslTime=203
  8. Data Flow, step 2: raw data collection "ts" : ISODate("2012-07-10T12:40:00.231Z"),

    “mid” : “1234567890abcdef” "ua" : { "asn" : "45839 - piradius net", "co" : "malaysia", ”st" : "kuala lumpur", "ls" : "high", "br" : "firefox 11" }, "u" : “mywebsite.com/example", "t_page" : 4957, "t_dom" : 3702, "t_dns" : 6, "_id" : ObjectId("4ffc22a0f0db9a6f590000e5")
  9. Data Flow, step 3: aggregated data collection "ts": ISODate("2012-03-05"), "mid":

    "CA91DA1B4B6F44229121FA84795D143E", "hours": [ { "hour": 0, "cnt": 12, "tplt": 46000, “apdex”: 0.77, …, “mins": [ { "min": 0, "cnt": 3, "tplt": 6000, “apdex”: 0.69, …
  10. Data rollup job »  JS script run every minute on

    the primary DB node »  Aggregate data, calculate apdex, min/max, add sample counts to buckets »  If day document does not exist, create one padded with 0s »  In-place update of the current hour and minute »  Document does not grow in size (keep padding factor at 1)
  11. Keeping data under control »  hourly job to remove old

    data »  weekly job to compact collections »  monthly job to rotate the MongoDB log files
  12. Deployment on Amazon EC2 »  Easy and affordable »  Can

    scale: from experiment to production »  Redundancy, security groups, etc.
  13. » 7 days worth of raw data » Quick drill down to

    the minute RUM UI – Time Series
  14. Apdex score »  Measures user satisfaction »  Apdex = (Satisfied

    + Tolerated/2) / Total Level Time Satisfied <= 2 seconds Tolerated Between 2 and 8 seconds Frustrated Greater than 8 seconds
  15. Soon with MongoDB »  TTL collections – 2.2 release » 

    Aggregation framework – 2.2 release »  Sharding