Upgrade to Pro
— share decks privately, control downloads, hide ads and more …
Speaker Deck
Features
Speaker Deck
PRO
Sign in
Sign up for free
Search
Search
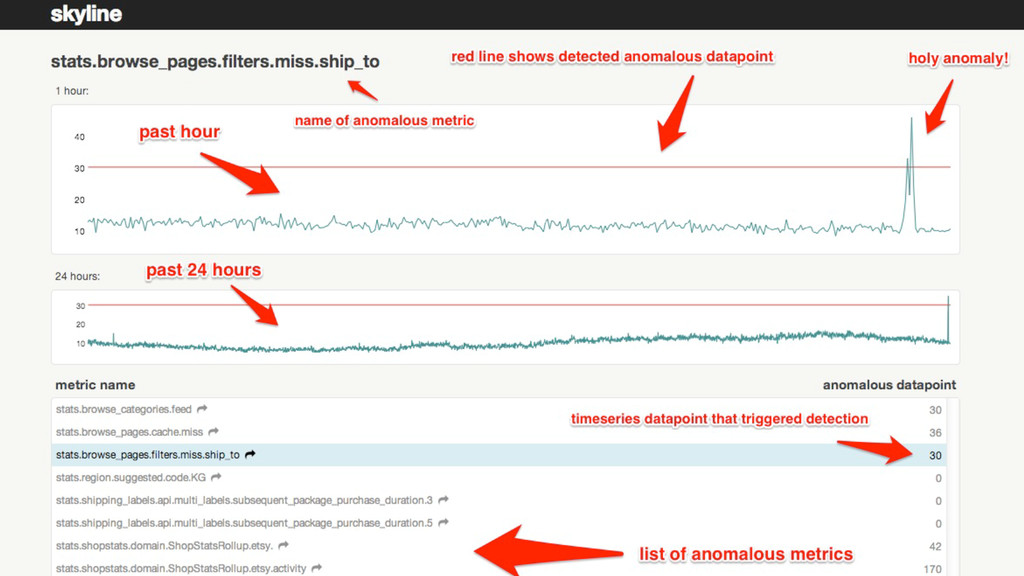
Berlin 2013 - Kale Workshop - Abe Stanway
Search
Monitorama
September 20, 2013
510
0
Share
Embed
Copy iframe code
Copy JS code
Copy link
Start on current slide
Berlin 2013 - Kale Workshop - Abe Stanway
Monitorama
September 20, 2013
More Decks by Monitorama
See All by Monitorama
Monitorama PDX 2017 - Ian Bennett
monitorama
1
630
PDX 2017 - Pedro Andrade
monitorama
0
830
PDX 2017 - Roy Rapoport
monitorama
4
1k
PDX 2017 - Julia Evans
monitorama
0
520
Berlin 2013 - Session - Brad Lhotsky
monitorama
5
770
Berlin 2013 - Session - Alex Petrov
monitorama
6
730
Berlin 2013 - Session - Jeff Weinstein
monitorama
2
670
Berlin 2013 - Session - Oliver Hankeln
monitorama
1
590
Berlin 2013 - Session - David Goodlad
monitorama
0
520
Featured
See All Featured
Cheating the UX When There Is Nothing More to Optimize - PixelPioneers
stephaniewalter
287
14k
Lightning talk: Run Django tests with GitHub Actions
sabderemane
0
220
The browser strikes back
jonoalderson
0
1.4k
The Curious Case for Waylosing
cassininazir
1
430
Designing Experiences People Love
moore
143
24k
The AI Revolution Will Not Be Monopolized: How open-source beats economies of scale, even for LLMs
inesmontani
PRO
3
3.6k
職位にかかわらず全員がリーダーシップを発揮するチーム作り / Building a team where everyone can demonstrate leadership regardless of position
madoxten
63
55k
What’s in a name? Adding method to the madness
productmarketing
PRO
24
4.1k
JavaScript: Past, Present, and Future - NDC Porto 2020
reverentgeek
52
6k
Easily Structure & Communicate Ideas using Wireframe
afnizarnur
194
17k
Highjacked: Video Game Concept Design
rkendrick25
PRO
1
400
GraphQLとの向き合い方2022年版
quramy
50
15k
Transcript
WELCOME TO BROOKLYN: A WORKSHOP ON KALE Abe Stanway @abestanway
Disclaimer: still in beta
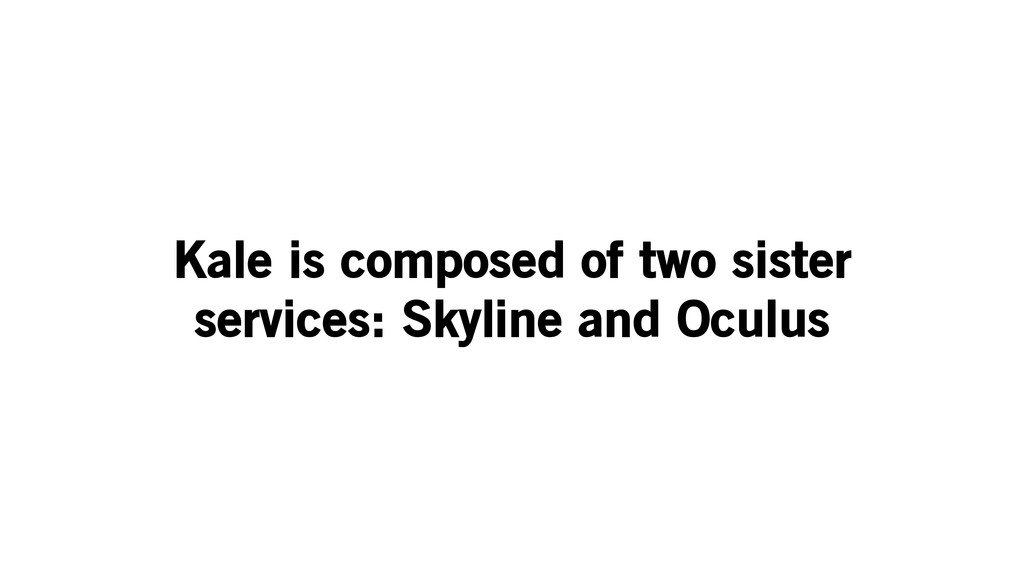
Kale is composed of two sister services: Skyline and Oculus
SKYLINE
SKYLINE
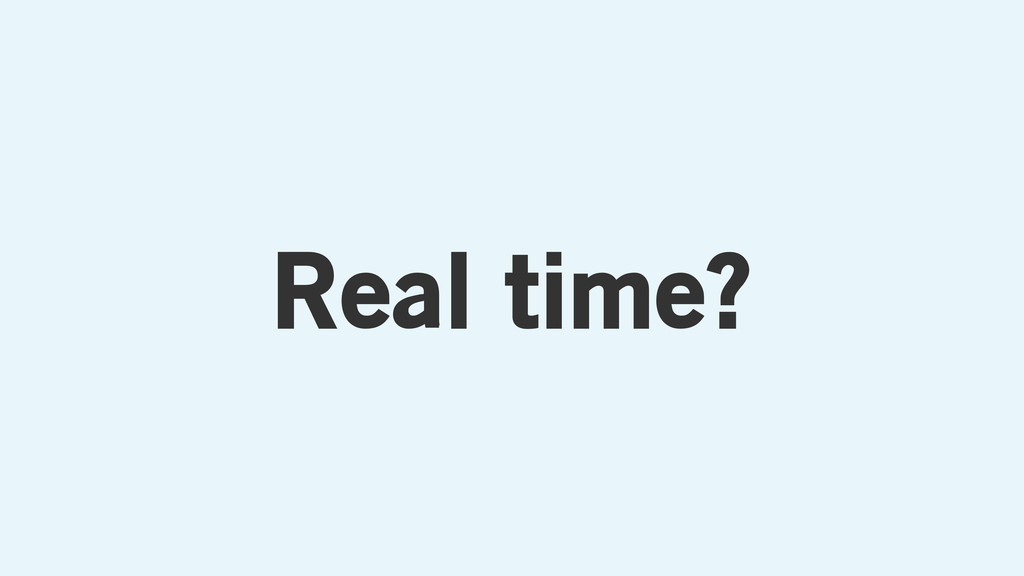
Q). How do you analyze a timeseries for anomalies in
real time?
A). Lots of HTTP requests to Graphite’s API!
Q). How do you analyze a quarter million timeseries for
anomalies in real time?
Skyline!
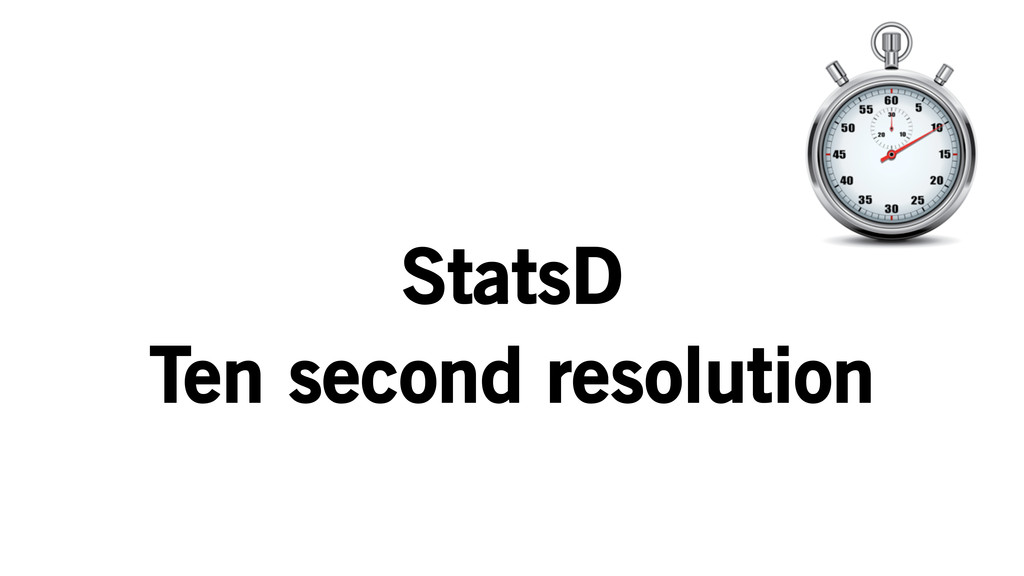
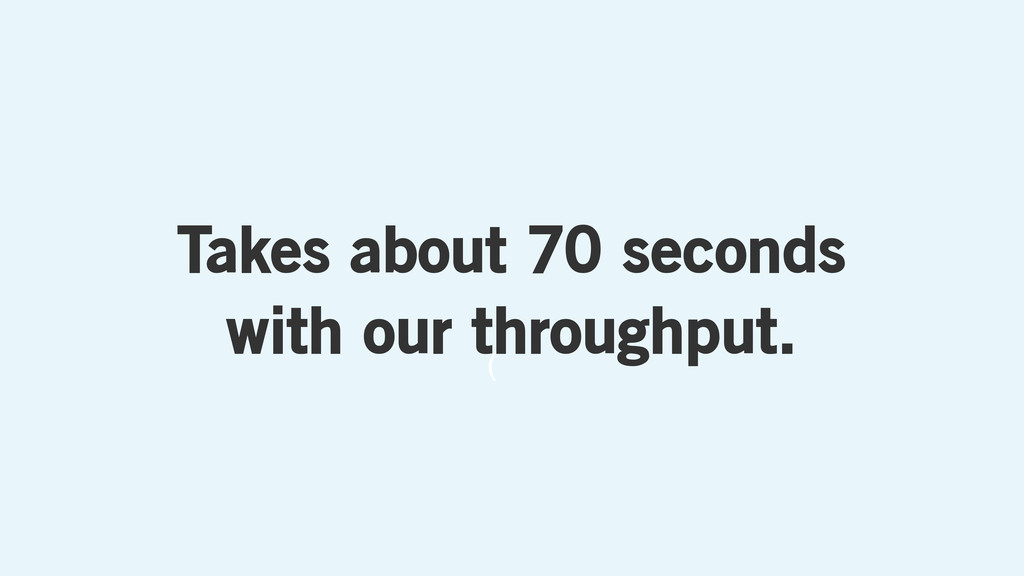
Real time?
Kinda.
StatsD Ten second resolution
Ganglia One minute resolution
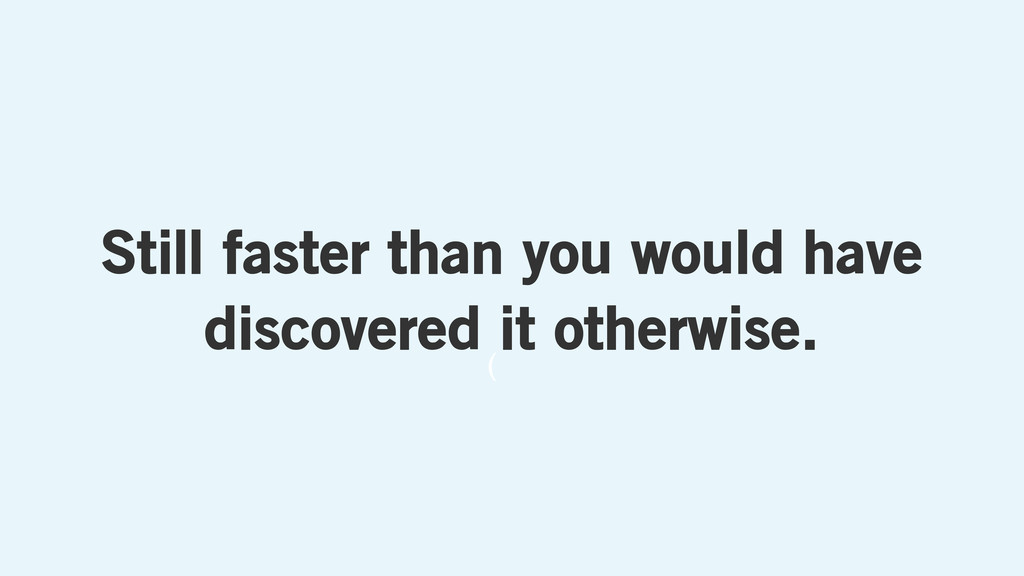
~ 10s ( ~ 1min Best case:
( Takes about 70 seconds with our throughput.
( Still faster than you would have discovered it otherwise.
Memory > Disk
None
Q). How do you get a quarter million timeseries into
Redis on time?
STREAM THAT SHIT!
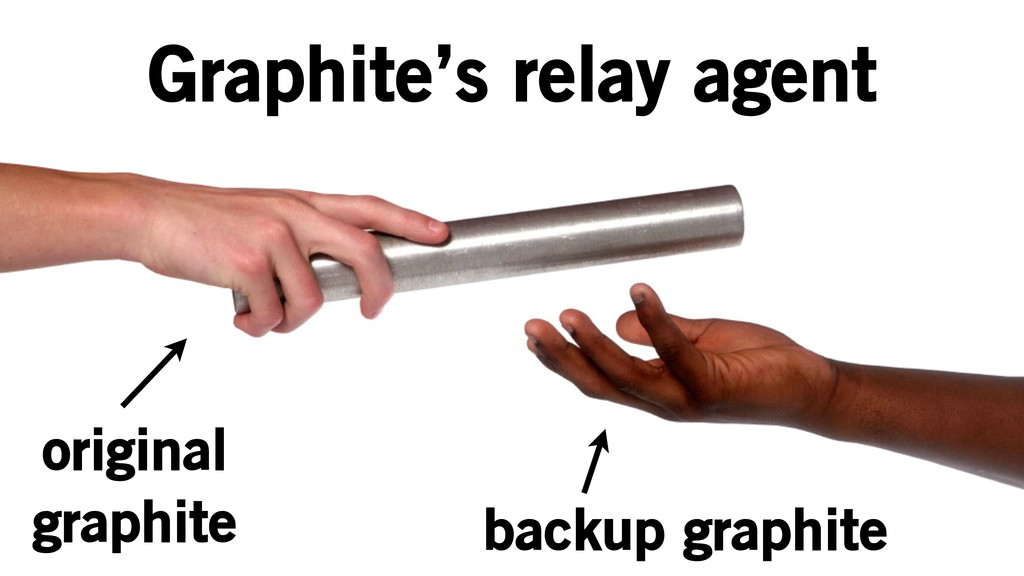
Graphite’s relay agent original graphite backup graphite
Graphite’s relay agent original graphite backup graphite [statsd.numStats, [1365603422, 82345]]
pickles [statsd.numStats, [1365603432, 80611]] [statsd.numStats, [1365603412, 73421]]
Graphite’s relay agent original graphite skyline [statsd.numStats, [1365603422, 82345]] pickles
[statsd.numStats, [1365603432, 80611]] [statsd.numStats, [1365603412, 73421]]
We import from Ganglia too.
Storing timeseries
Minimize I/O Minimize memory
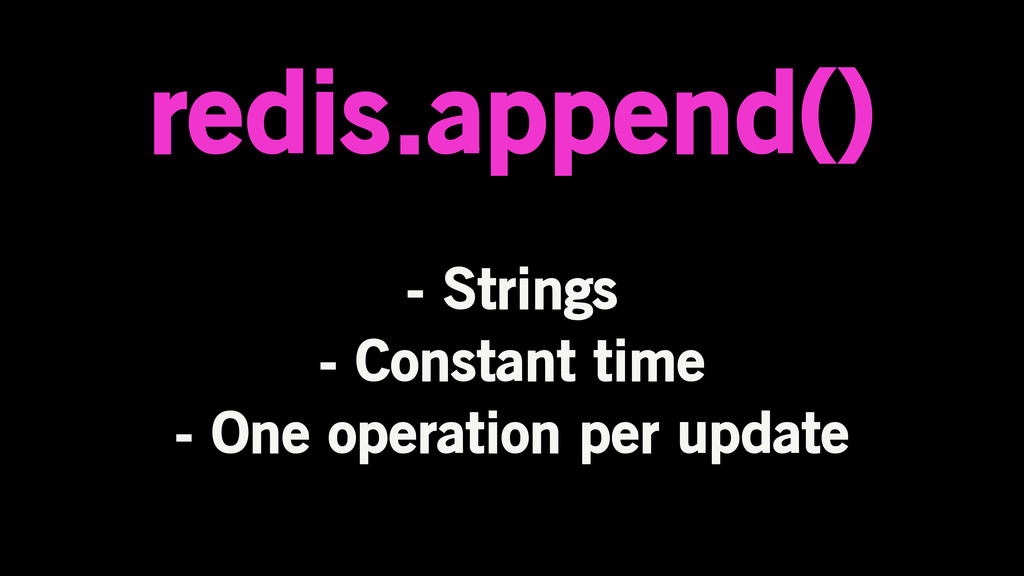
redis.append() - Strings - Constant time - One operation per
update
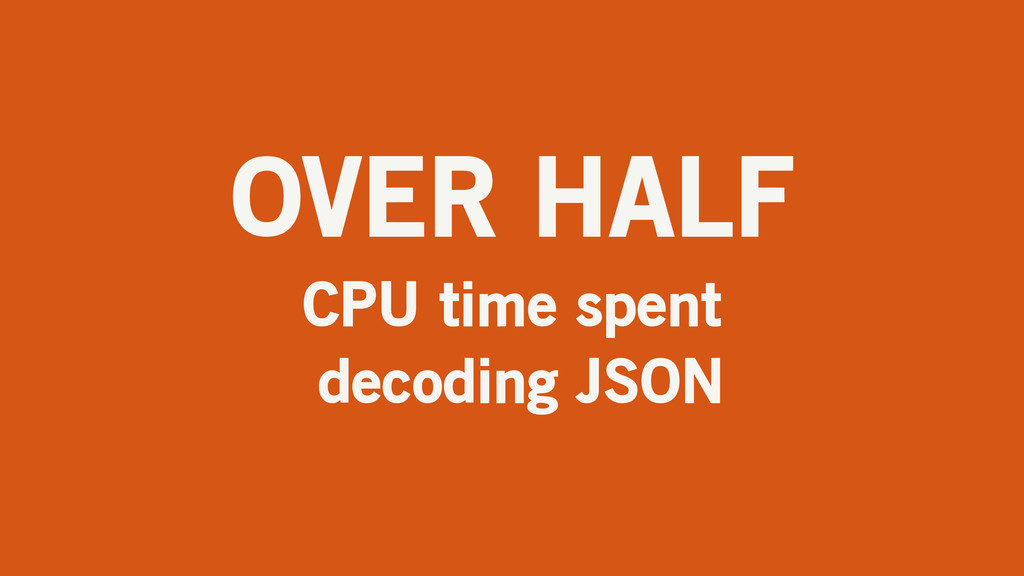
JSON?
“[1358711400, 51],” => get statsD.numStats ----------------------------
“[1358711400, 51], => get statsD.numStats ---------------------------- [1358711410, 23],”
“[1358711400, 51], => get statsD.numStats ---------------------------- [1358711410, 23], [1358711420, 45],”
OVER HALF CPU time spent decoding JSON
[1,2]
[ 1 , 2 ] Stuff we care about Extra
bullshit
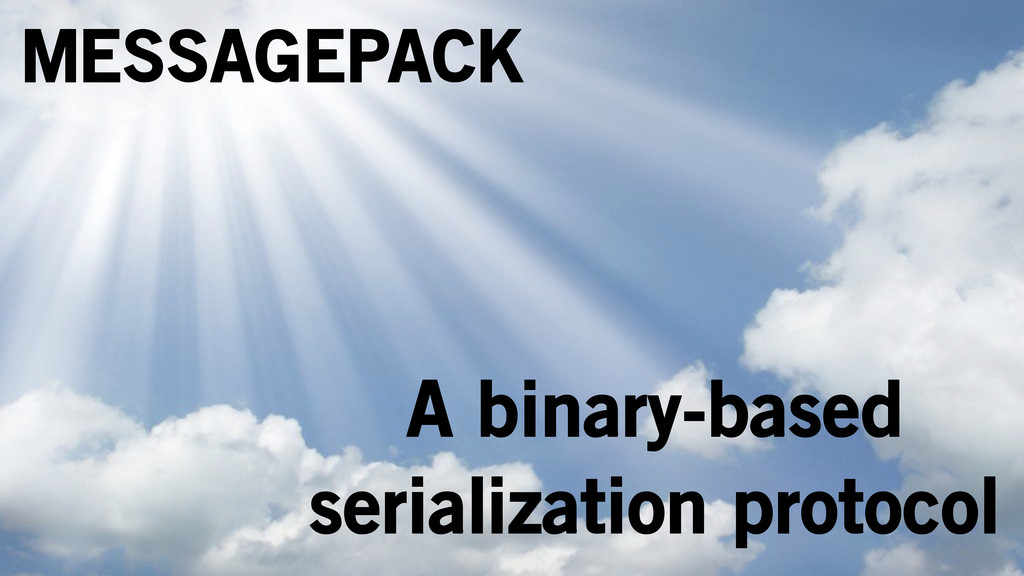
MESSAGEPACK
MESSAGEPACK A binary-based serialization protocol
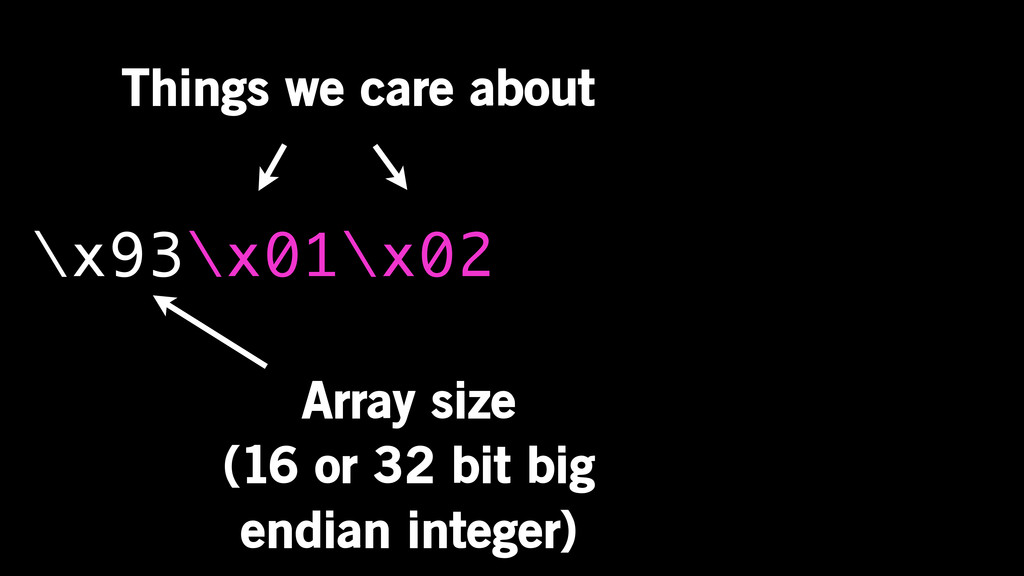
\x93\x01\x02 Array size (16 or 32 bit big endian integer)
Things we care about
\x93\x01\x02 Array size (16 or 32 bit big endian integer)
Things we care about \x93\x02\x03
CUT IN HALF Run Time + Memory Used
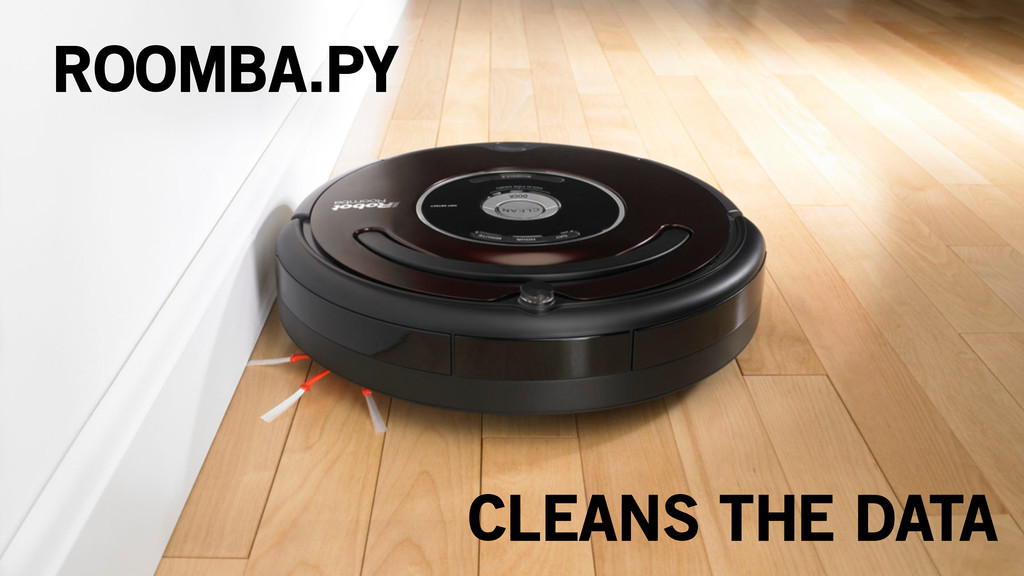
ROOMBA.PY CLEANS THE DATA
“Wait...you wrote this in Python?”
Great statistics libraries Not fun for parallelism
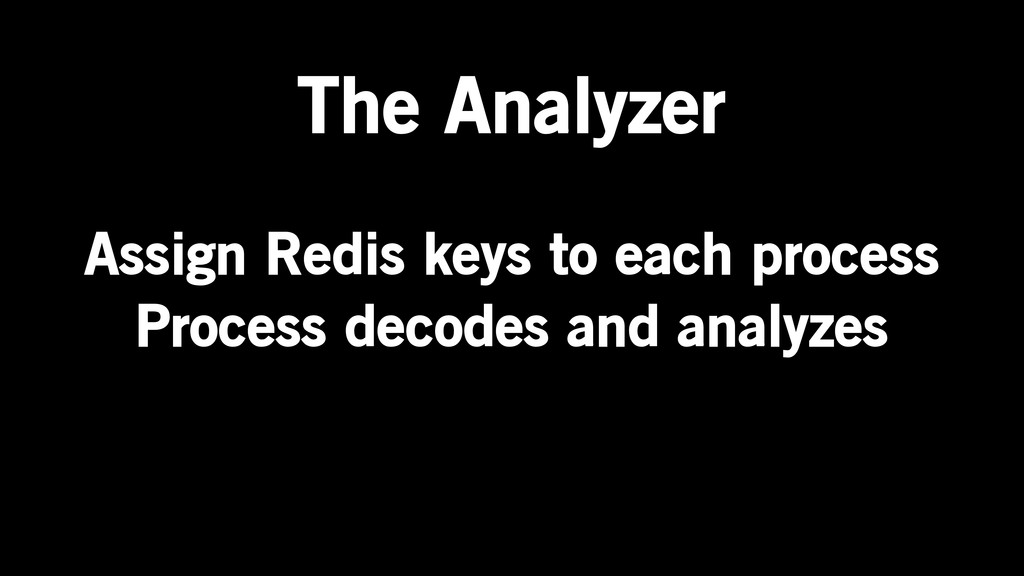
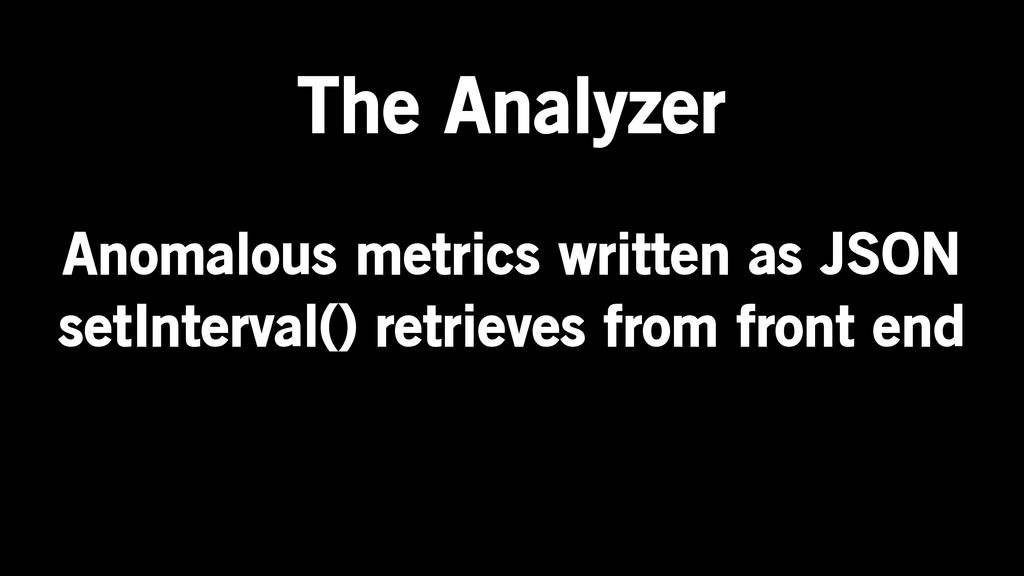
Simple map/reduce design The Analyzer
Assign Redis keys to each process Process decodes and analyzes
The Analyzer
Anomalous metrics written as JSON setInterval() retrieves from front end
The Analyzer
None
What does it mean to be anomalous?
Consensus model
[yes] [yes] [no] [no] [yes] [yes] = anomaly!
Helps correct model mismatches
Implement everything you can get your hands on
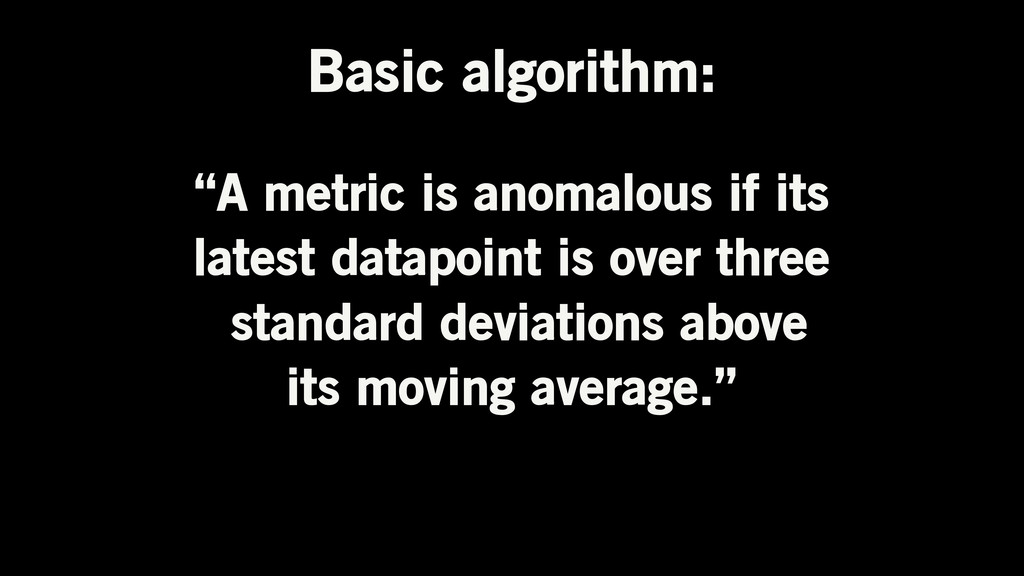
Basic algorithm: “A metric is anomalous if its latest datapoint
is over three standard deviations above its moving average.”
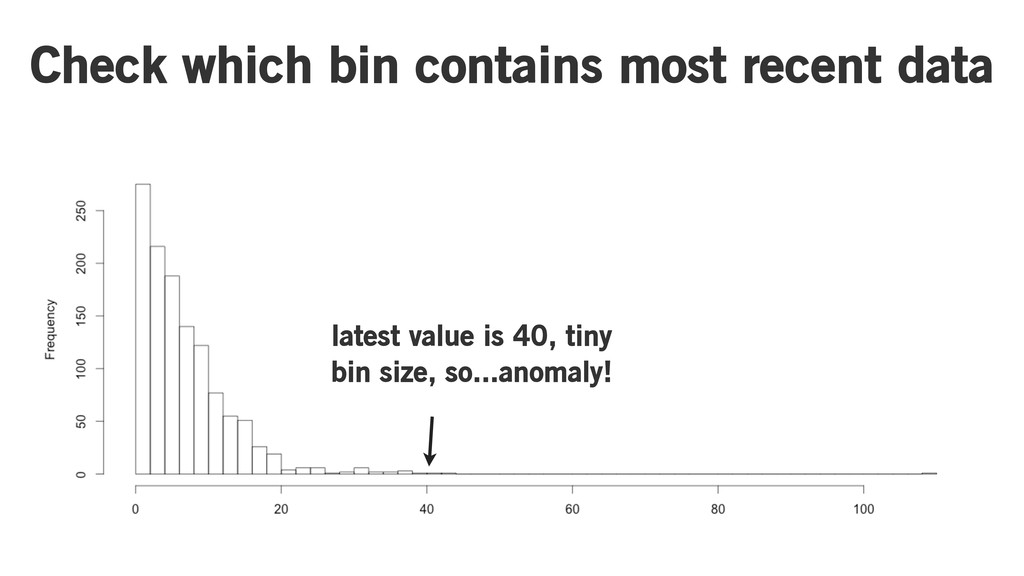
Histogram binning
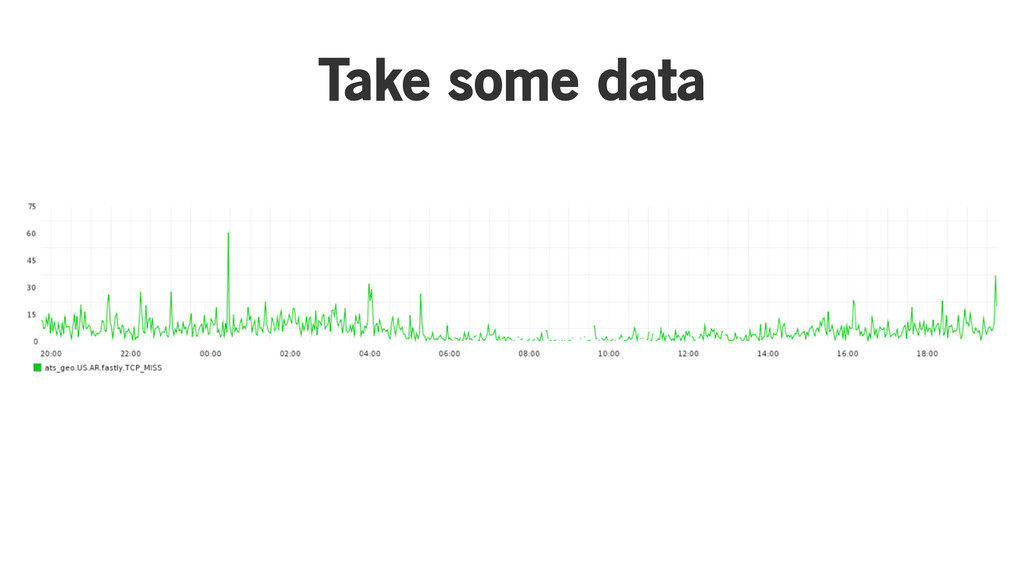
Take some data
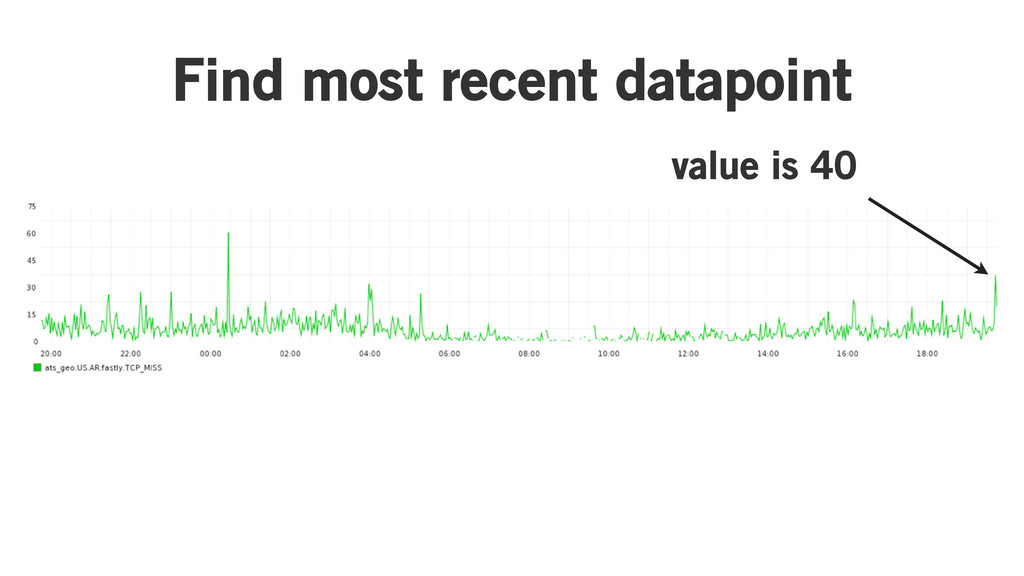
Find most recent datapoint value is 40
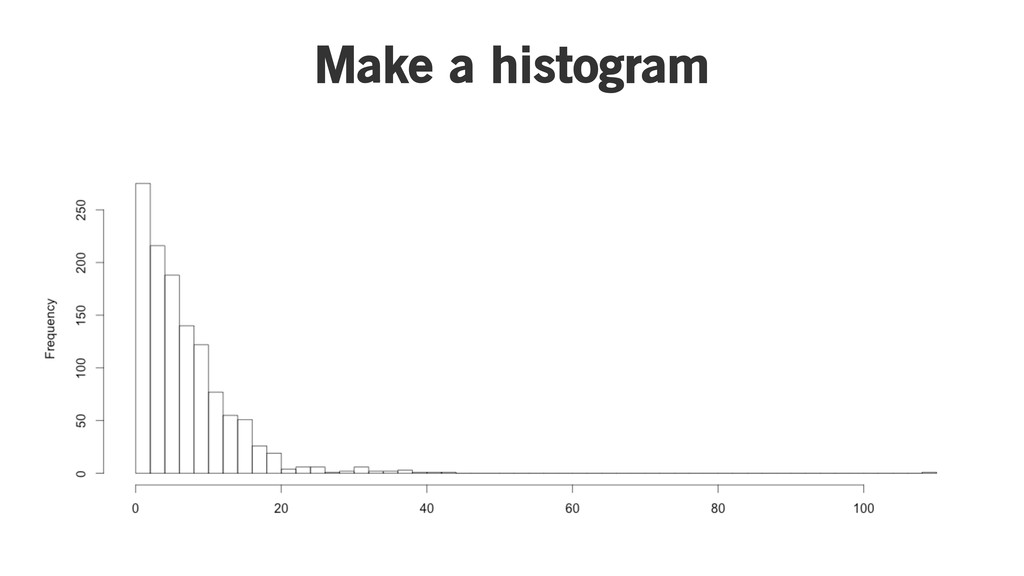
Make a histogram
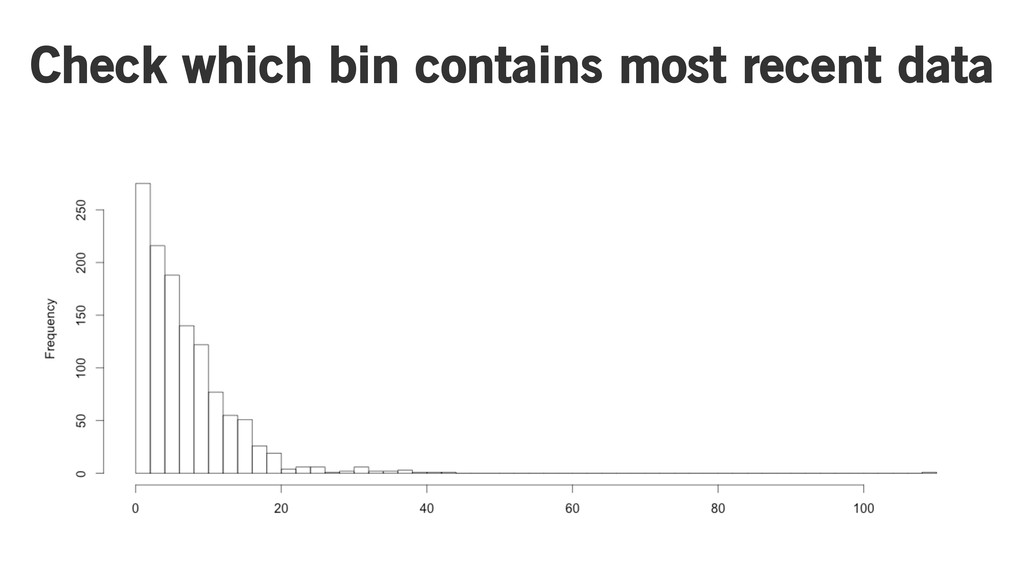
Check which bin contains most recent data
Check which bin contains most recent data latest value is
40, tiny bin size, so...anomaly!
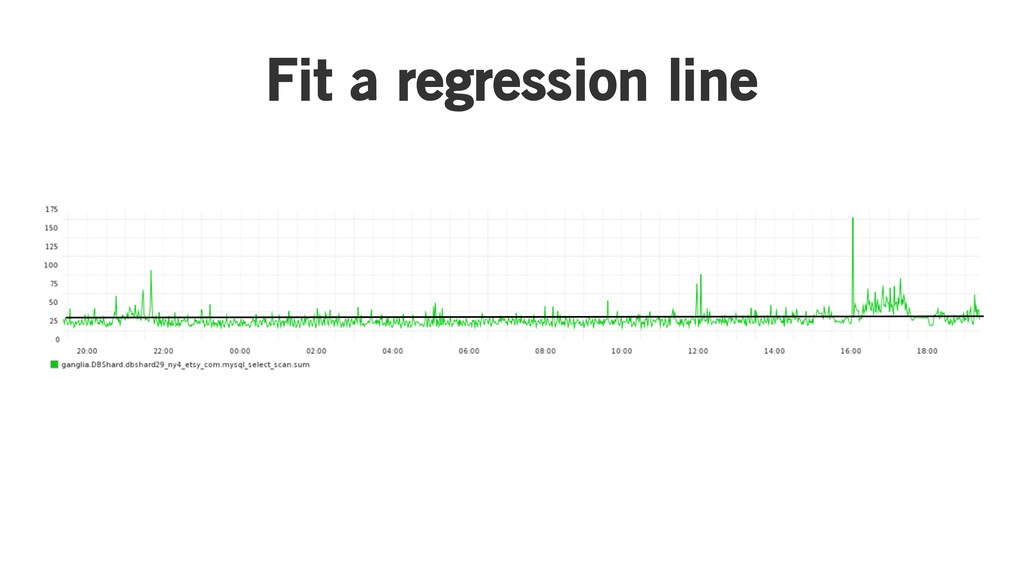
Ordinary least squares
Take some data
Fit a regression line
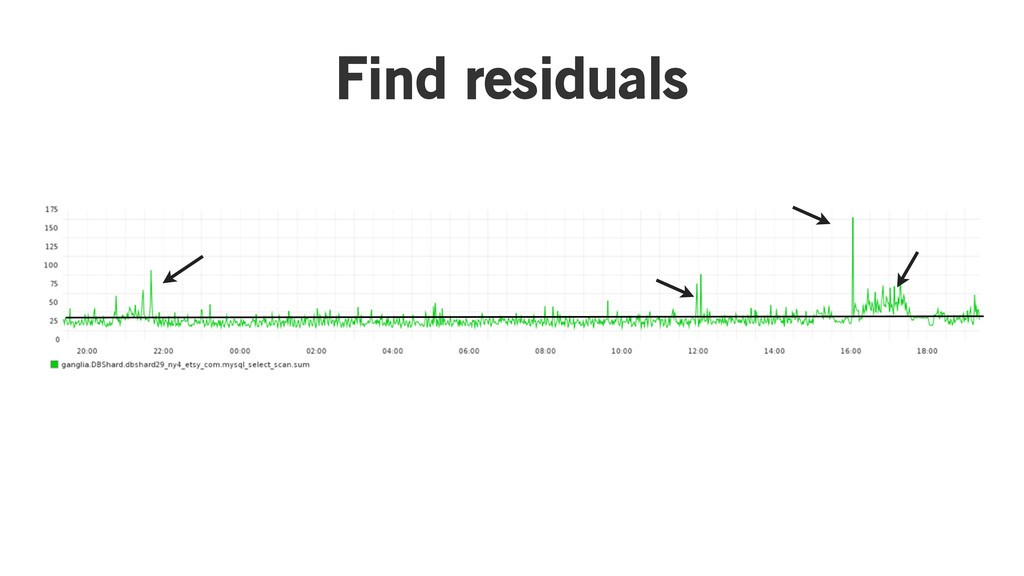
Find residuals
Three sigma winner!
Median absolute deviation
Median absolute deviation (calculate residuals with respect to median instead
of regression line)
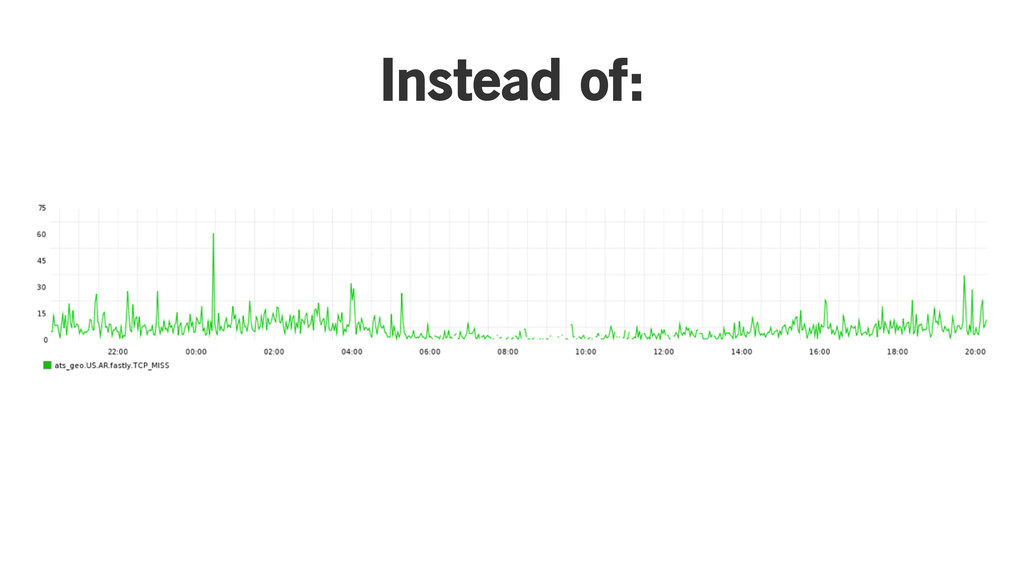
Exponentially weighted moving average
Instead of:
Add a decay factor!
These algorithms aren’t good enough.
A robust set of algorithms is the current focus of
this project.
Q). How do you analyze a quarter million timeseries for
correlations?
OCULUS
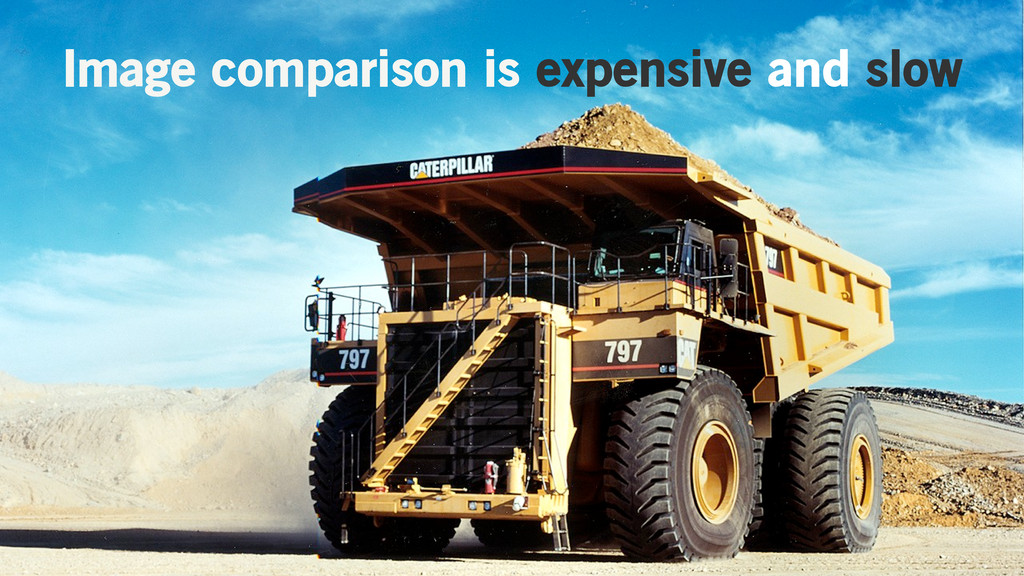
Image comparison is expensive and slow
“[[975, 1365528530], [643, 1365528540], [750, 1365528550], [992, 1365528560], [580, 1365528570],
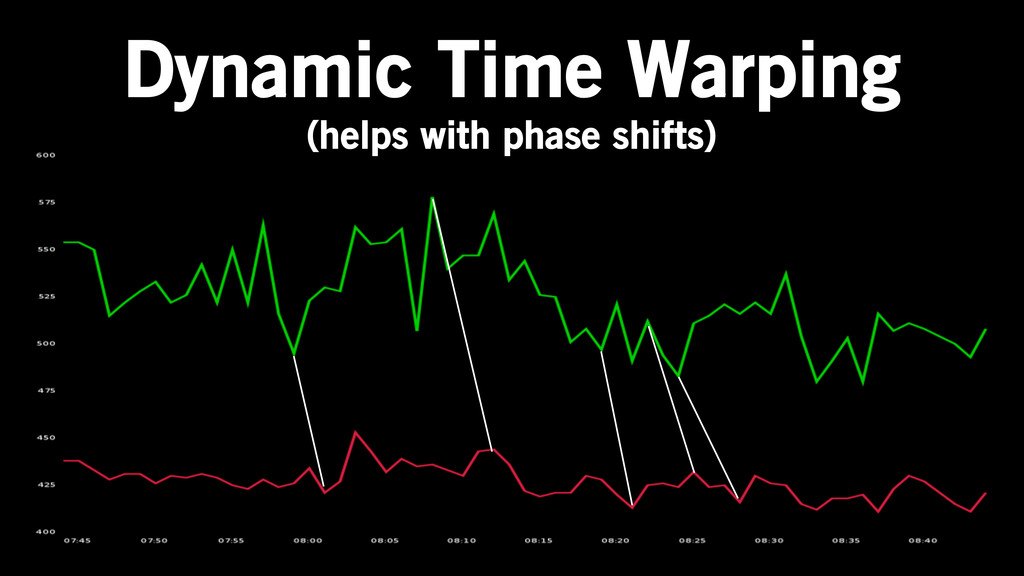
[586, 1365528580], [649, 1365528590], [548, 1365528600], [901, 1365528610], [633, 1365528620]]” Use raw timeseries instead of raw graphs
Euclidian Distance
Dynamic Time Warping (helps with phase shifts)
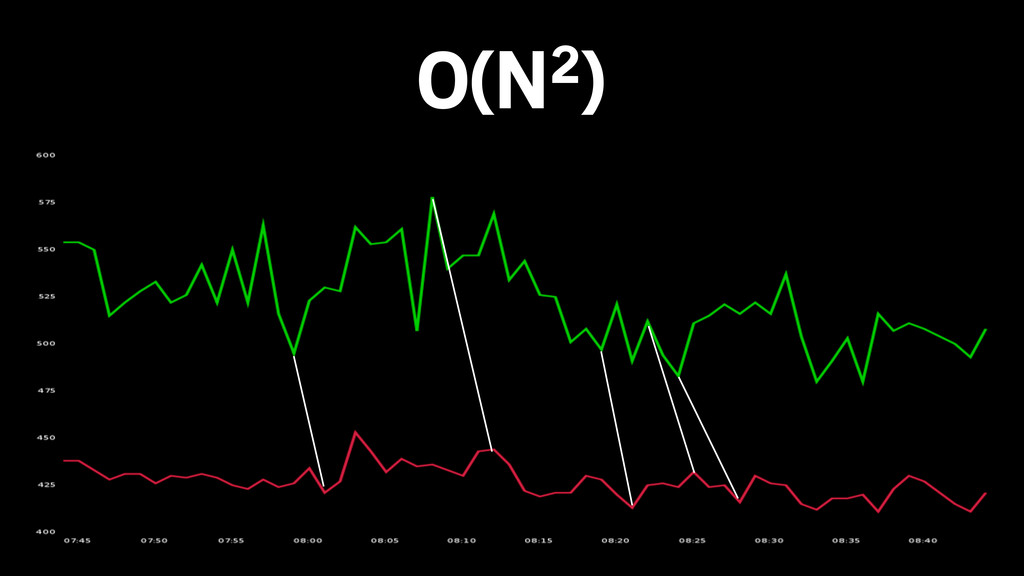
We’ve solved it!
O(N2)
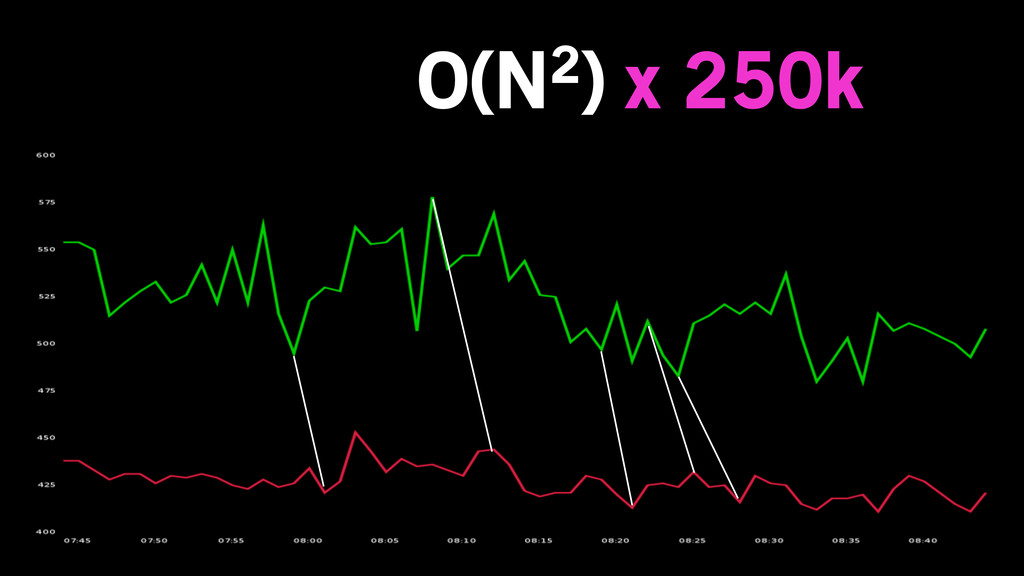
O(N2) x 250k
Too slow!
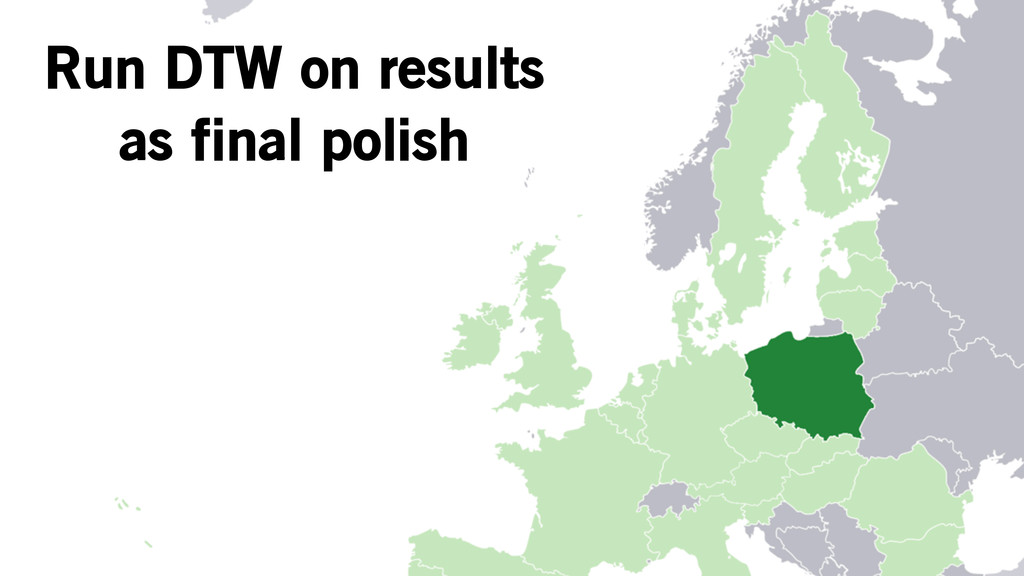
No need to run DTW on all 250k.
Discard obviously dissimilar metrics.
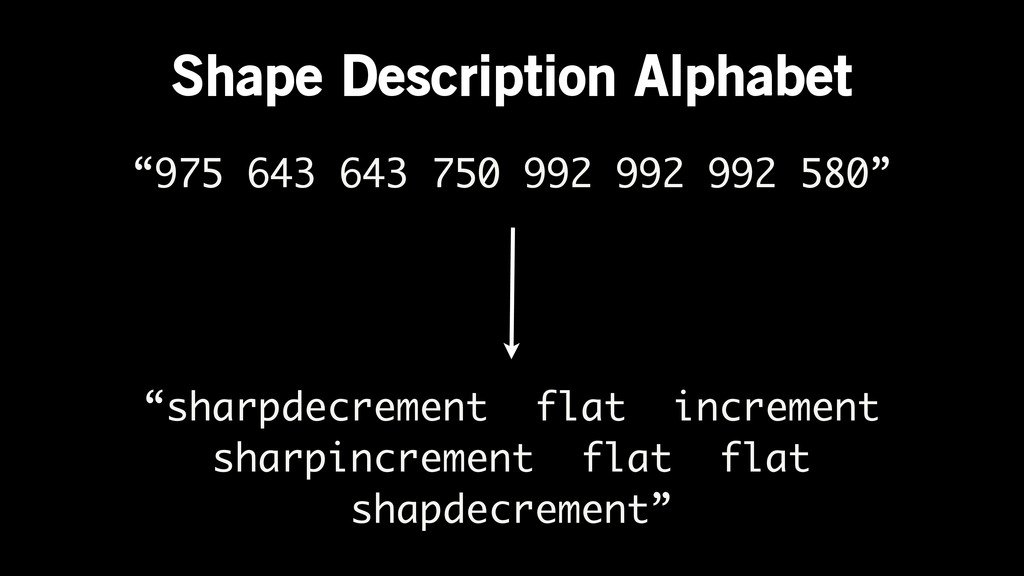
“975 643 643 750 992 992 992 580” “sharpdecrement flat
increment sharpincrement flat flat shapdecrement” Shape Description Alphabet
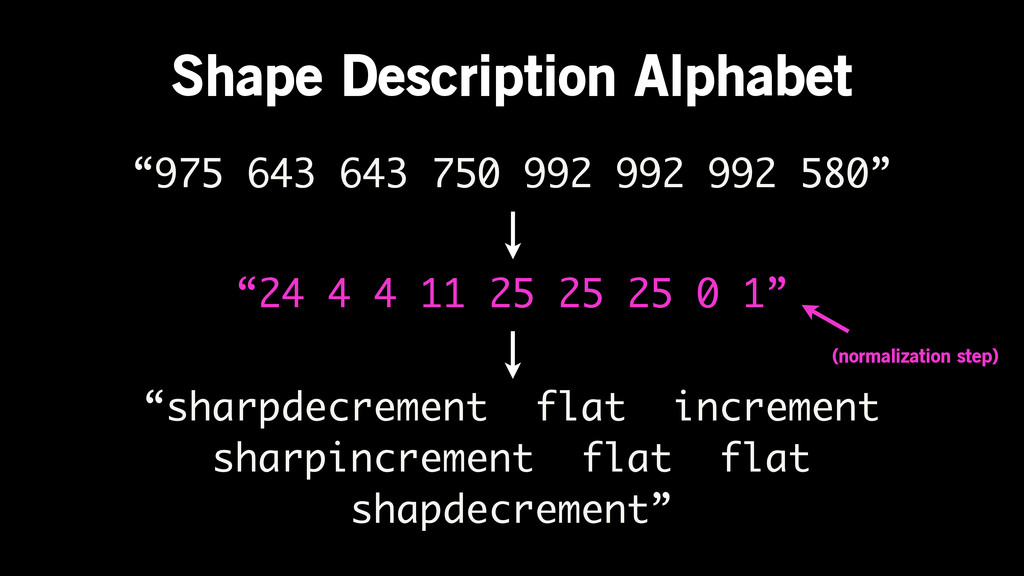
“975 643 643 750 992 992 992 580” “sharpdecrement flat
increment sharpincrement flat flat shapdecrement” Shape Description Alphabet “24 4 4 11 25 25 25 0 1” (normalization step)
None
Search for shape description fingerprint in Elasticsearch
Run DTW on results as final polish
O(N2) on ~10k metrics
Still too slow.
Fast DTW - O(N) similar strategy - coarse, then refine
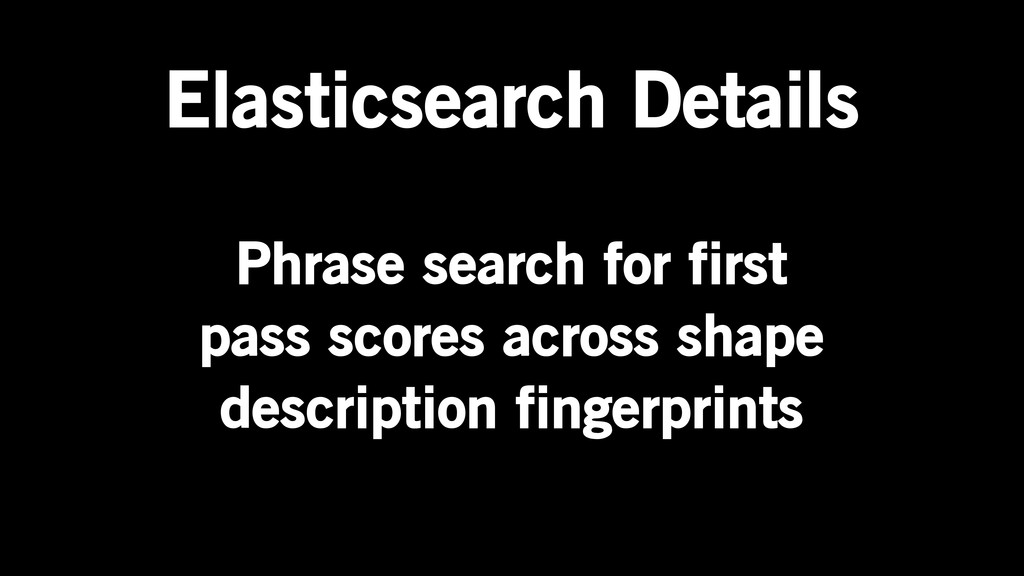
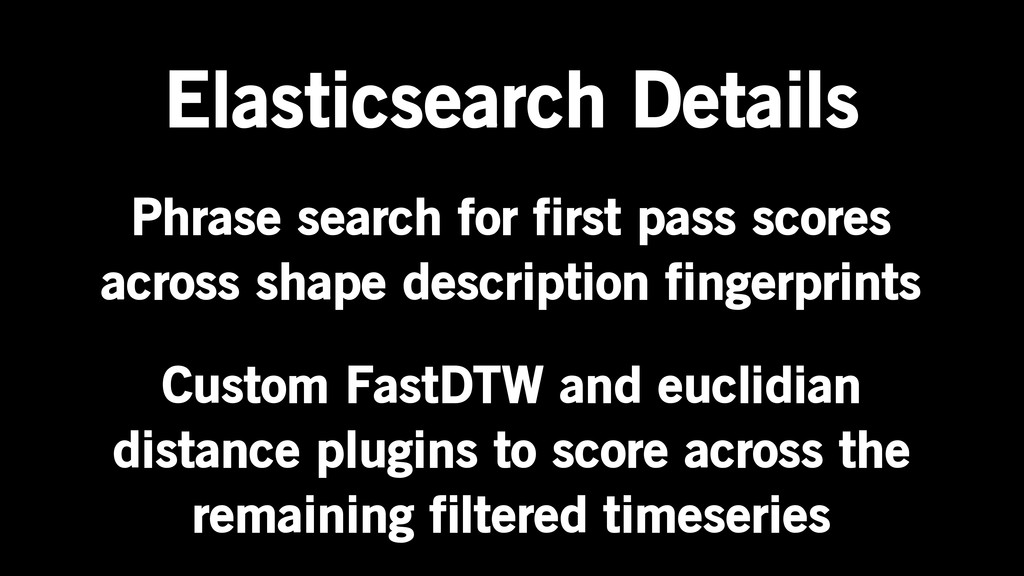
Elasticsearch Details Phrase search for first pass scores across shape
description fingerprints
Elasticsearch Details Phrase search for first pass scores across shape
description fingerprints Custom FastDTW and euclidian distance plugins to score across the remaining filtered timeseries
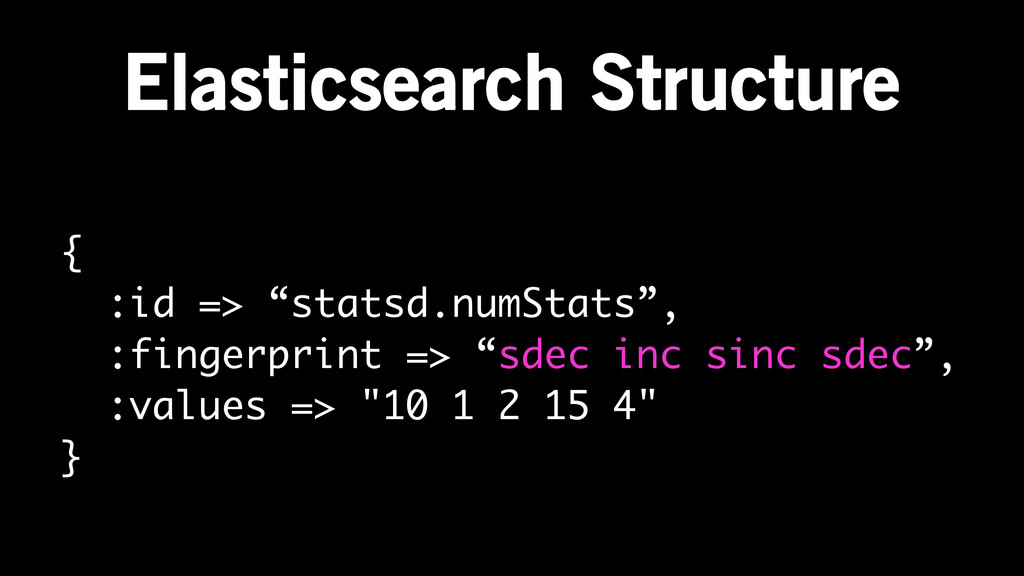
Elasticsearch Structure { :id => “statsd.numStats”, :fingerprint => “sdec inc
sinc sdec”, :values => "10 1 2 15 4" }
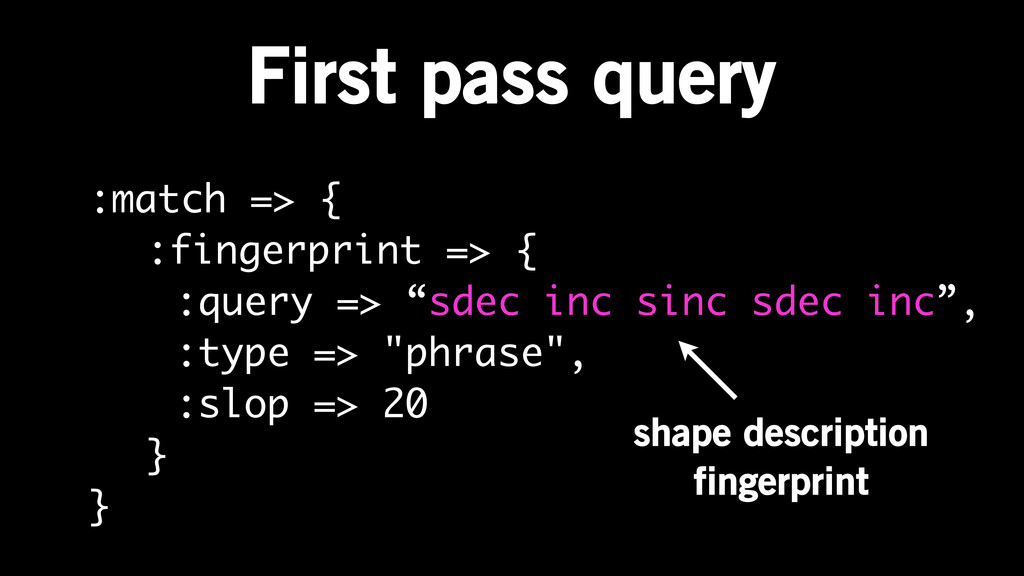
First pass query :match => { :fingerprint => { :query
=> “sdec inc sinc sdec inc”, :type => "phrase", :slop => 20 } } shape description fingerprint
Refinement query {:custom_score => { :query => <first_pass_query>, :script =>
"oculus_dtw", :params => { :query_value => “10 20 20 10 30”, :query_field => "values.untouched", }, } raw timeseries
Skyline Elasticsearch Resque Sinatra Ganglia Graphite StatsD KALE Flask
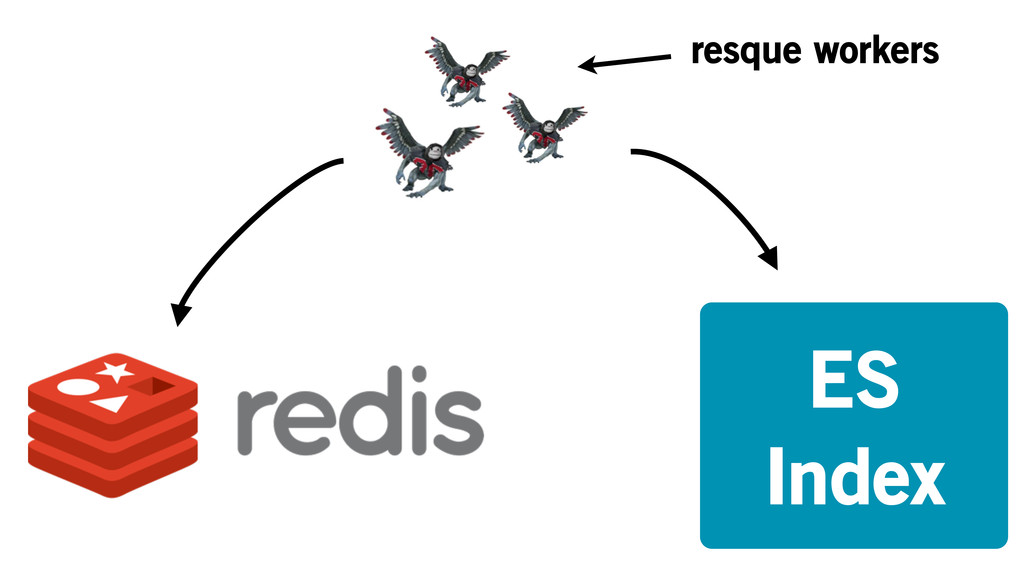
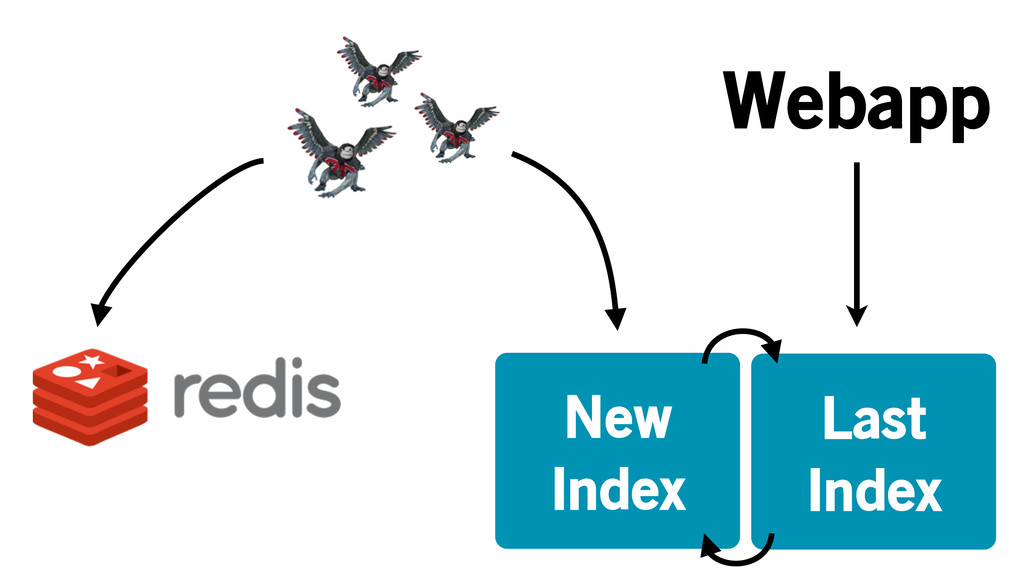
Populating Elasticsearch
ES Index resque workers
Too slow to update and search
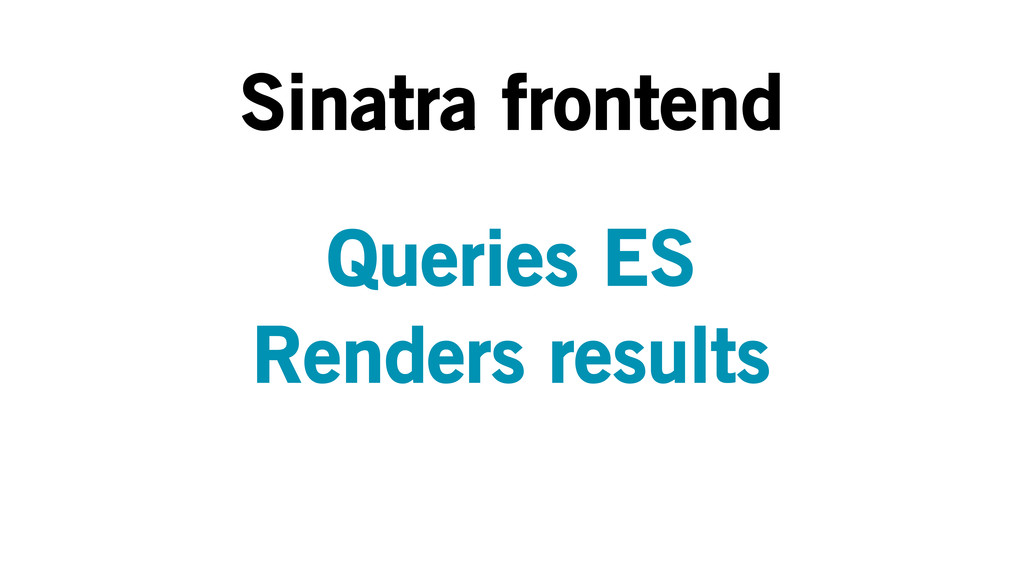
New Index Last Index Webapp
Sinatra frontend Queries ES Renders results
Happy monitoring. @abestanway github.com/etsy/skyline github.com/etsy/oculus
![Graphite’s relay agent original graphite backup graphite [statsd.numStats, [1365603422, 82345]]](https://files.speakerdeck.com/presentations/a13aafb007b1013147ca6a5d3242ec61/slide_21.jpg)
![Graphite’s relay agent original graphite skyline [statsd.numStats, [1365603422, 82345]] pickles](https://files.speakerdeck.com/presentations/a13aafb007b1013147ca6a5d3242ec61/slide_22.jpg)
![“[1358711400, 51],” => get statsD.numStats ----------------------------](https://files.speakerdeck.com/presentations/a13aafb007b1013147ca6a5d3242ec61/slide_28.jpg)
![“[1358711400, 51], => get statsD.numStats ---------------------------- [1358711410, 23],”](https://files.speakerdeck.com/presentations/a13aafb007b1013147ca6a5d3242ec61/slide_29.jpg)
![“[1358711400, 51], => get statsD.numStats ---------------------------- [1358711410, 23], [1358711420, 45],”](https://files.speakerdeck.com/presentations/a13aafb007b1013147ca6a5d3242ec61/slide_30.jpg)
![[1,2]](https://files.speakerdeck.com/presentations/a13aafb007b1013147ca6a5d3242ec61/slide_32.jpg)
![[ 1 , 2 ] Stuff we care about Extra](https://files.speakerdeck.com/presentations/a13aafb007b1013147ca6a5d3242ec61/slide_33.jpg)
![[yes] [yes] [no] [no] [yes] [yes] = anomaly!](https://files.speakerdeck.com/presentations/a13aafb007b1013147ca6a5d3242ec61/slide_48.jpg)
![“[[975, 1365528530], [643, 1365528540], [750, 1365528550], [992, 1365528560], [580, 1365528570],](https://files.speakerdeck.com/presentations/a13aafb007b1013147ca6a5d3242ec61/slide_73.jpg)