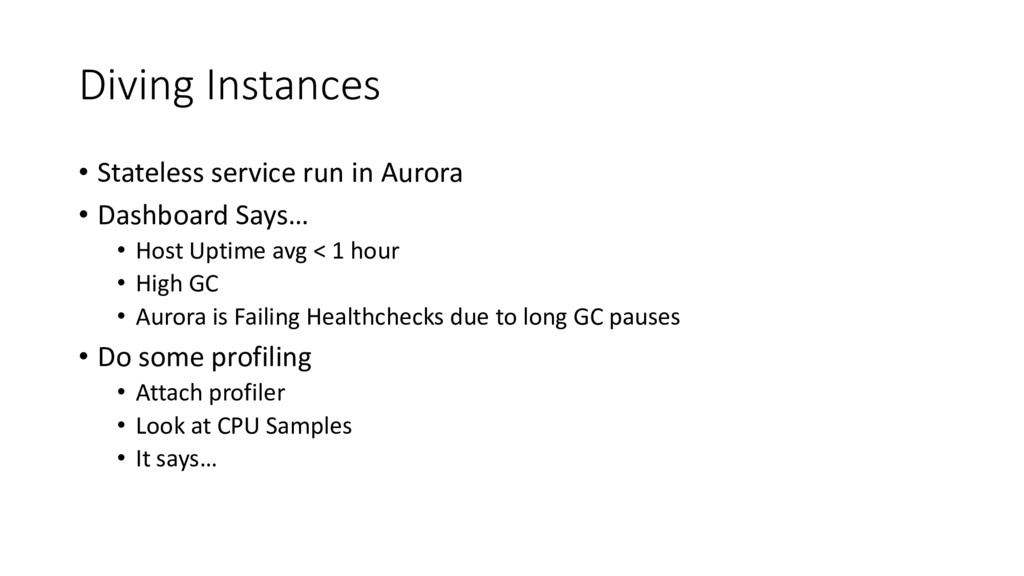
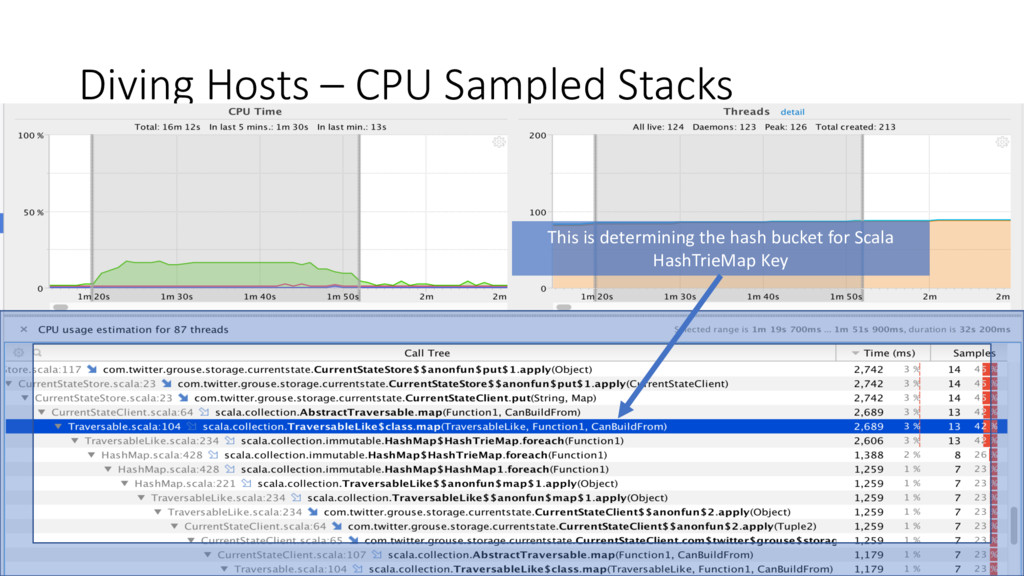
Says… • Host Uptime avg < 1 hour • High GC • Aurora is Failing Healthchecks due to long GC pauses • Do some profiling • Attach profiler • Look at CPU Samples • It says…
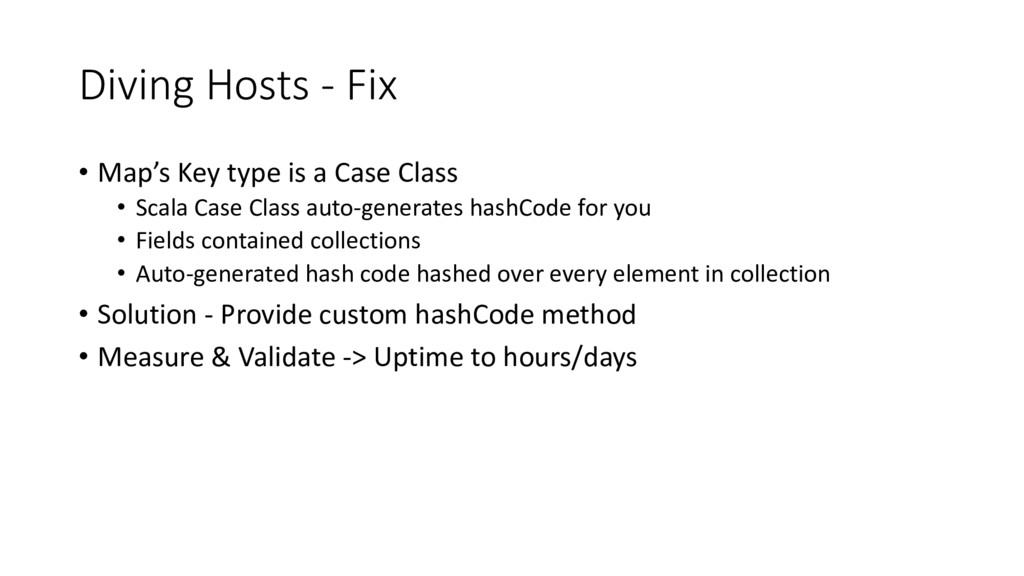
Case Class • Scala Case Class auto-generates hashCode for you • Fields contained collections • Auto-generated hash code hashed over every element in collection • Solution - Provide custom hashCode method • Measure & Validate -> Uptime to hours/days
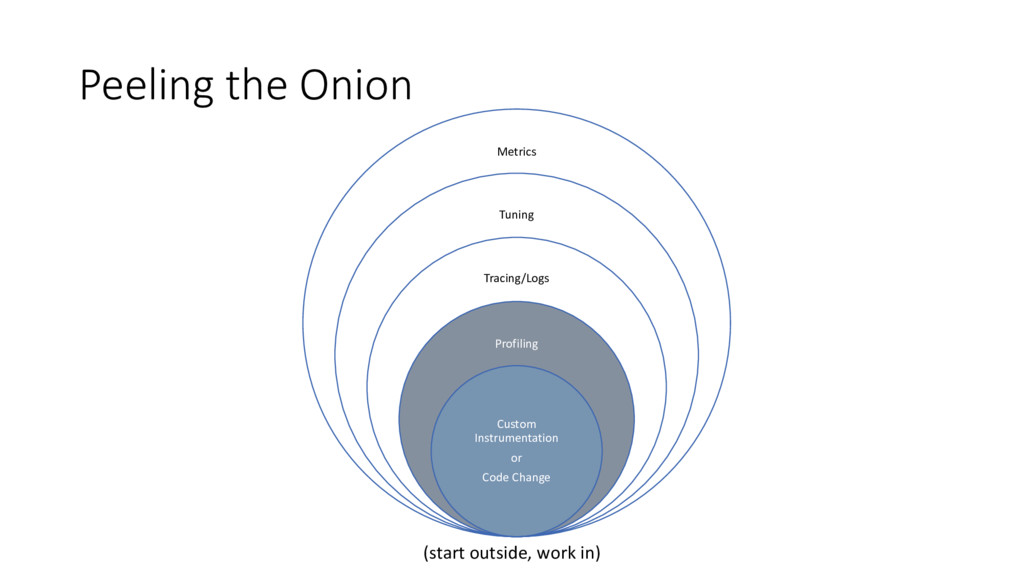
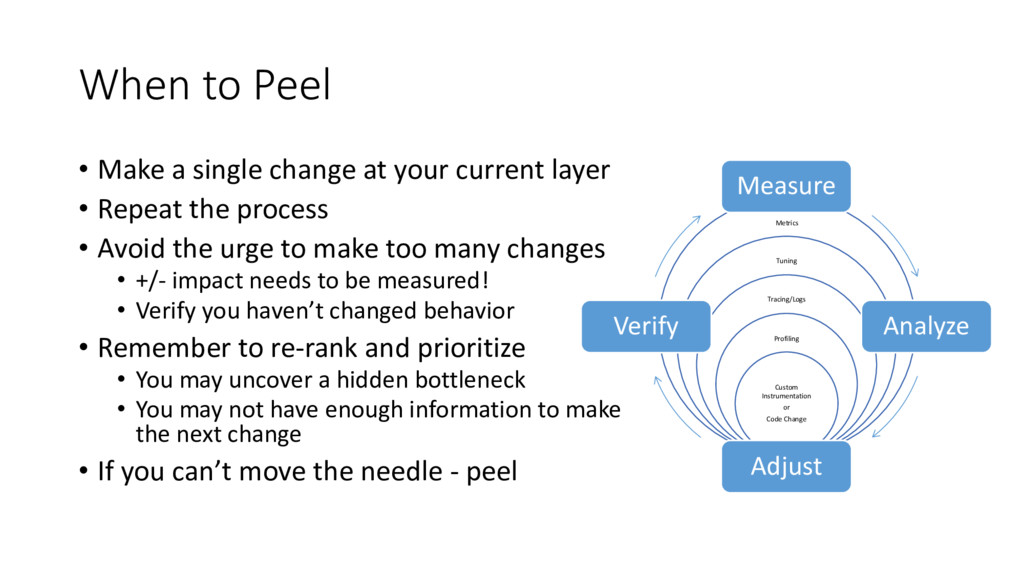
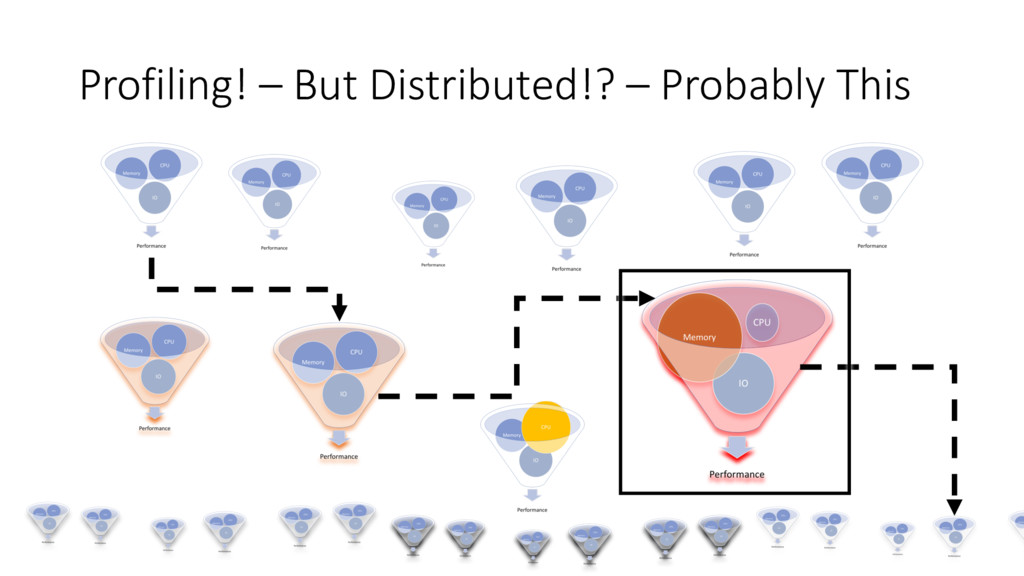
Analyze Adjust Verify When to Peel • Make a single change at your current layer • Repeat the process • Avoid the urge to make too many changes • +/- impact needs to be measured! • Verify you haven’t changed behavior • Remember to re-rank and prioritize • You may uncover a hidden bottleneck • You may not have enough information to make the next change • If you can’t move the needle - peel
sane • Performance fixes should be as isolated as possible • Don’t expose these pain points to your consumers • WHY? • Your bitmap xor bit shifting super efficient String de-duplicating object pooling concurrent Set is awesome • Your consumers shouldn’t need to know the internals of your algorithm • This code becomes very brittle and harder to work around • Your micro-optimization might become obsolete • New Library implementation could remove bottleneck • Compiler improvements could make your solution second best • Usage patterns of the application can change • Uncaught bugs
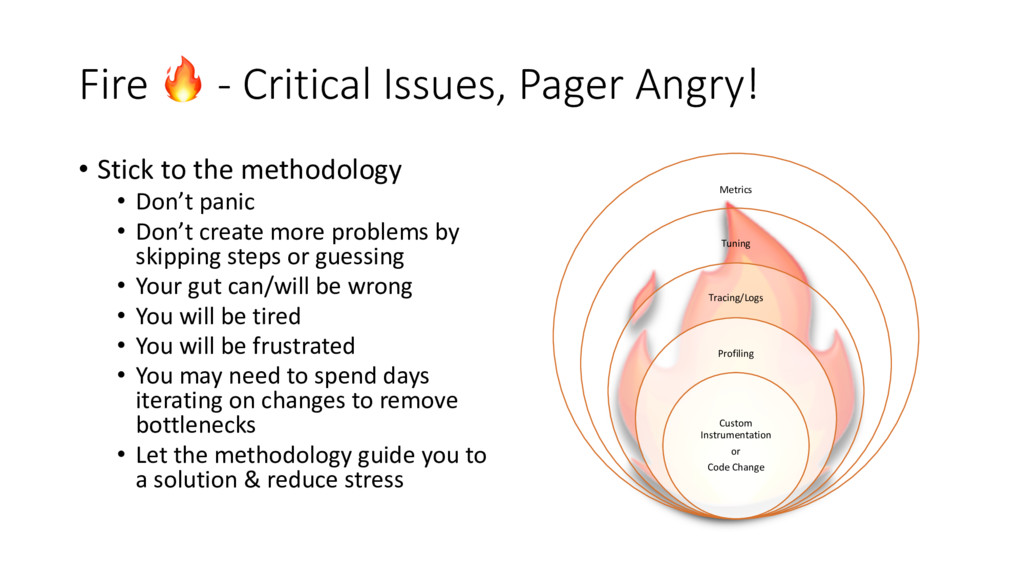
- Critical Issues, Pager Angry! • Stick to the methodology • Don’t panic • Don’t create more problems by skipping steps or guessing • Your gut can/will be wrong • You will be tired • You will be frustrated • You may need to spend days iterating on changes to remove bottlenecks • Let the methodology guide you to a solution & reduce stress
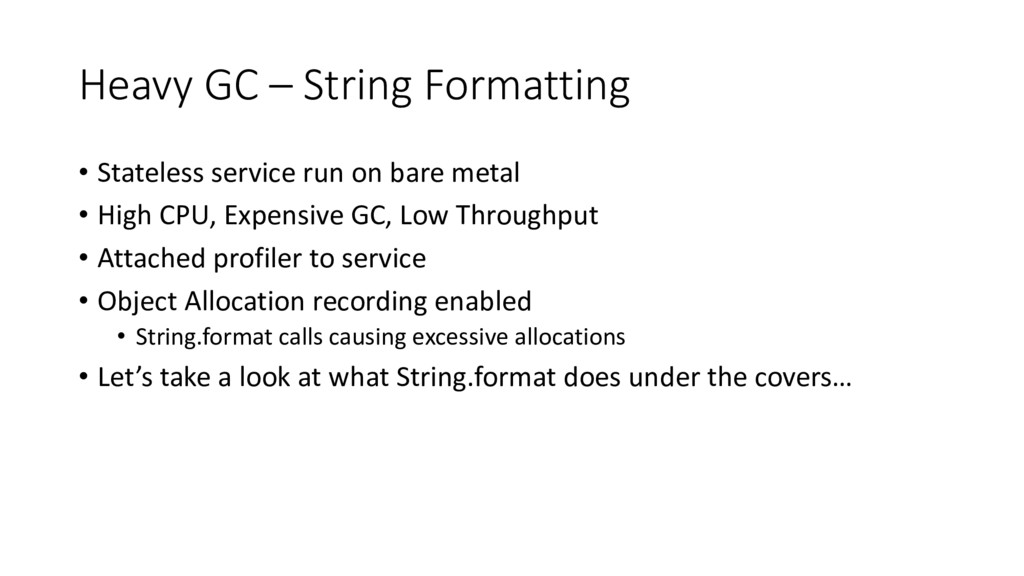
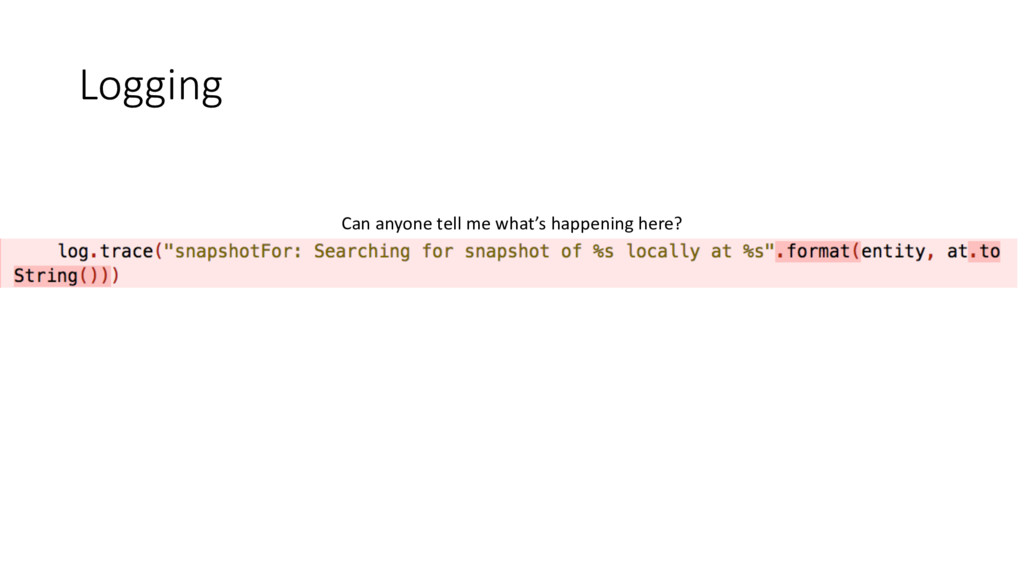
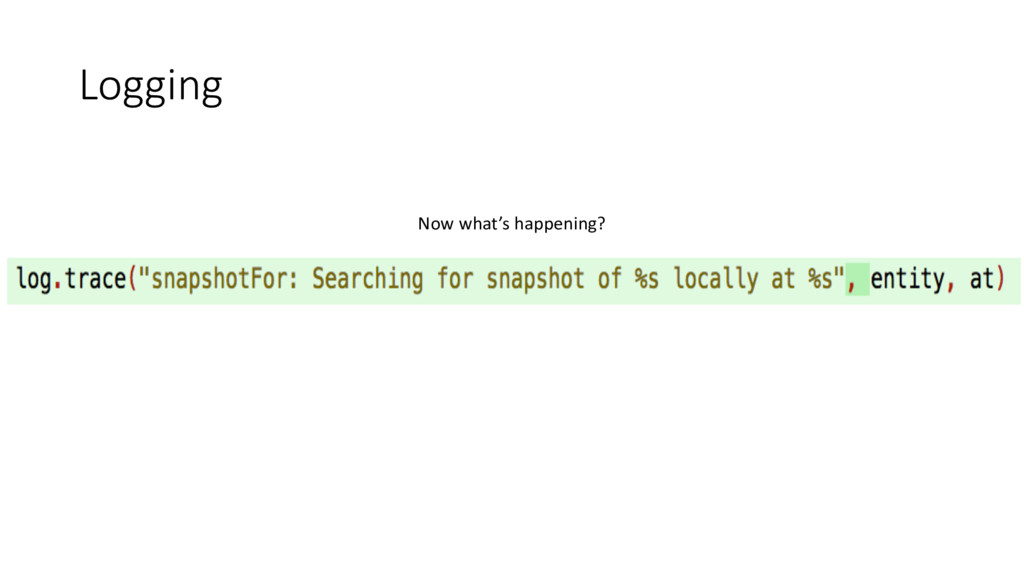
bare metal • High CPU, Expensive GC, Low Throughput • Attached profiler to service • Object Allocation recording enabled • String.format calls causing excessive allocations • Let’s take a look at what String.format does under the covers…
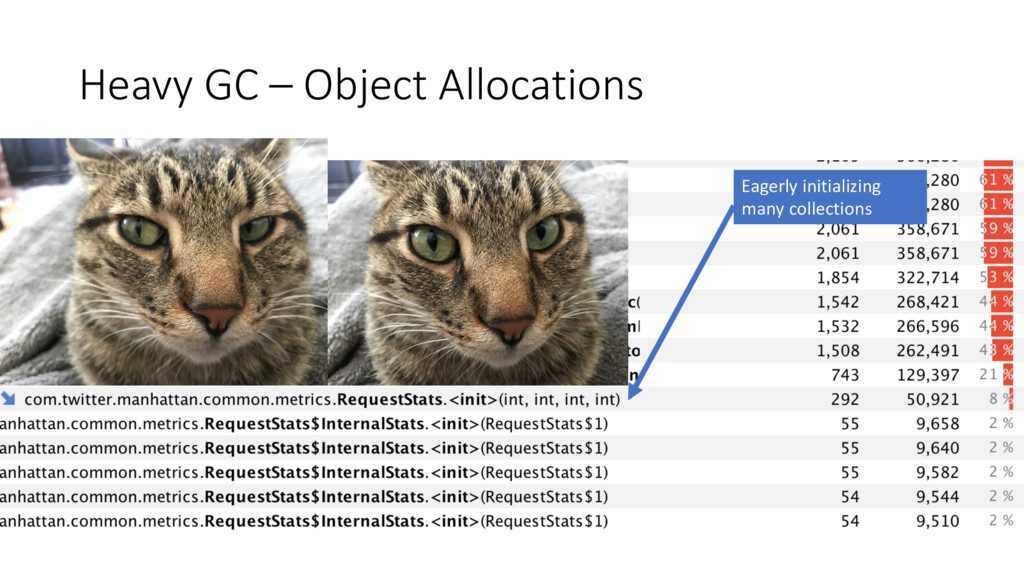
• Many sub-collections were being eagerly created • Only a small fraction of these collections were used per request cycle • Solution – Lazy Initialization • Use static immutable shared empty collection • Only on first mutation will the collection initialize • Applying these 2 fixes increased capacity for our distributed Key/Value service (Manhattan)
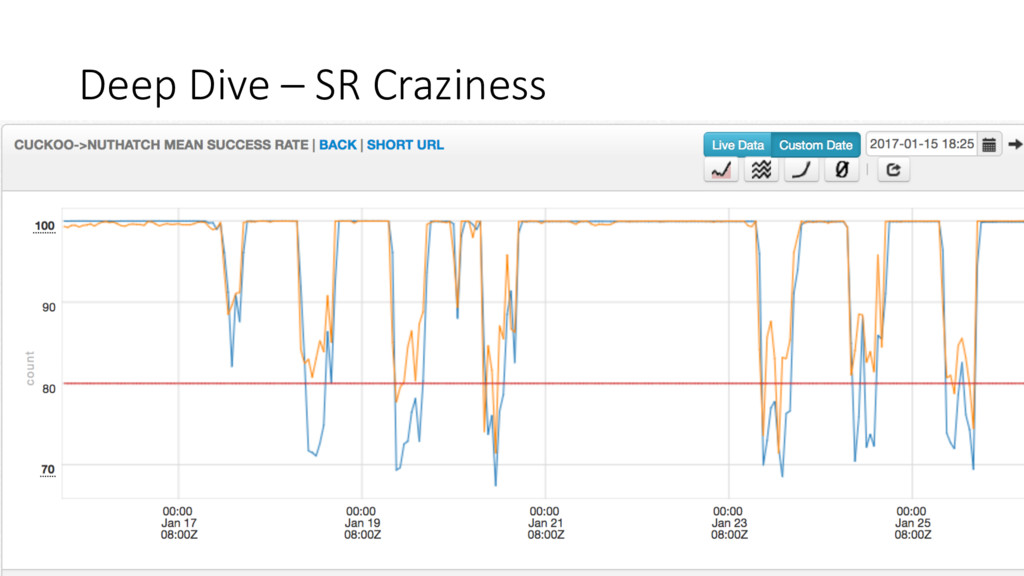
service • The Logging Fix we went over was also part of this deep dive • Success Rate plummeting below 80% between 9 AM – 5 PM • Except during lunch hour!
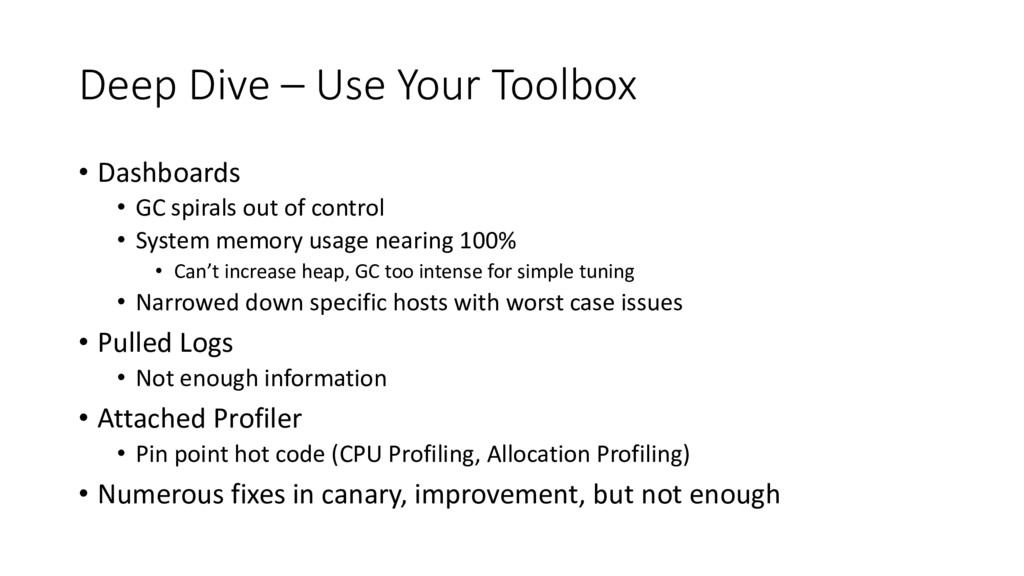
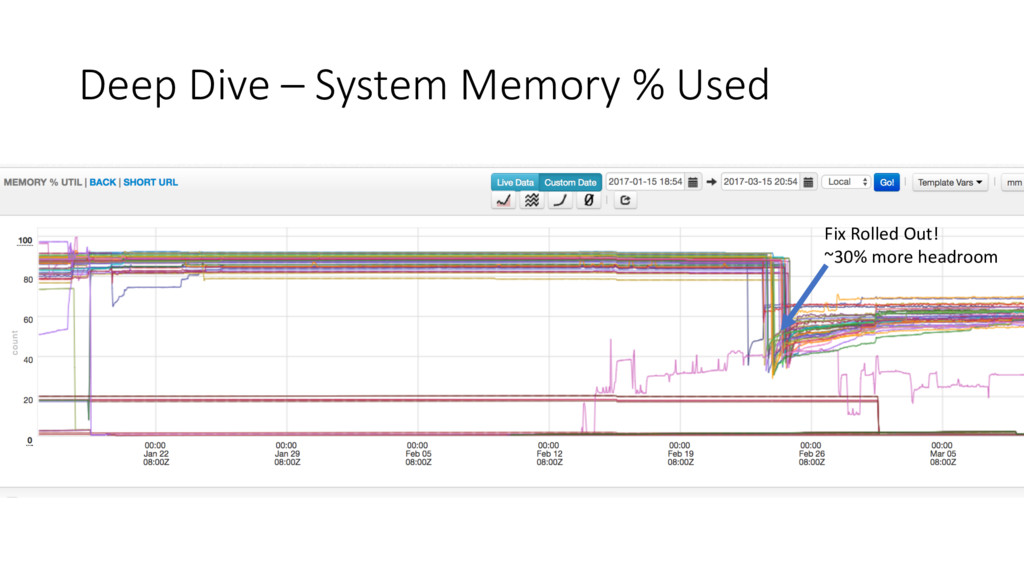
spirals out of control • System memory usage nearing 100% • Can’t increase heap, GC too intense for simple tuning • Narrowed down specific hosts with worst case issues • Pulled Logs • Not enough information • Attached Profiler • Pin point hot code (CPU Profiling, Allocation Profiling) • Numerous fixes in canary, improvement, but not enough
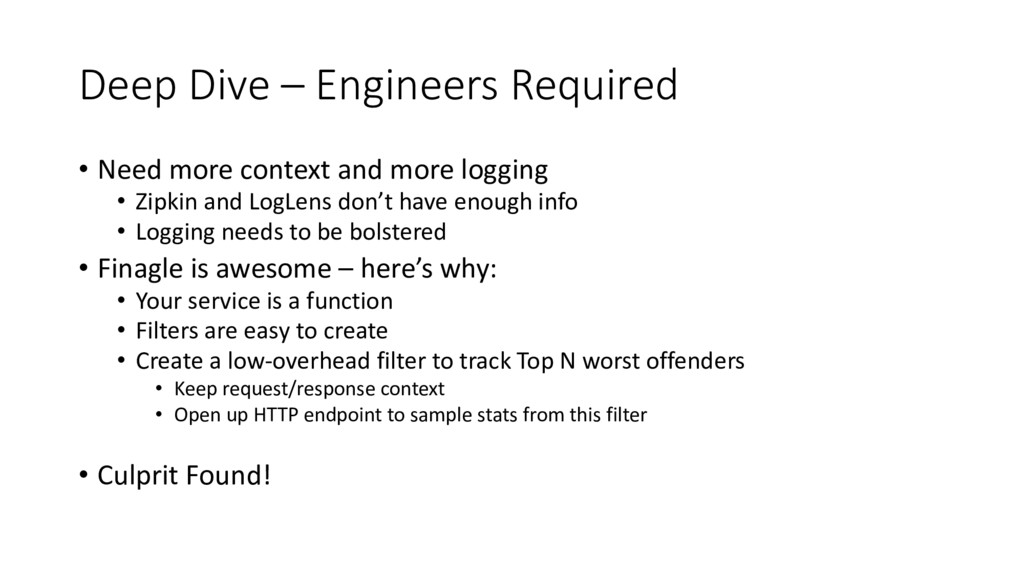
more logging • Zipkin and LogLens don’t have enough info • Logging needs to be bolstered • Finagle is awesome – here’s why: • Your service is a function • Filters are easy to create • Create a low-overhead filter to track Top N worst offenders • Keep request/response context • Open up HTTP endpoint to sample stats from this filter • Culprit Found!
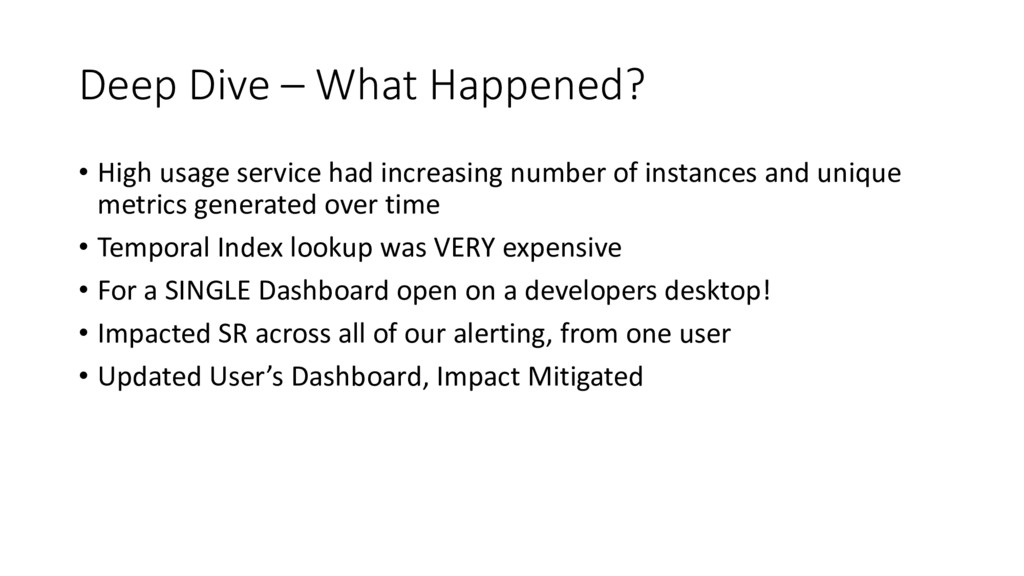
increasing number of instances and unique metrics generated over time • Temporal Index lookup was VERY expensive • For a SINGLE Dashboard open on a developers desktop! • Impacted SR across all of our alerting, from one user • Updated User’s Dashboard, Impact Mitigated
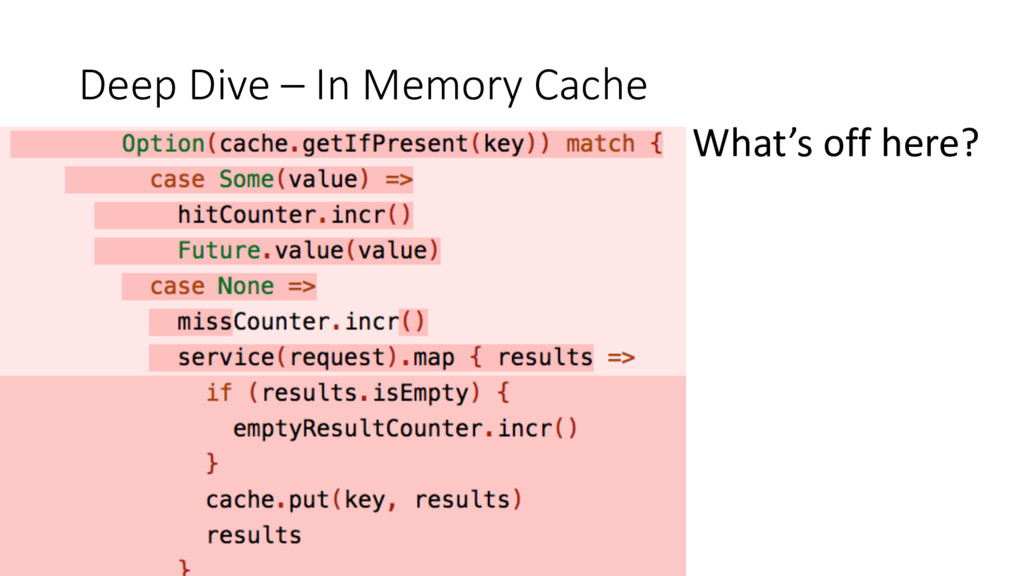
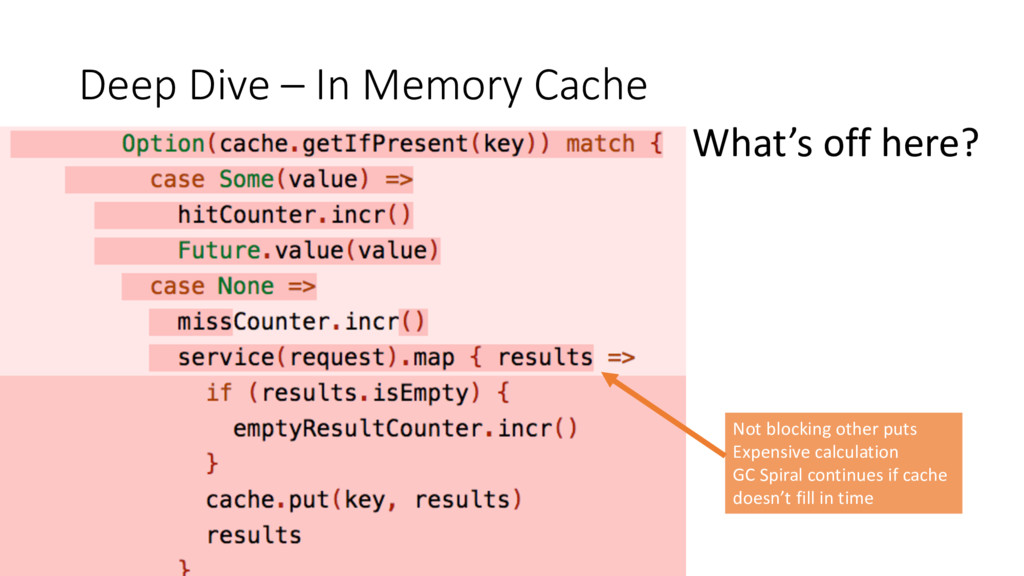
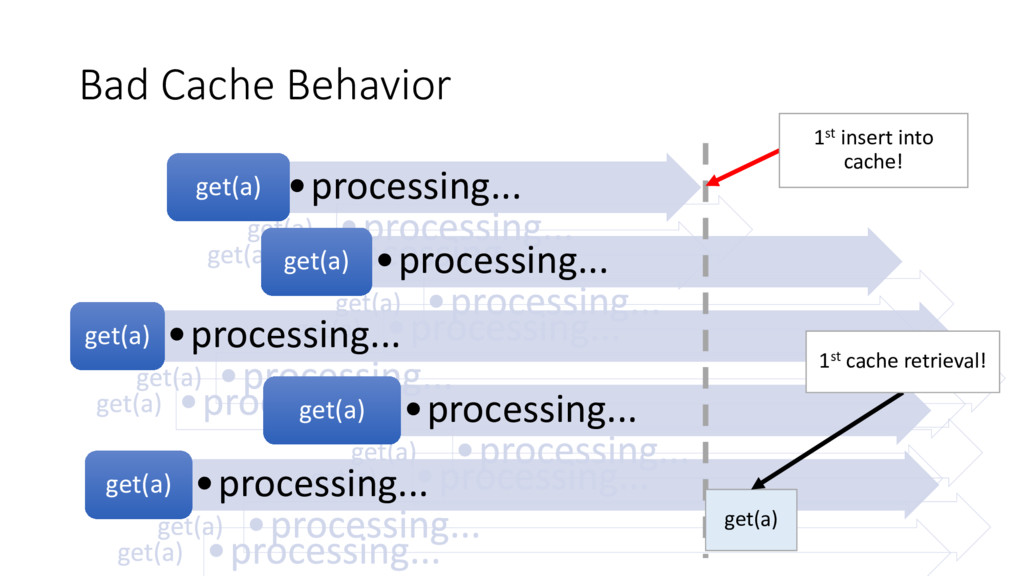
an acceptable solution • Something else is wrong here, we have caching in place • The code was reviewed, tested, improved things in the past • This shouldn’t have been a big issue
![Better Cache Behavior Future[Value] get(a) get(a) get(a) get(a) get(a) get(a)](https://files.speakerdeck.com/presentations/e84a99f5d86b4e209f5e3f6d393a0caa/slide_41.jpg)