Upgrade to Pro
— share decks privately, control downloads, hide ads and more …
Speaker Deck
Features
Speaker Deck
PRO
Sign in
Sign up for free
Search
Search
Berlin 2013 - Session - Jeff Weinstein
Search
Monitorama
September 20, 2013
670
2
Share
Embed
Copy iframe code
Copy JS code
Copy link
Start on current slide
Berlin 2013 - Session - Jeff Weinstein
Monitorama
September 20, 2013
More Decks by Monitorama
See All by Monitorama
Monitorama PDX 2017 - Ian Bennett
monitorama
1
630
PDX 2017 - Pedro Andrade
monitorama
0
830
PDX 2017 - Roy Rapoport
monitorama
4
1k
PDX 2017 - Julia Evans
monitorama
0
520
Berlin 2013 - Session - Brad Lhotsky
monitorama
5
770
Berlin 2013 - Session - Alex Petrov
monitorama
6
730
Berlin 2013 - Session - Oliver Hankeln
monitorama
1
590
Berlin 2013 - Session - David Goodlad
monitorama
0
520
Berlin 2013 - Session - Radu Gheorghe
monitorama
0
670
Featured
See All Featured
Practical Orchestrator
shlominoach
191
11k
The AI Search Optimization Roadmap by Aleyda Solis
aleyda
1
6k
ピンチをチャンスに:未来をつくるプロダクトロードマップ #pmconf2020
aki_iinuma
128
56k
Code Reviewing Like a Champion
maltzj
528
40k
Reality Check: Gamification 10 Years Later
codingconduct
0
2.2k
Building Applications with DynamoDB
mza
96
7.1k
What Being in a Rock Band Can Teach Us About Real World SEO
427marketing
0
1k
Everyday Curiosity
cassininazir
0
250
B2B Lead Gen: Tactics, Traps & Triumph
marketingsoph
0
170
Leveraging LLMs for student feedback in introductory data science courses - posit::conf(2025)
minecr
1
310
GitHub's CSS Performance
jonrohan
1033
470k
A Soul's Torment
seathinner
6
3k
Transcript
How monitoring can improve the rest of the company
Monitorama EU 2013 @jeff_weinstein
I real-time and batch data analytics
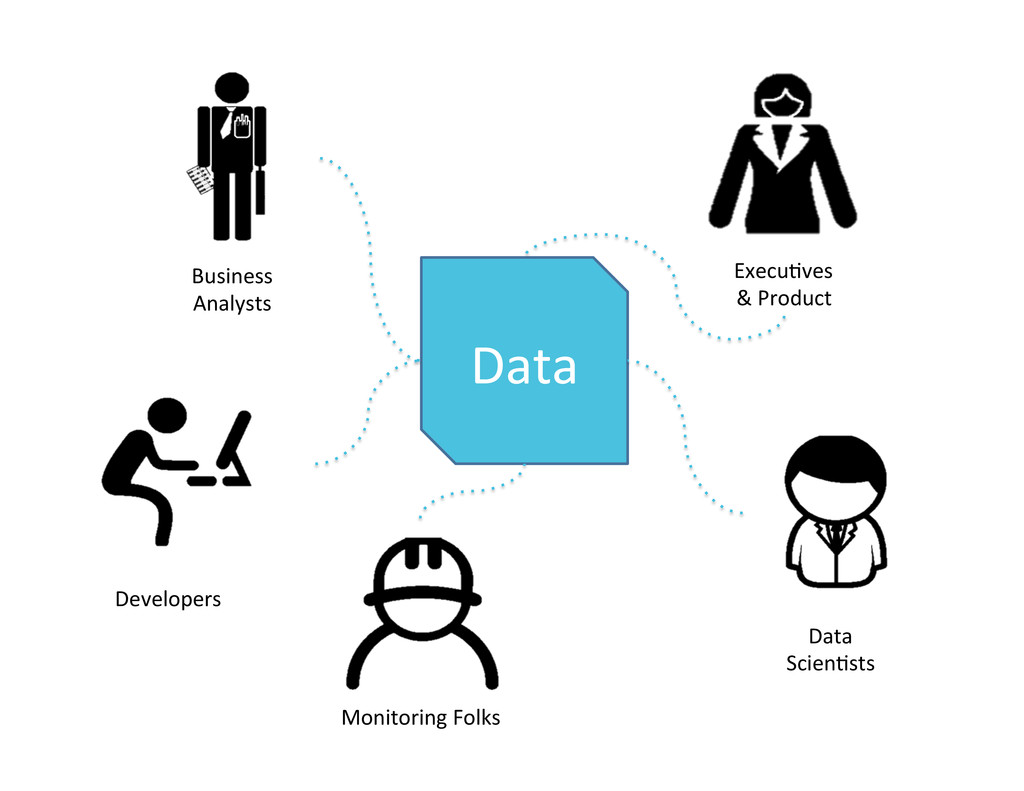
Monitoring can wildly improve the whole company by
sharing data and sharing techniques.
Monitoring Folks Developers Business Analysts
ExecuIves & Product Data ScienIsts Data
Apps & Services & Systems Users
Data Code & Config Monitoring
Some problems…
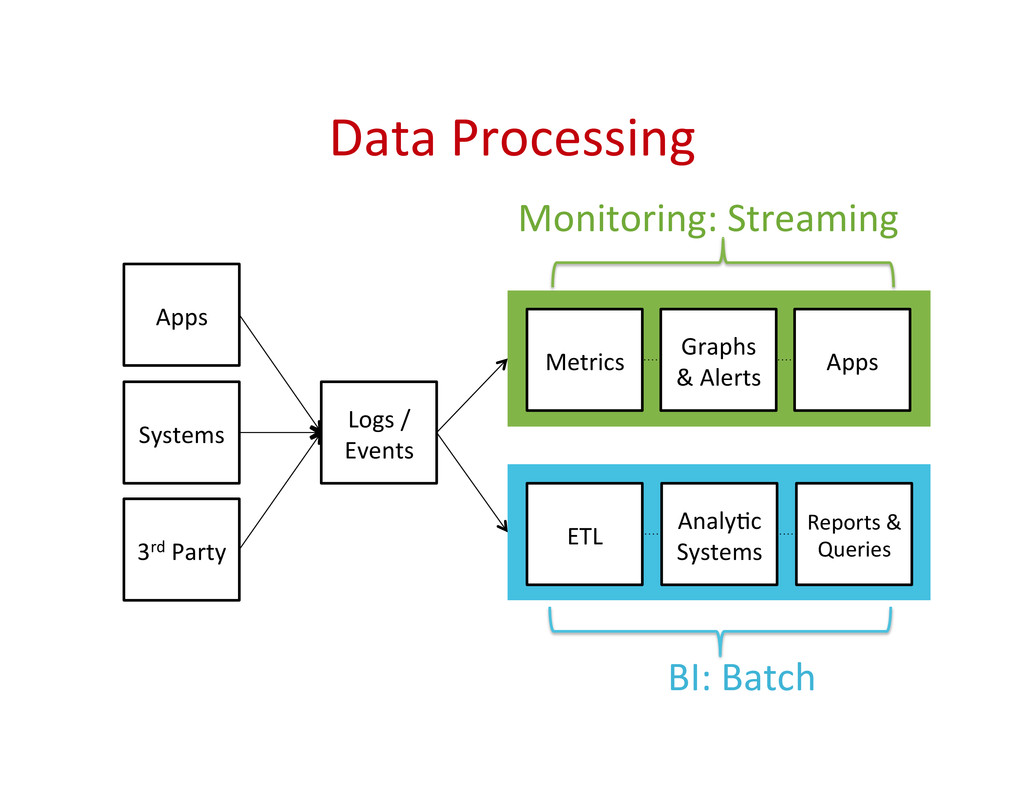
Data Processing Apps Systems Logs /
Events Metrics Graphs & Alerts Apps 3rd Party Reports & Queries ETL AnalyIc Systems Monitoring: Streaming BI: Batch
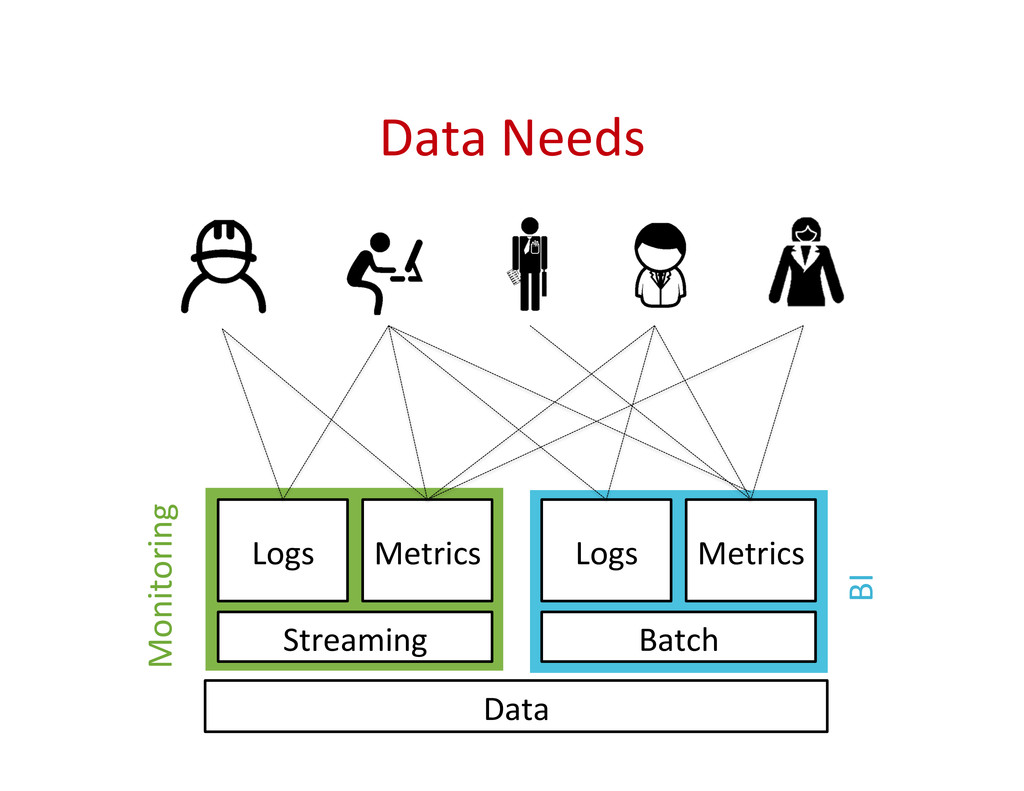
Data Needs Logs Metrics Logs Metrics
Streaming Batch Data Monitoring BI
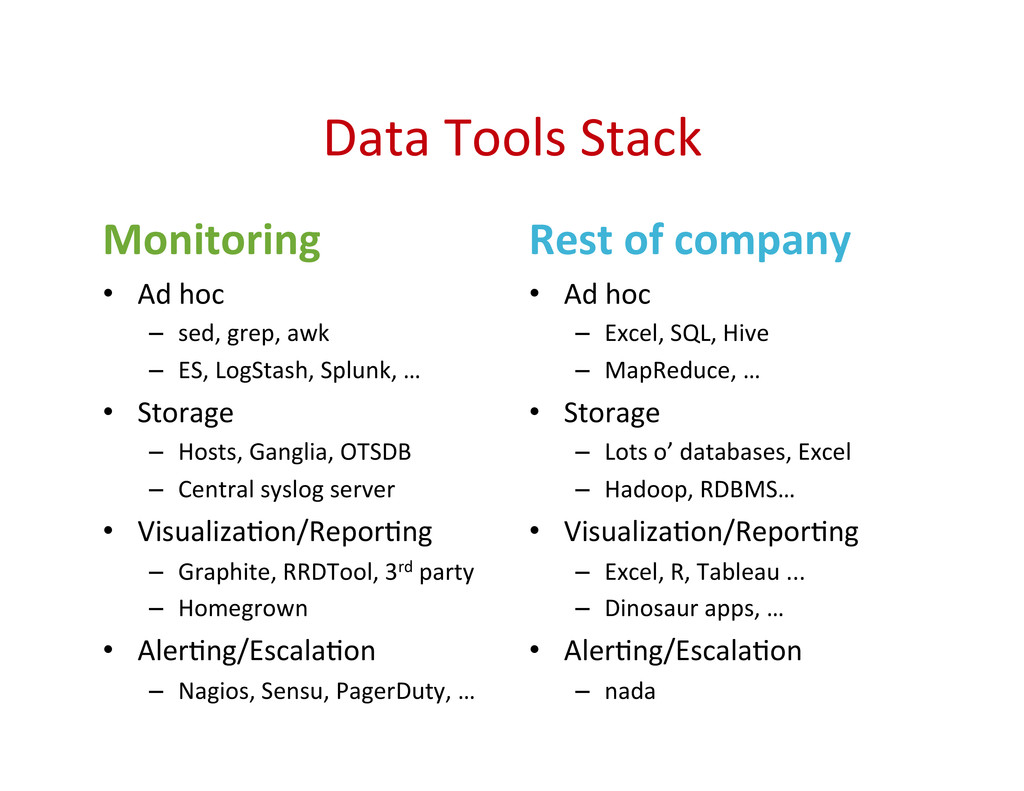
Data Tools Stack Monitoring • Ad hoc
– sed, grep, awk – ES, LogStash, Splunk, … • Storage – Hosts, Ganglia, OTSDB – Central syslog server • VisualizaIon/ReporIng – Graphite, RRDTool, 3rd party – Homegrown • AlerIng/EscalaIon – Nagios, Sensu, PagerDuty, … Rest of company • Ad hoc – Excel, SQL, Hive – MapReduce, … • Storage – Lots o’ databases, Excel – Hadoop, RDBMS… • VisualizaIon/ReporIng – Excel, R, Tableau ... – Dinosaur apps, … • AlerIng/EscalaIon – nada
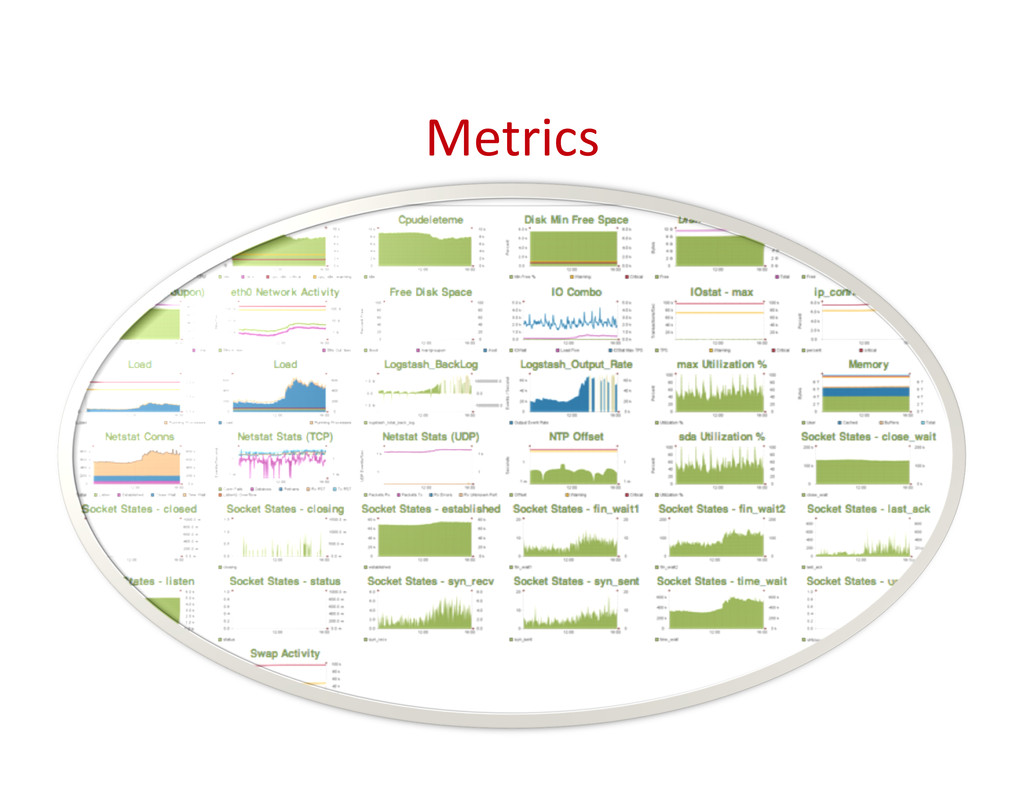
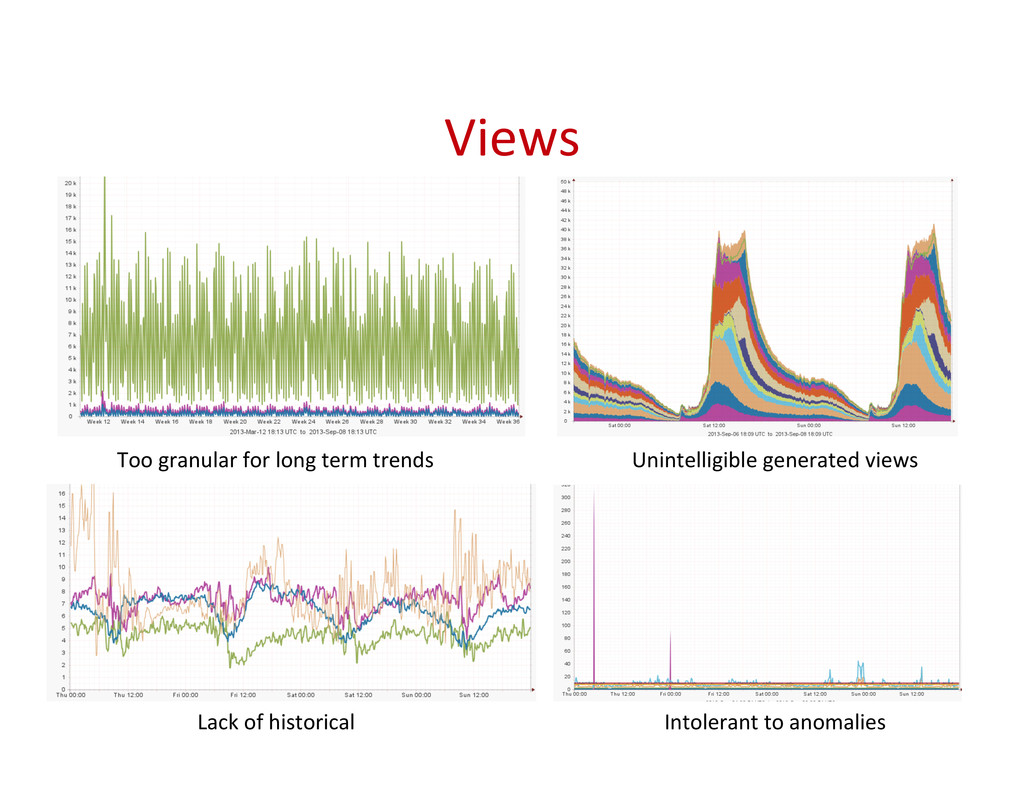
Metrics
Views Unintelligible generated views Too granular for long
term trends Lack of historical Intolerant to anomalies
Team and incenIves • What team? • Change
vs. reliability • Planning • Budget • Churn
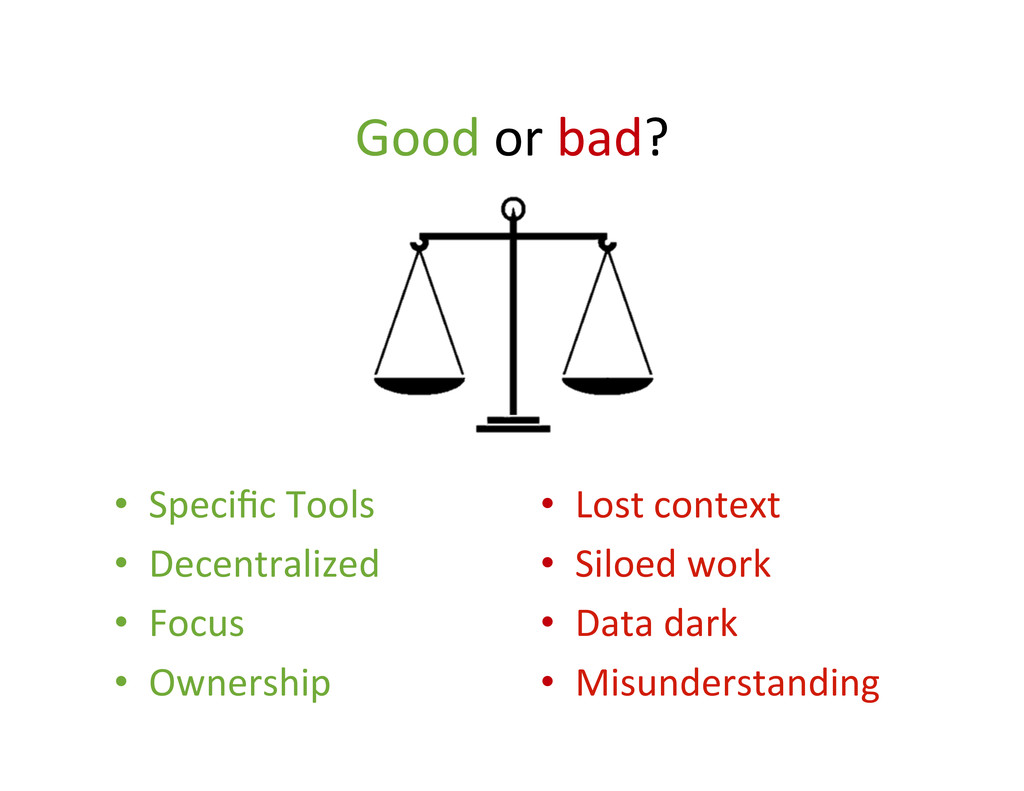
Good or bad? • Specific Tools • Decentralized
• Focus • Ownership • Lost context • Siloed work • Data dark • Misunderstanding
Some fixes
End to End Data Pipeline ü Structured logs ü (Config)
ü Measure once ü AutomaIc metrics ü API ü Graph tools ü Glossary ü AnnotaIons and tags ü Pipeline
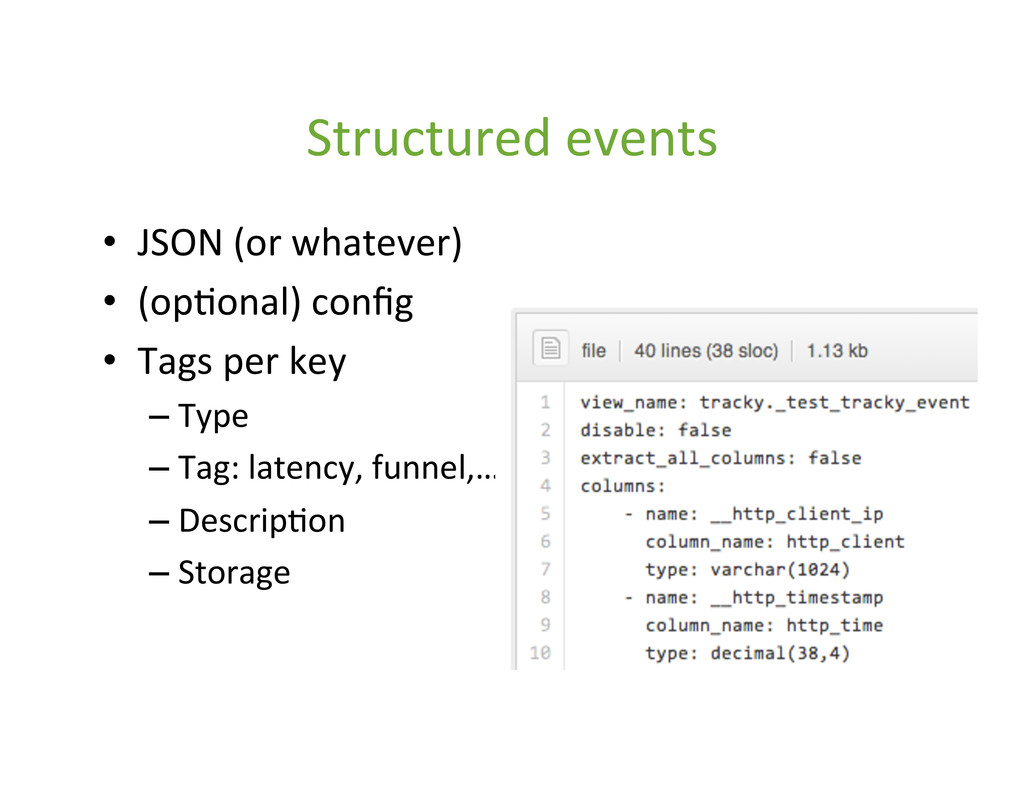
Structured events • JSON (or whatever) • (opIonal)
config • Tags per key – Type – Tag: latency, funnel,… – DescripIon – Storage
Auto: Graphs, Glossary, & Storage • Graphs and dashboards
• * templates • Views and stats • Glossary • Batch analyIcs • Long term storage
build learn communicate inspire
Developers • Logging toolkit • Data pipeline
• Pain points • Outage causes • Deployment pracIces • EscalaIon playbook • Measurement as TDD • Monitor staging env
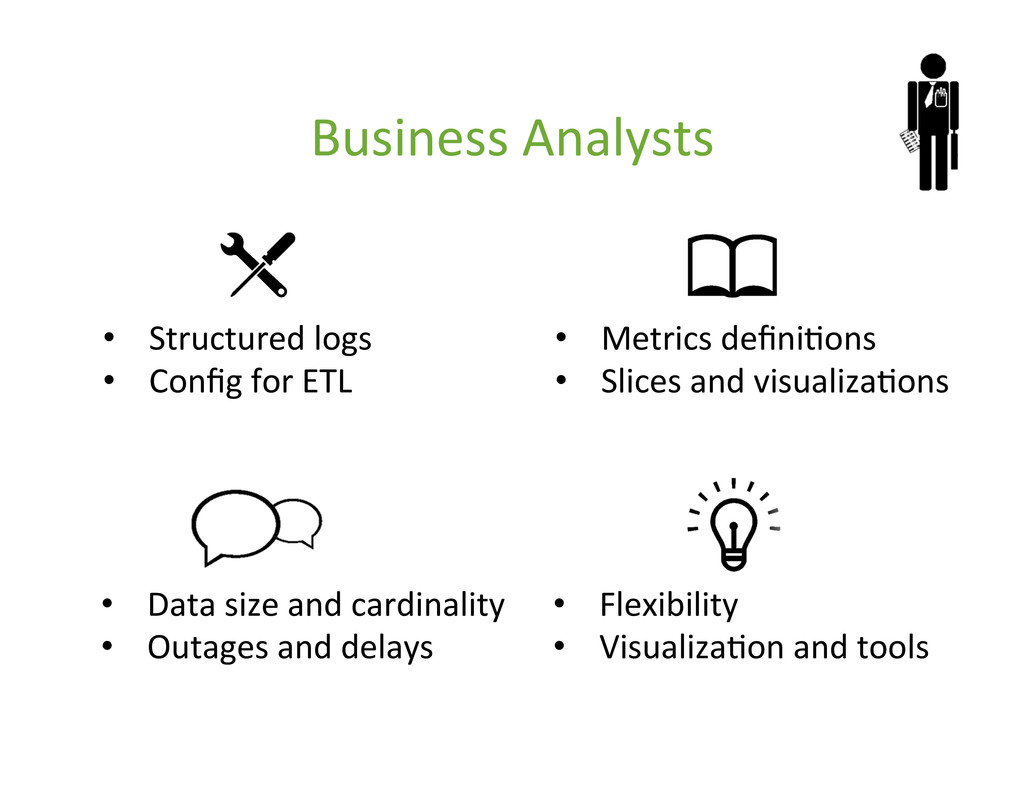
Business Analysts • Structured logs • Config
for ETL • Metrics definiIons • Slices and visualizaIons • Data size and cardinality • Outages and delays • Flexibility • VisualizaIon and tools
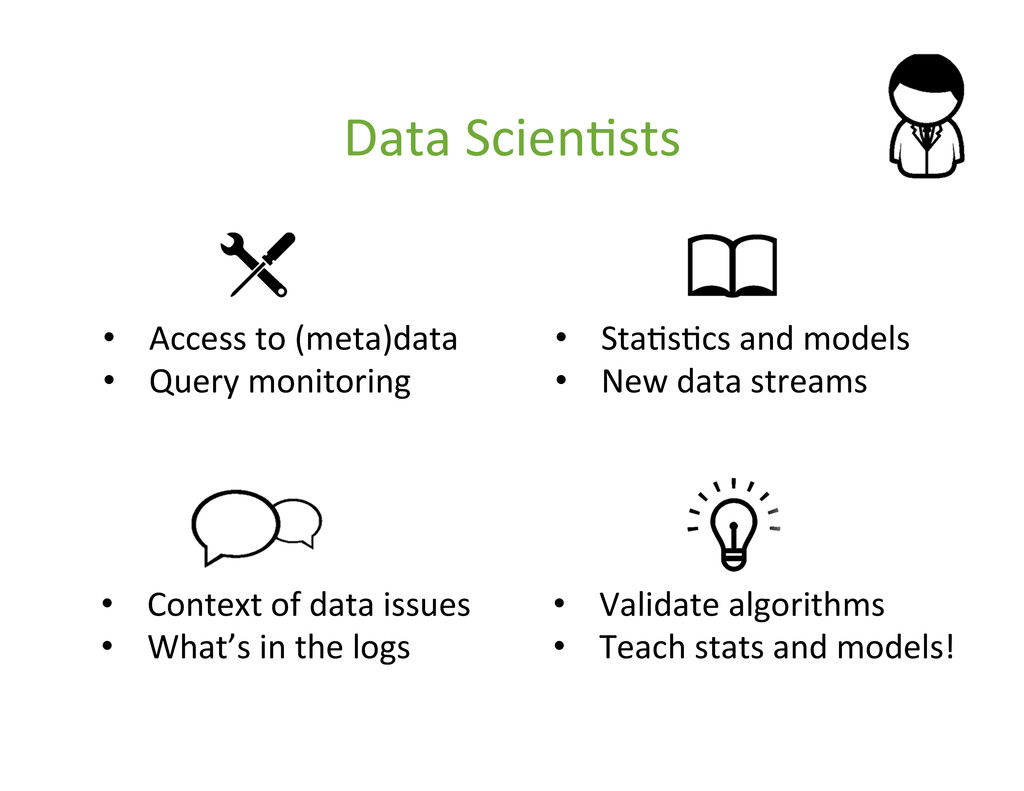
Data ScienIsts • Access to (meta)data • Query
monitoring • StaIsIcs and models • New data streams • Context of data issues • What’s in the logs • Validate algorithms • Teach stats and models!
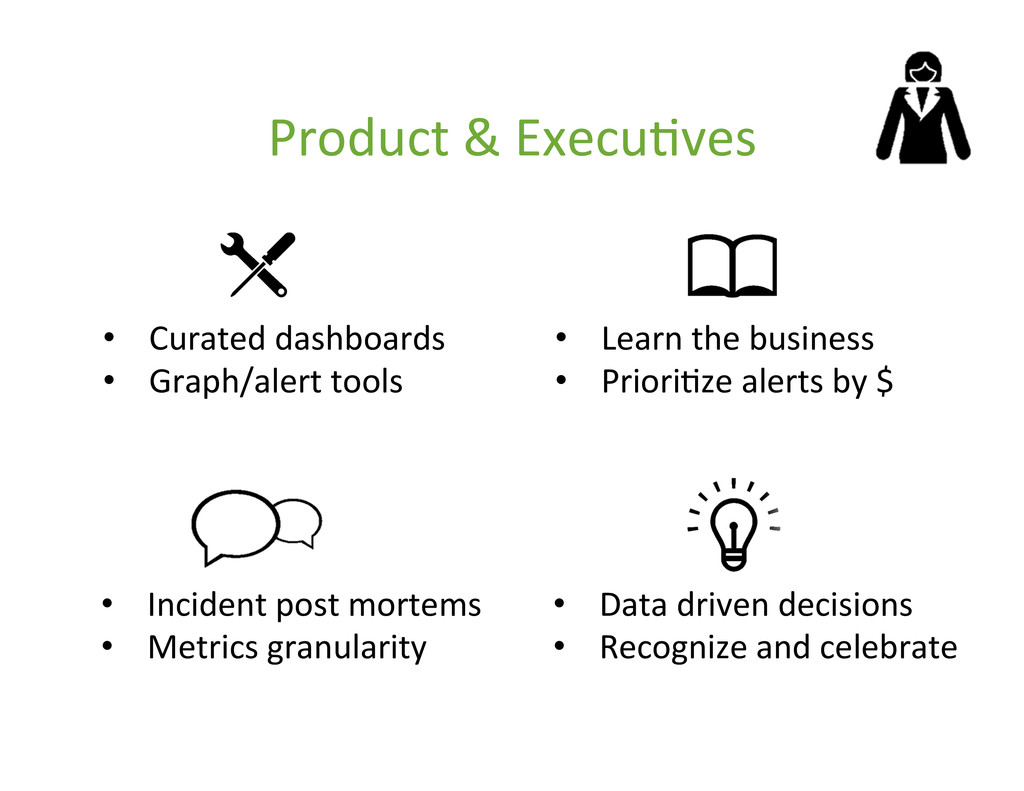
Product & ExecuIves • Curated dashboards • Graph/alert
tools • Learn the business • PrioriIze alerts by $ • Incident post mortems • Metrics granularity • Data driven decisions • Recognize and celebrate
Monitoring can become the data plahorm and improve all
teams with its techniques.
Icons from The Noun Project: Dmitry Baranovskiy, Benjamin Orlovski, Luis
Prado, MikaDo Nguyen, Yarden Gilboa, Javier Cabezas, Icons Pusher, Jeremy Bristol, Blake Thomas, RiIka Khasgiwale, Mayene de Leon, Yorlmar Campos, Sergey Shmid @jeff_weinstein Thanks! hiring ;)