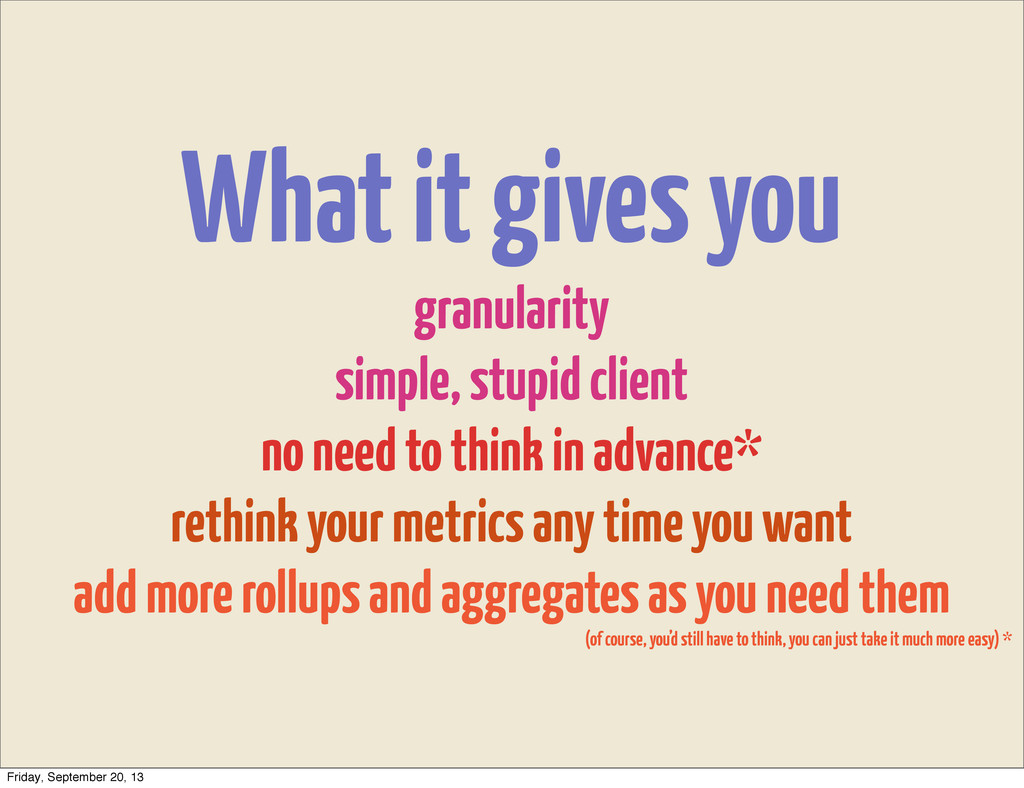
to think in advance* rethink your metrics any time you want add more rollups and aggregates as you need them (of course, you’d still have to think, you can just take it much more easy) * Friday, September 20, 13
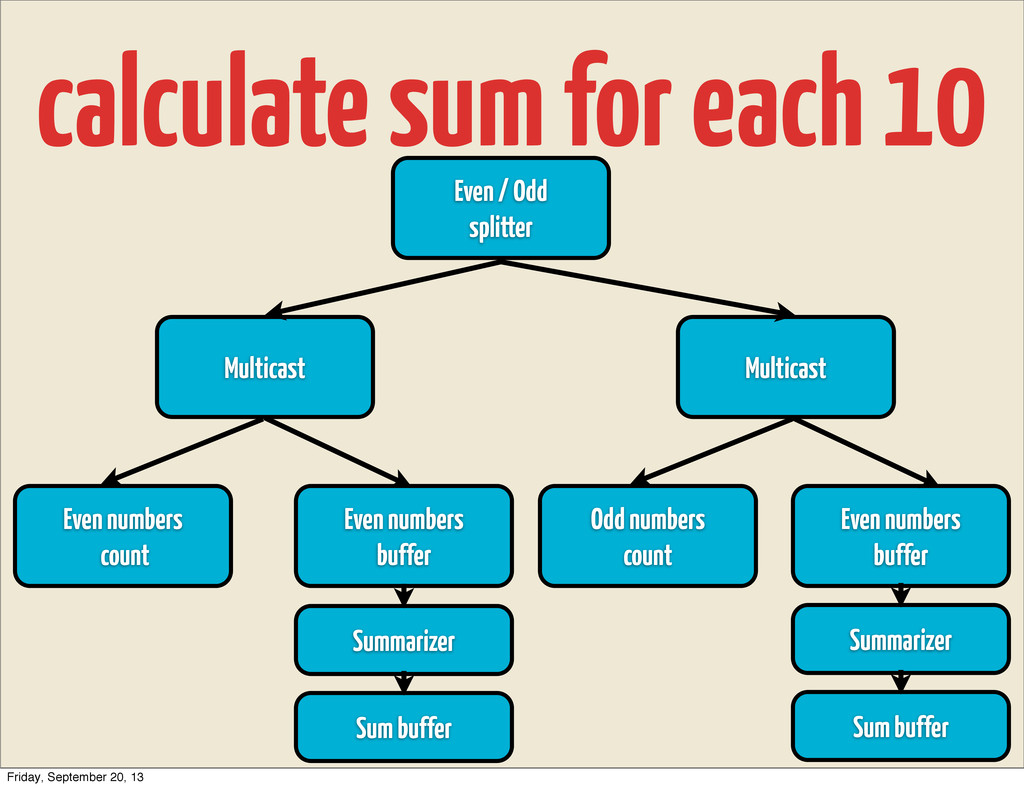
Multicast Even numbers count Even numbers buffer Odd numbers count Even numbers buffer Summarizer Sum buffer Summarizer Sum buffer Friday, September 20, 13
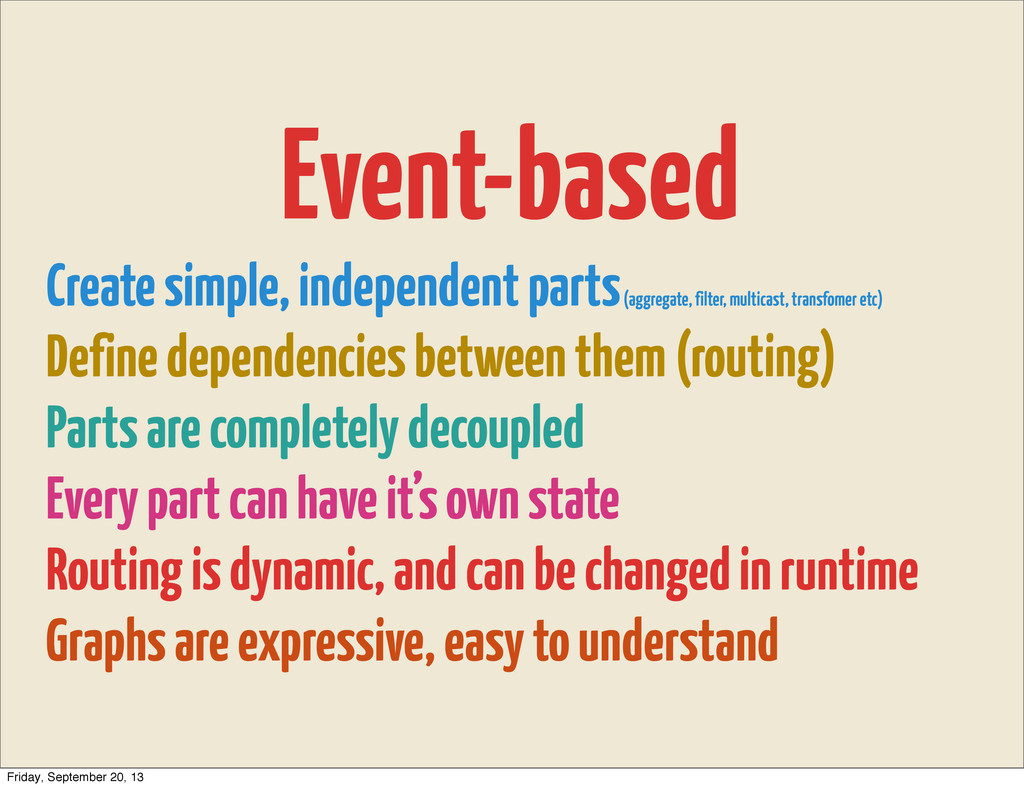
Define dependencies between them (routing) Parts are completely decoupled Every part can have it’s own state Routing is dynamic, and can be changed in runtime Graphs are expressive, easy to understand Friday, September 20, 13
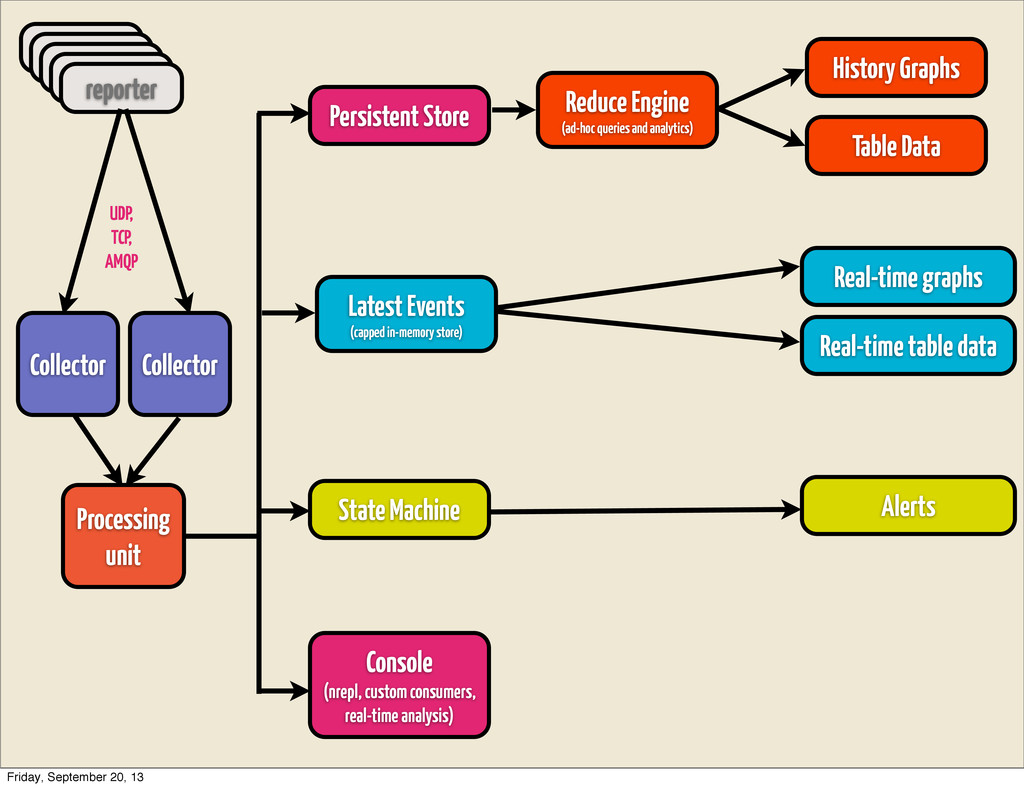
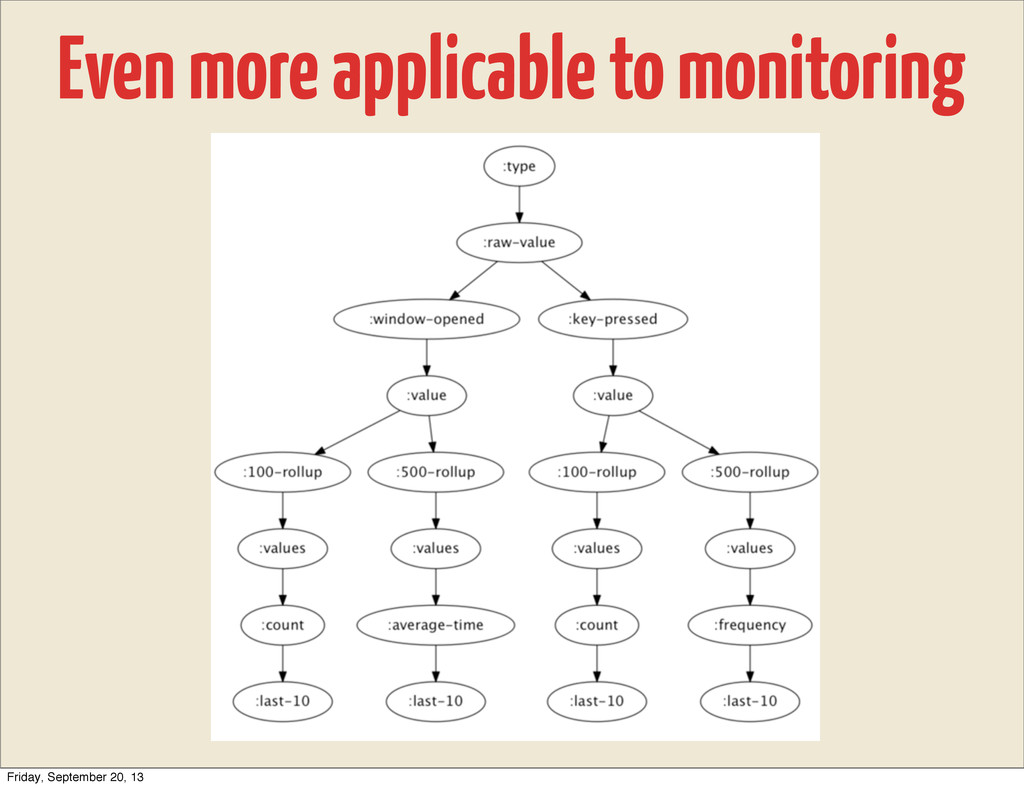
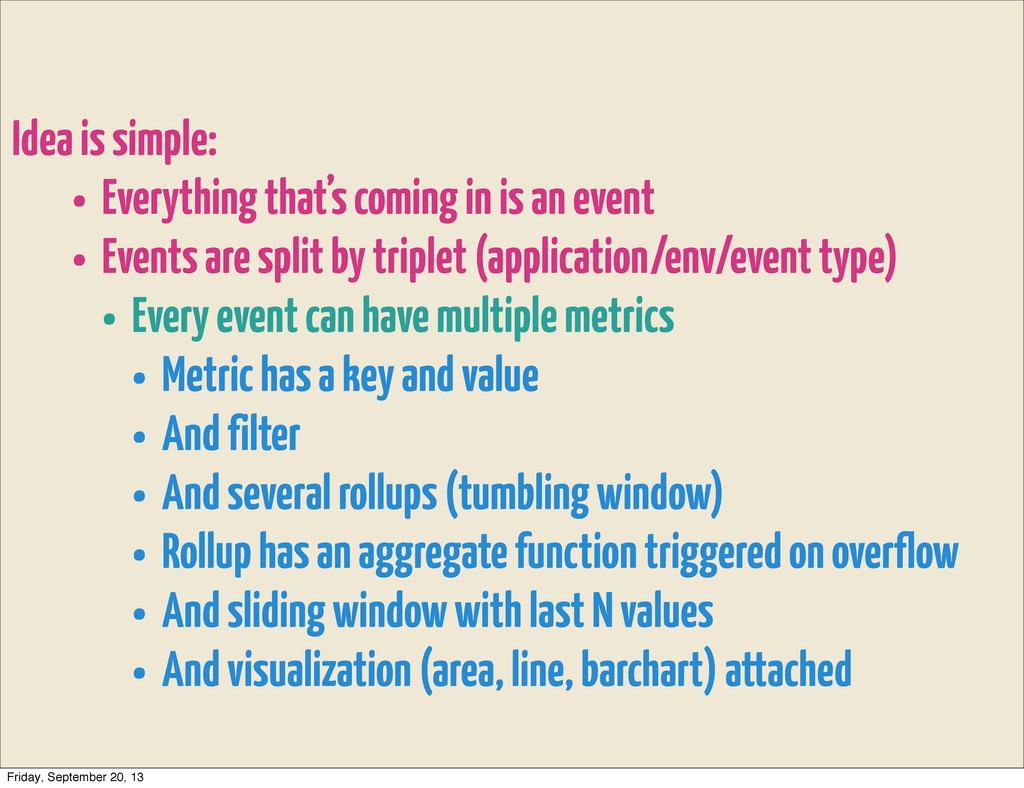
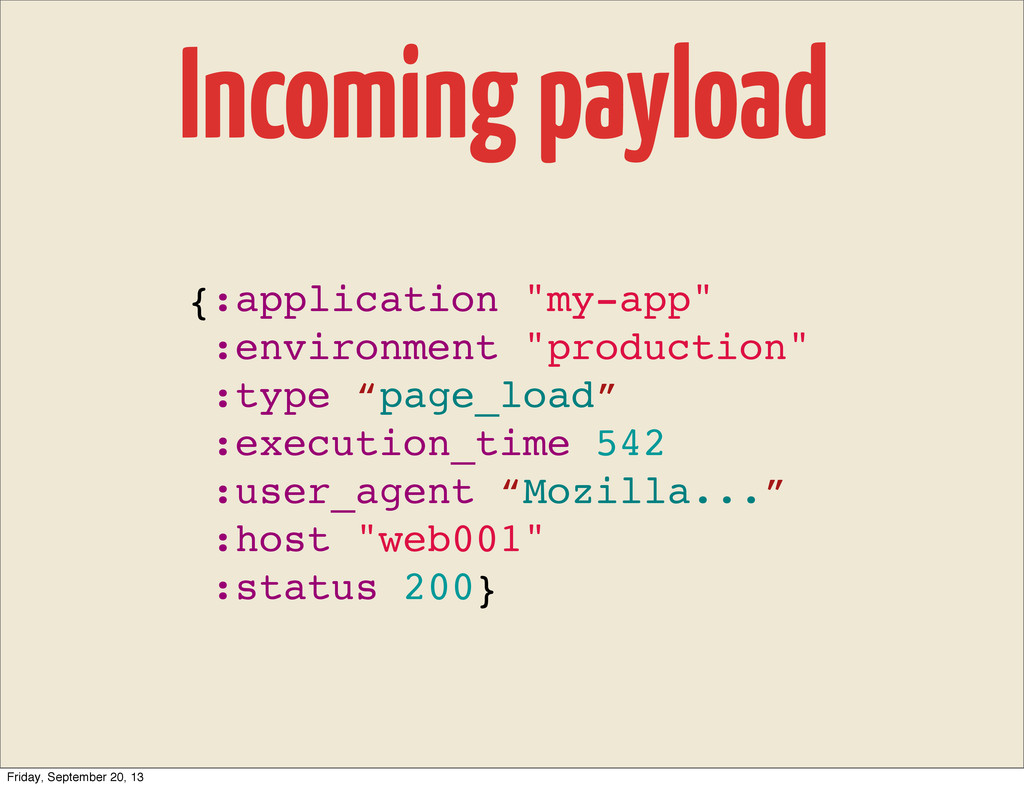
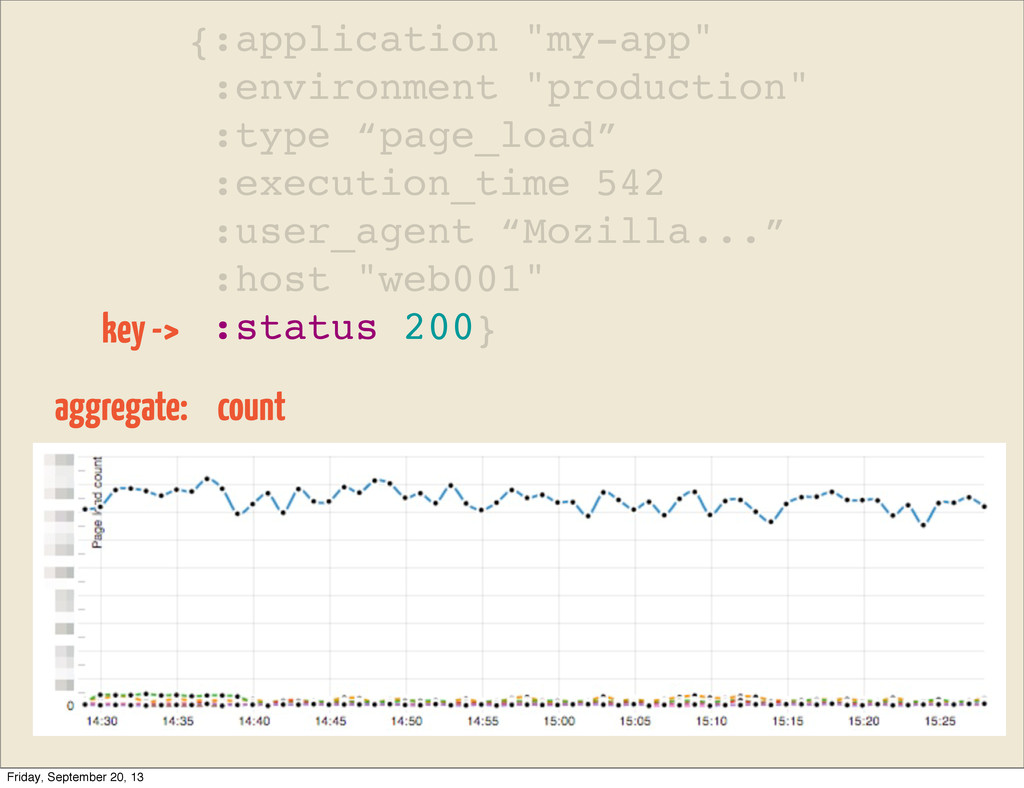
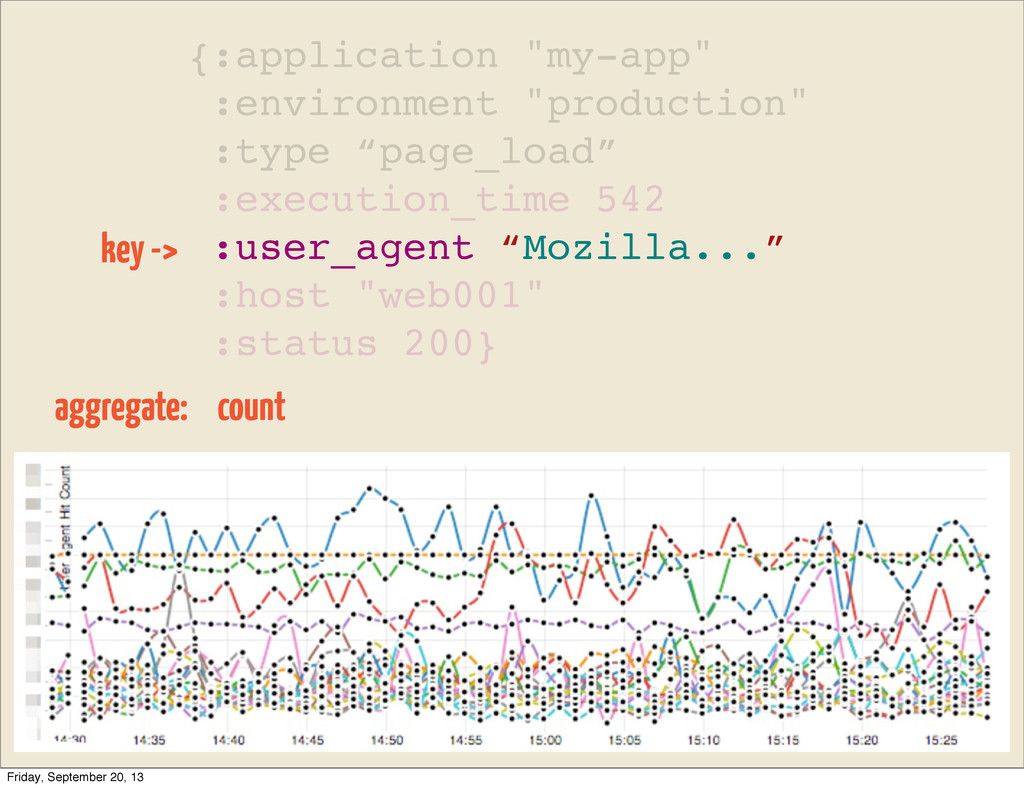
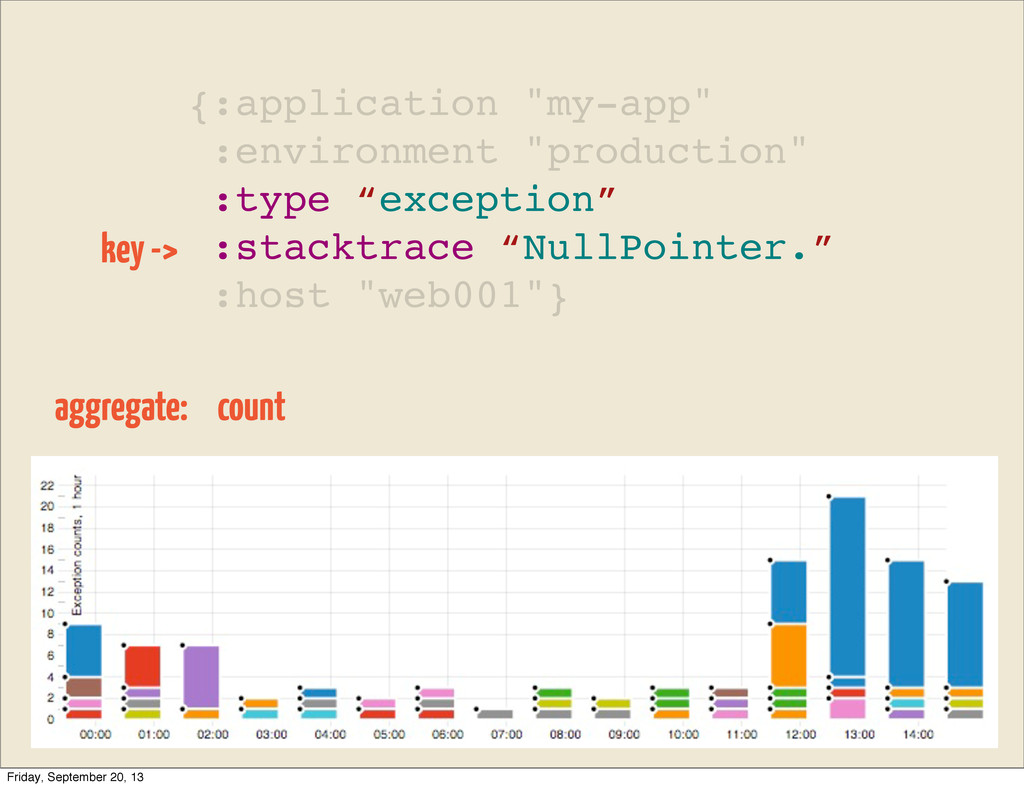
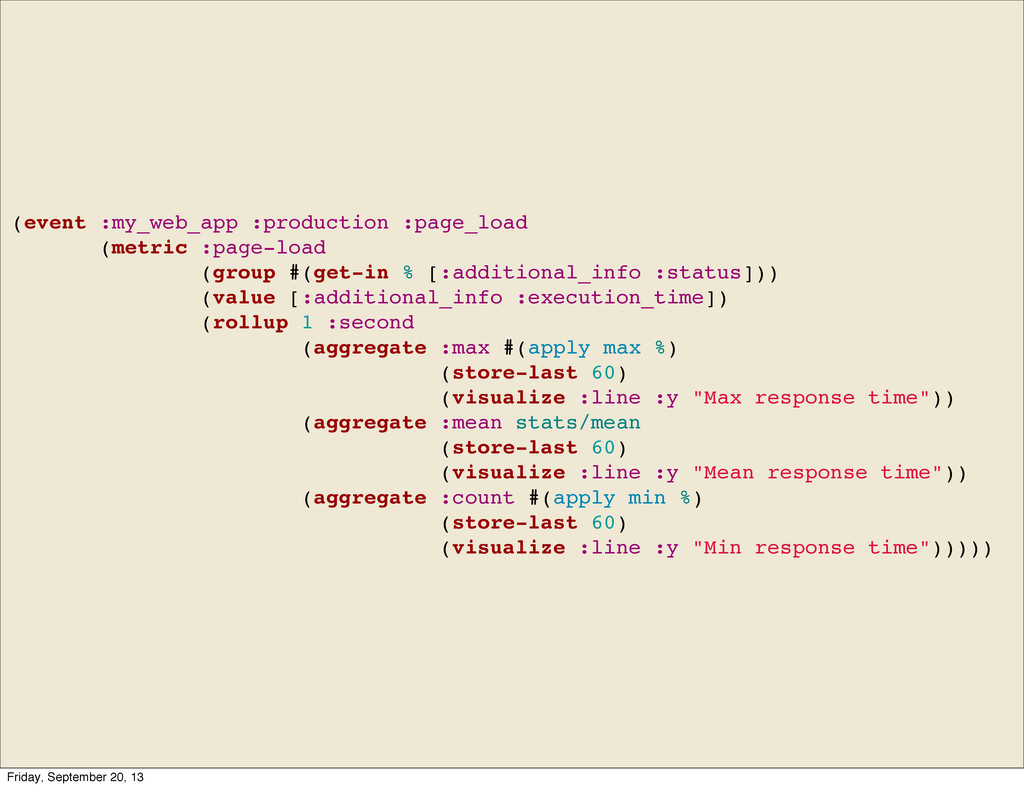
event • Events are split by triplet (application/env/event type) • Every event can have multiple metrics • Metric has a key and value • And filter • And several rollups (tumbling window) • Rollup has an aggregate function triggered on overflow • And sliding window with last N values • And visualization (area, line, barchart) attached Friday, September 20, 13
event • Events are split by triplet (application/env/event type) • Every event can have multiple metrics • Metric has a key and value • And filter • And several rollups (tumbling window) • Rollup has an aggregate function triggered on overflow • And sliding window with last N values • And visualization (area, line, barchart) attached Friday, September 20, 13
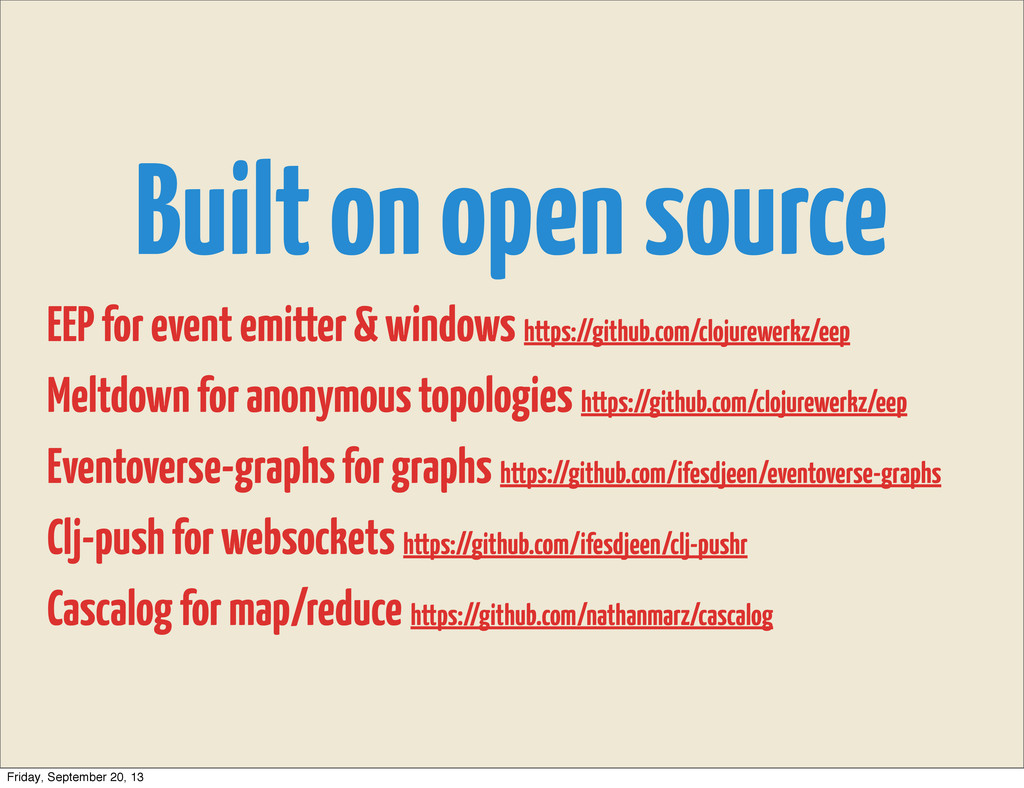
https://github.com/clojurewerkz/eep Meltdown for anonymous topologies https://github.com/clojurewerkz/eep Eventoverse-graphs for graphs https://github.com/ifesdjeen/eventoverse-graphs Clj-push for websockets https://github.com/ifesdjeen/clj-pushr Cascalog for map/reduce https://github.com/nathanmarz/cascalog Friday, September 20, 13
![(event :my_web_app :production :page_load (metric :page-load (group #(get-in % [:status]))](https://files.speakerdeck.com/presentations/48a706b007b10131b4117a4b8f91befb/slide_65.jpg)