was created for educational purposes only. • Please note that this presentation represents a hypothetical business proposal. • R Mustangs Consulting is a hypothetical company that does not exist. • Company Data used throughout this presentation was provided my SMU and represents historical values based on aggregate totals of multiple company providers.
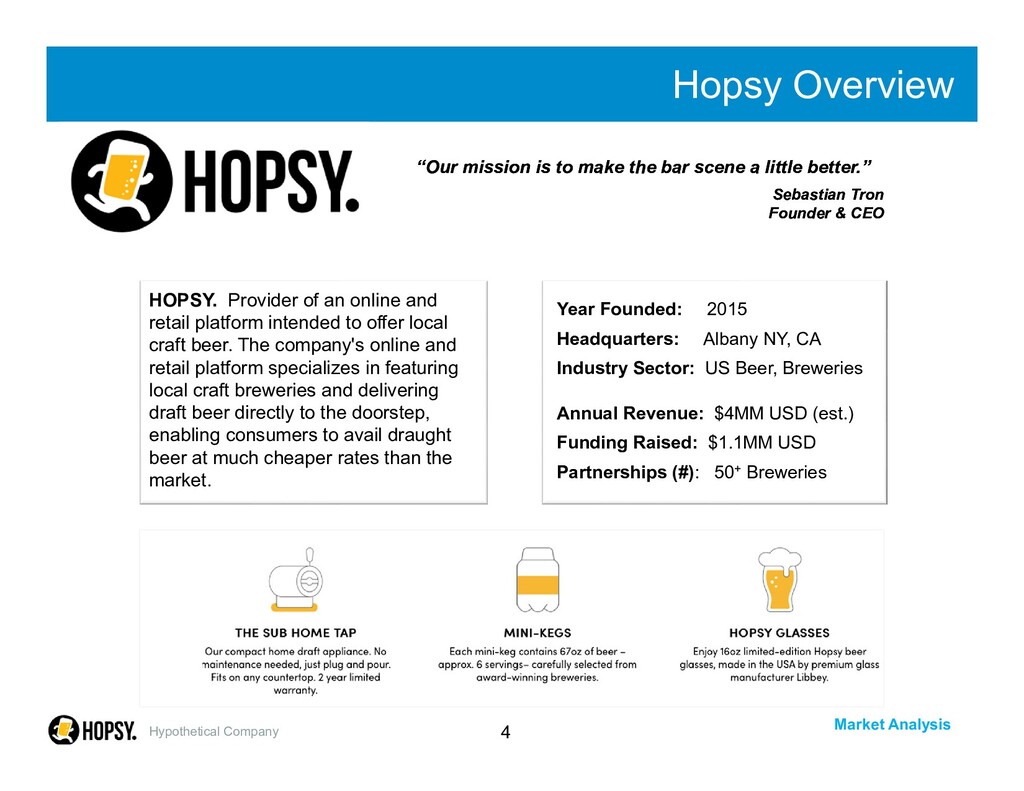
an online and retail platform intended to offer local craft beer. The company's online and retail platform specializes in featuring local craft breweries and delivering draft beer directly to the doorstep, enabling consumers to avail draught beer at much cheaper rates than the market. Year Founded: 2015 Headquarters: Albany NY, CA Industry Sector: US Beer, Breweries Annual Revenue: $4MM USD (est.) Funding Raised: $1.1MM USD Partnerships (#): 50+ Breweries “Our mission is to make the bar scene a little better.” Sebastian Tron Founder & CEO “Our mission is to make the bar scene a little better.” Sebastian Tron Founder & CEO
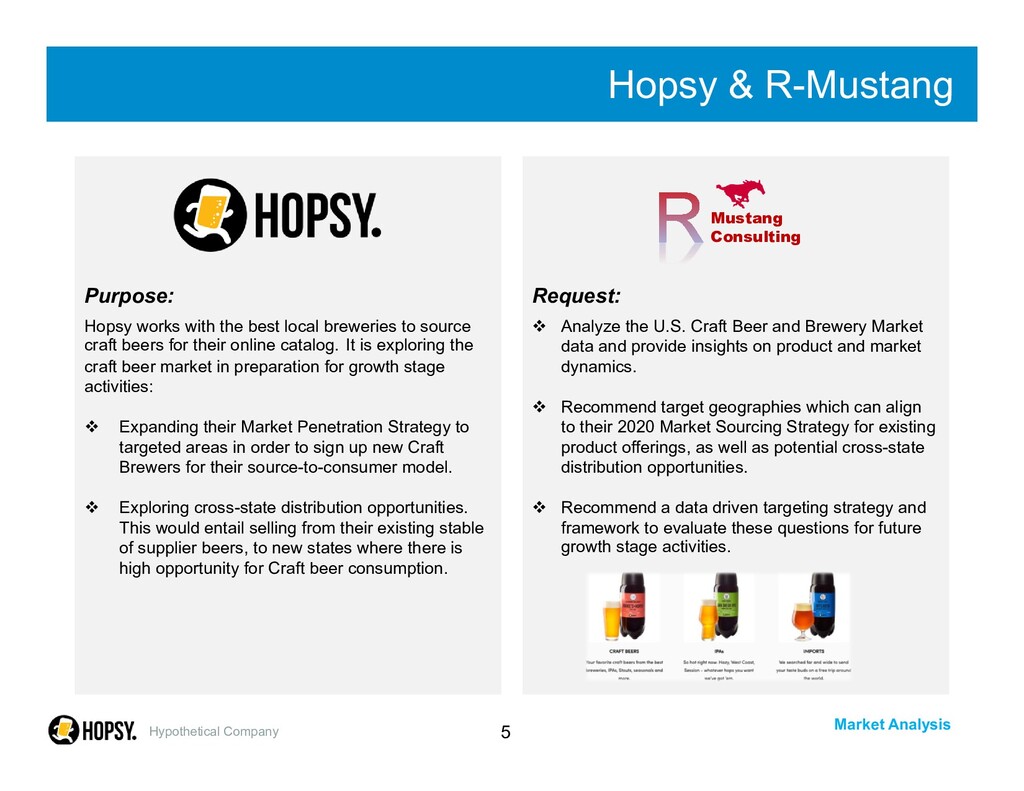
and Brewery Market data and provide insights on product and market dynamics. Recommend target geographies which can align to their 2020 Market Sourcing Strategy for existing product offerings, as well as potential cross-state distribution opportunities. Recommend a data driven targeting strategy and framework to evaluate these questions for future growth stage activities. Request: Analyze the U.S. Craft Beer and Brewery Market data and provide insights on product and market dynamics. Recommend target geographies which can align to their 2020 Market Sourcing Strategy for existing product offerings, as well as potential cross-state distribution opportunities. Recommend a data driven targeting strategy and framework to evaluate these questions for future growth stage activities. Hypothetical Company Purpose: Hopsy works with the best local breweries to source craft beers for their online catalog. It is exploring the craft beer market in preparation for growth stage activities: Expanding their Market Penetration Strategy to targeted areas in order to sign up new Craft Brewers for their source-to-consumer model. Exploring cross-state distribution opportunities. This would entail selling from their existing stable of supplier beers, to new states where there is high opportunity for Craft beer consumption. Purpose: Hopsy works with the best local breweries to source craft beers for their online catalog. It is exploring the craft beer market in preparation for growth stage activities: Expanding their Market Penetration Strategy to targeted areas in order to sign up new Craft Brewers for their source-to-consumer model. Exploring cross-state distribution opportunities. This would entail selling from their existing stable of supplier beers, to new states where there is high opportunity for Craft beer consumption. Hopsy & R-Mustang Mustang Consulting
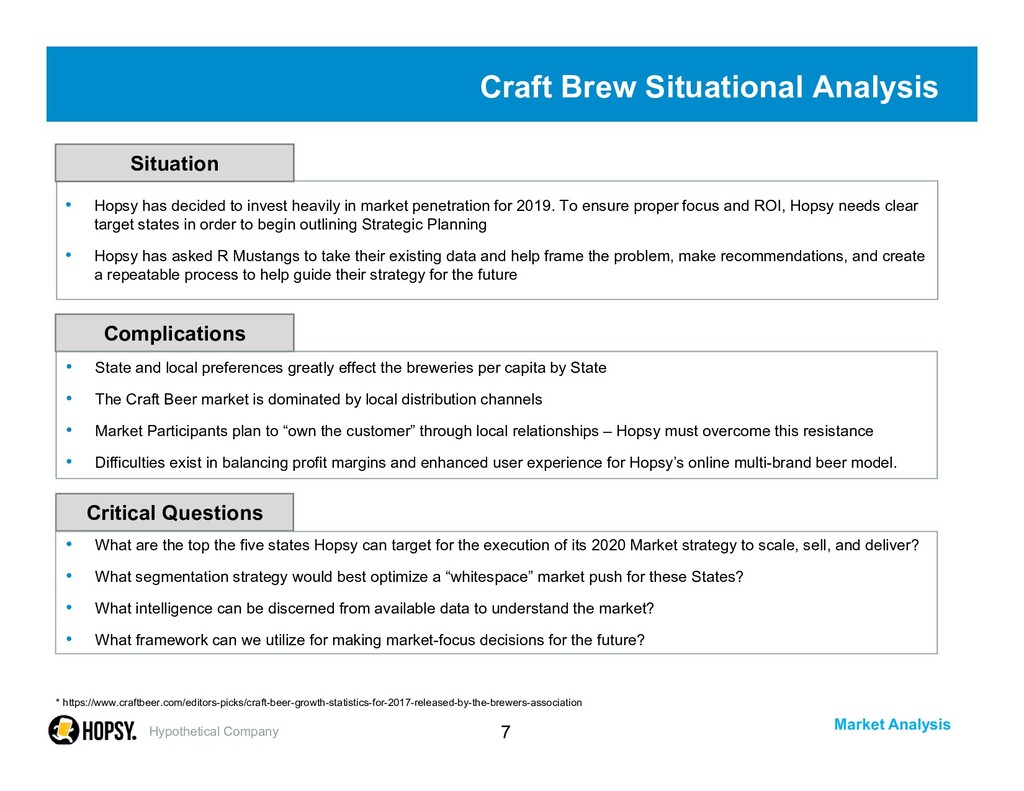
Complications Critical Questions * https://www.craftbeer.com/editors-picks/craft-beer-growth-statistics-for-2017-released-by-the-brewers-association • Hopsy has decided to invest heavily in market penetration for 2019. To ensure proper focus and ROI, Hopsy needs clear target states in order to begin outlining Strategic Planning • Hopsy has asked R Mustangs to take their existing data and help frame the problem, make recommendations, and create a repeatable process to help guide their strategy for the future • State and local preferences greatly effect the breweries per capita by State • The Craft Beer market is dominated by local distribution channels • Market Participants plan to “own the customer” through local relationships – Hopsy must overcome this resistance • Difficulties exist in balancing profit margins and enhanced user experience for Hopsy’s online multi-brand beer model. • What are the top the five states Hopsy can target for the execution of its 2020 Market strategy to scale, sell, and deliver? • What segmentation strategy would best optimize a “whitespace” market push for these States? • What intelligence can be discerned from available data to understand the market? • What framework can we utilize for making market-focus decisions for the future?
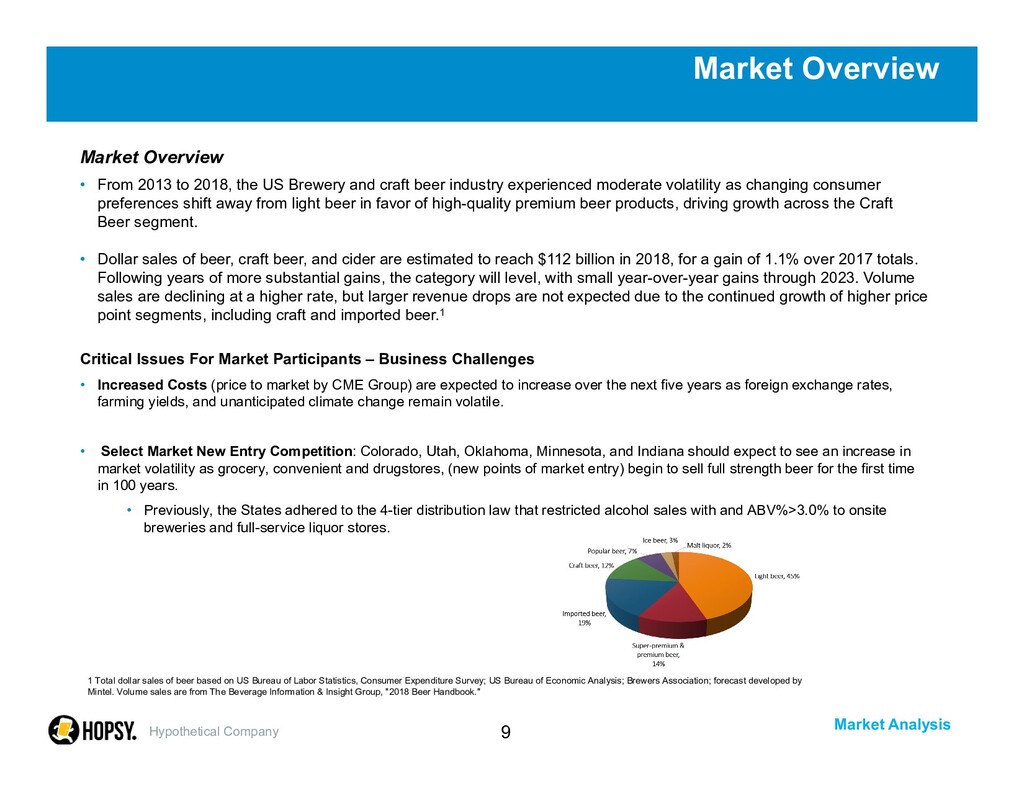
From 2013 to 2018, the US Brewery and craft beer industry experienced moderate volatility as changing consumer preferences shift away from light beer in favor of high-quality premium beer products, driving growth across the Craft Beer segment. • Dollar sales of beer, craft beer, and cider are estimated to reach $112 billion in 2018, for a gain of 1.1% over 2017 totals. Following years of more substantial gains, the category will level, with small year-over-year gains through 2023. Volume sales are declining at a higher rate, but larger revenue drops are not expected due to the continued growth of higher price point segments, including craft and imported beer.1 Critical Issues For Market Participants – Business Challenges • Increased Costs (price to market by CME Group) are expected to increase over the next five years as foreign exchange rates, farming yields, and unanticipated climate change remain volatile. • Select Market New Entry Competition: Colorado, Utah, Oklahoma, Minnesota, and Indiana should expect to see an increase in market volatility as grocery, convenient and drugstores, (new points of market entry) begin to sell full strength beer for the first time in 100 years. • Previously, the States adhered to the 4-tier distribution law that restricted alcohol sales with and ABV%>3.0% to onsite breweries and full-service liquor stores. 1 Total dollar sales of beer based on US Bureau of Labor Statistics, Consumer Expenditure Survey; US Bureau of Economic Analysis; Brewers Association; forecast developed by Mintel. Volume sales are from The Beverage Information & Insight Group, "2018 Beer Handbook."
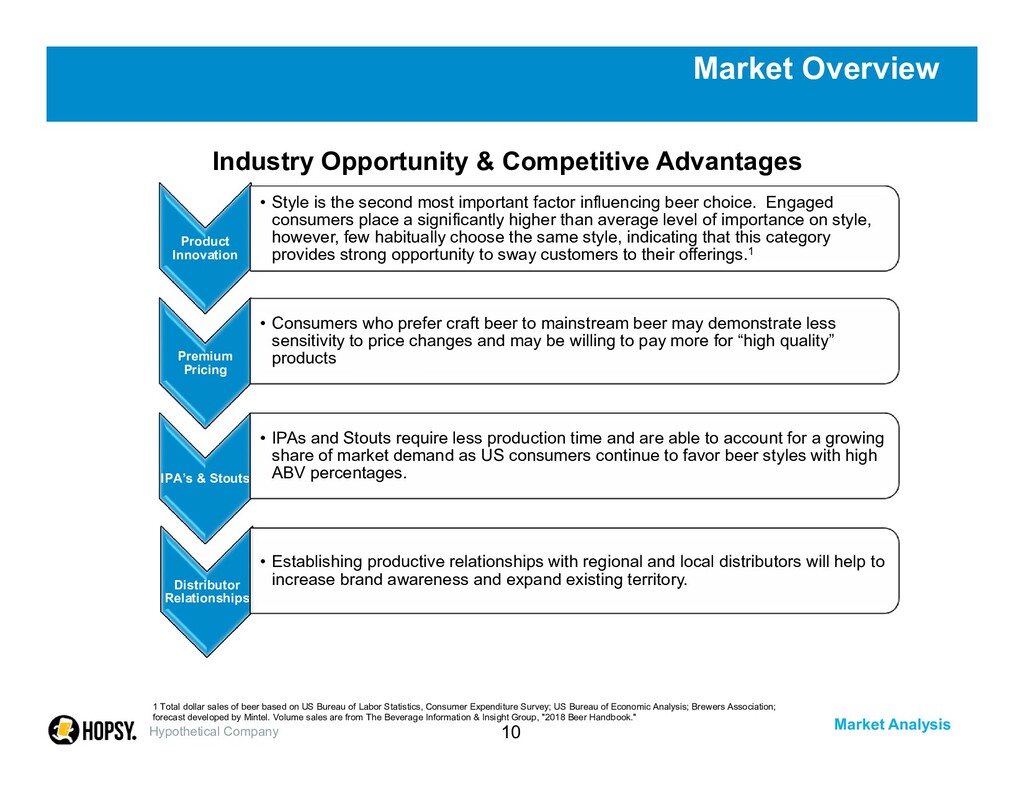
the second most important factor influencing beer choice. Engaged consumers place a significantly higher than average level of importance on style, however, few habitually choose the same style, indicating that this category provides strong opportunity to sway customers to their offerings.1 Premium Pricing • Consumers who prefer craft beer to mainstream beer may demonstrate less sensitivity to price changes and may be willing to pay more for “high quality” products IPA’s & Stouts • IPAs and Stouts require less production time and are able to account for a growing share of market demand as US consumers continue to favor beer styles with high ABV percentages. Distributor Relationships • Establishing productive relationships with regional and local distributors will help to increase brand awareness and expand existing territory. Industry Opportunity & Competitive Advantages 1 Total dollar sales of beer based on US Bureau of Labor Statistics, Consumer Expenditure Survey; US Bureau of Economic Analysis; Brewers Association; forecast developed by Mintel. Volume sales are from The Beverage Information & Insight Group, "2018 Beer Handbook." Hypothetical Company
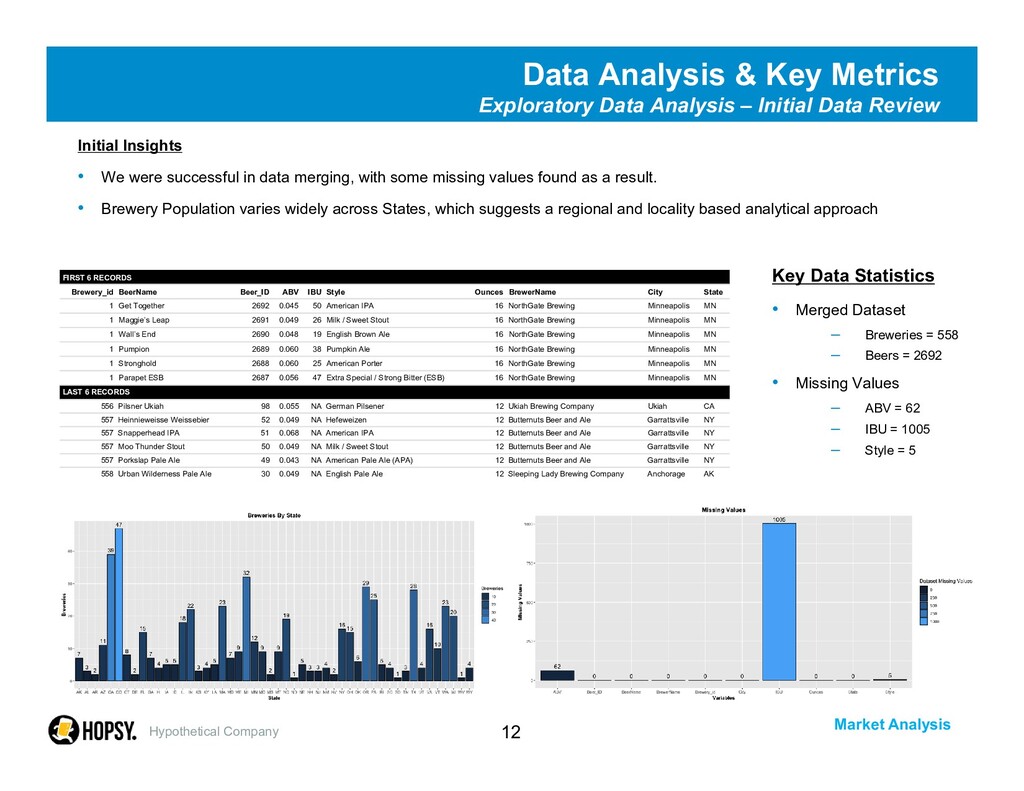
Analysis – Initial Data Review Initial Insights • We were successful in data merging, with some missing values found as a result. • Brewery Population varies widely across States, which suggests a regional and locality based analytical approach Hypothetical Company FIRST 6 RECORDS Brewery_id BeerName Beer_ID ABV IBU Style Ounces BrewerName City State 1 Get Together 2692 0.045 50 American IPA 16 NorthGate Brewing Minneapolis MN 1 Maggie’s Leap 2691 0.049 26 Milk / Sweet Stout 16 NorthGate Brewing Minneapolis MN 1 Wall’s End 2690 0.048 19 English Brown Ale 16 NorthGate Brewing Minneapolis MN 1 Pumpion 2689 0.060 38 Pumpkin Ale 16 NorthGate Brewing Minneapolis MN 1 Stronghold 2688 0.060 25 American Porter 16 NorthGate Brewing Minneapolis MN 1 Parapet ESB 2687 0.056 47 Extra Special / Strong Bitter (ESB) 16 NorthGate Brewing Minneapolis MN LAST 6 RECORDS 556 Pilsner Ukiah 98 0.055 NA German Pilsener 12 Ukiah Brewing Company Ukiah CA 557 Heinnieweisse Weissebier 52 0.049 NA Hefeweizen 12 Butternuts Beer and Ale Garrattsville NY 557 Snapperhead IPA 51 0.068 NA American IPA 12 Butternuts Beer and Ale Garrattsville NY 557 Moo Thunder Stout 50 0.049 NA Milk / Sweet Stout 12 Butternuts Beer and Ale Garrattsville NY 557 Porkslap Pale Ale 49 0.043 NA American Pale Ale (APA) 12 Butternuts Beer and Ale Garrattsville NY 558 Urban Wilderness Pale Ale 30 0.049 NA English Pale Ale 12 Sleeping Lady Brewing Company Anchorage AK Key Data Statistics • Merged Dataset – Breweries = 558 – Beers = 2692 • Missing Values – ABV = 62 – IBU = 1005 – Style = 5
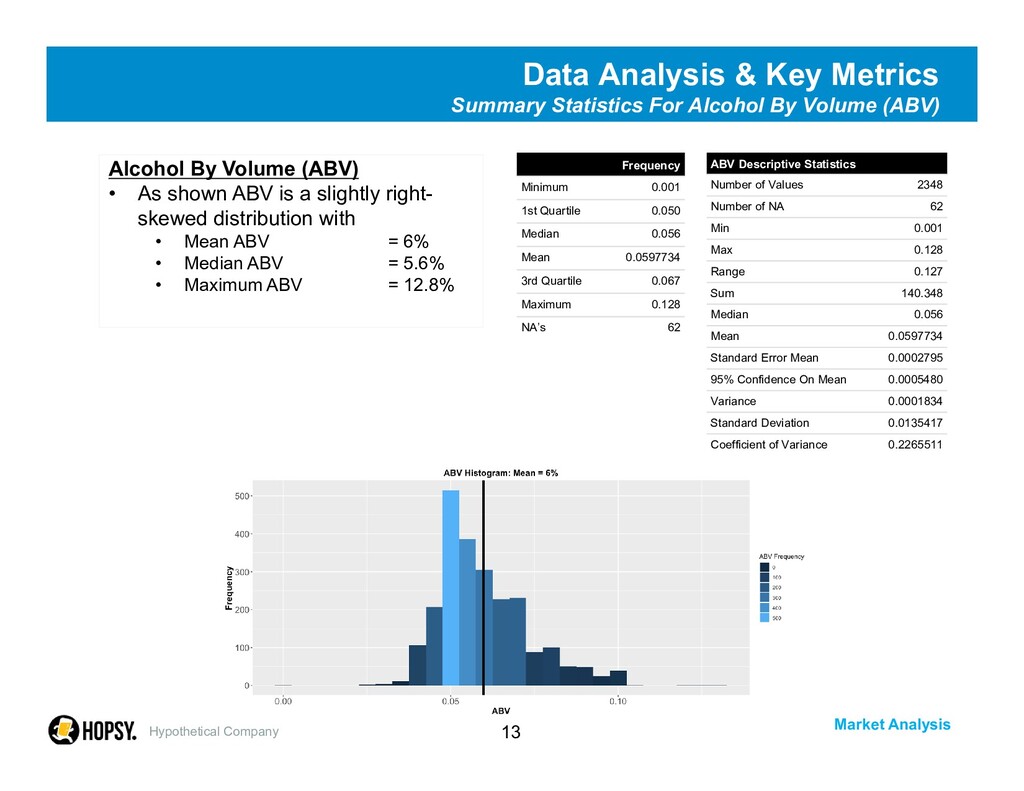
For Alcohol By Volume (ABV) Hypothetical Company ABV Descriptive Statistics Number of Values 2348 Number of NA 62 Min 0.001 Max 0.128 Range 0.127 Sum 140.348 Median 0.056 Mean 0.0597734 Standard Error Mean 0.0002795 95% Confidence On Mean 0.0005480 Variance 0.0001834 Standard Deviation 0.0135417 Coefficient of Variance 0.2265511 Frequency Minimum 0.001 1st Quartile 0.050 Median 0.056 Mean 0.0597734 3rd Quartile 0.067 Maximum 0.128 NA’s 62 Alcohol By Volume (ABV) • As shown ABV is a slightly right- skewed distribution with • Mean ABV = 6% • Median ABV = 5.6% • Maximum ABV = 12.8%
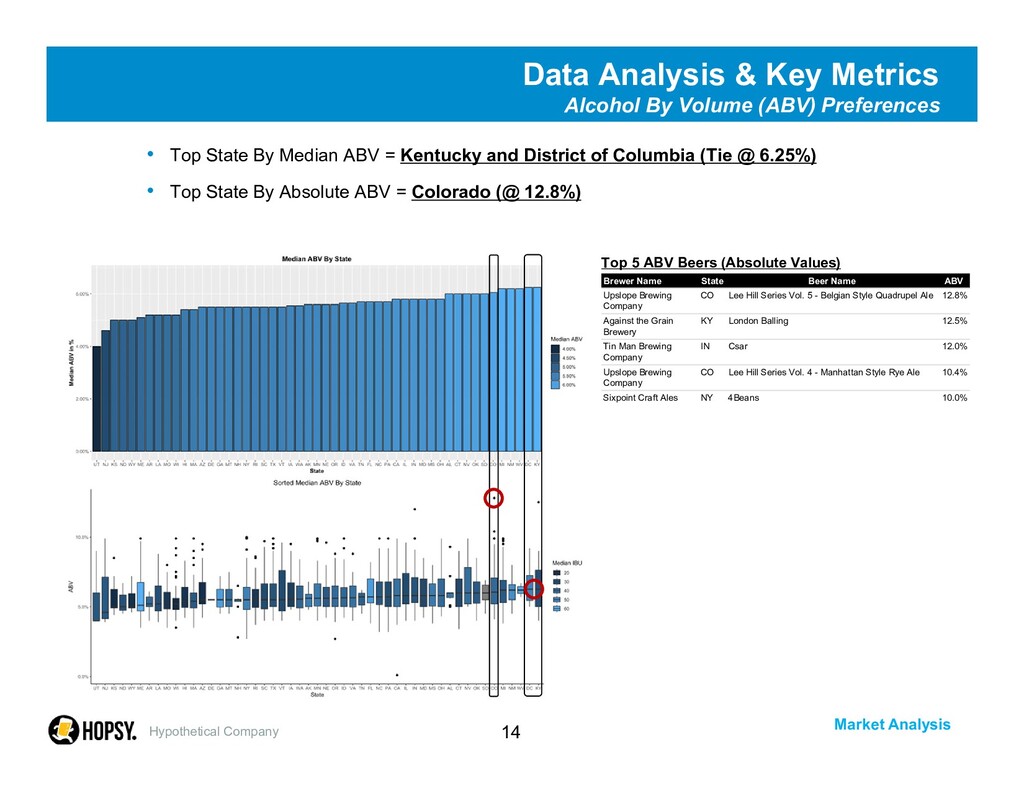
Volume (ABV) Preferences • Top State By Median ABV = Kentucky and District of Columbia (Tie @ 6.25%) • Top State By Absolute ABV = Colorado (@ 12.8%) Hypothetical Company Brewer Name State Beer Name ABV Upslope Brewing Company CO Lee Hill Series Vol. 5 - Belgian Style Quadrupel Ale 12.8% Against the Grain Brewery KY London Balling 12.5% Tin Man Brewing Company IN Csar 12.0% Upslope Brewing Company CO Lee Hill Series Vol. 4 - Manhattan Style Rye Ale 10.4% Sixpoint Craft Ales NY 4Beans 10.0% Top 5 ABV Beers (Absolute Values)
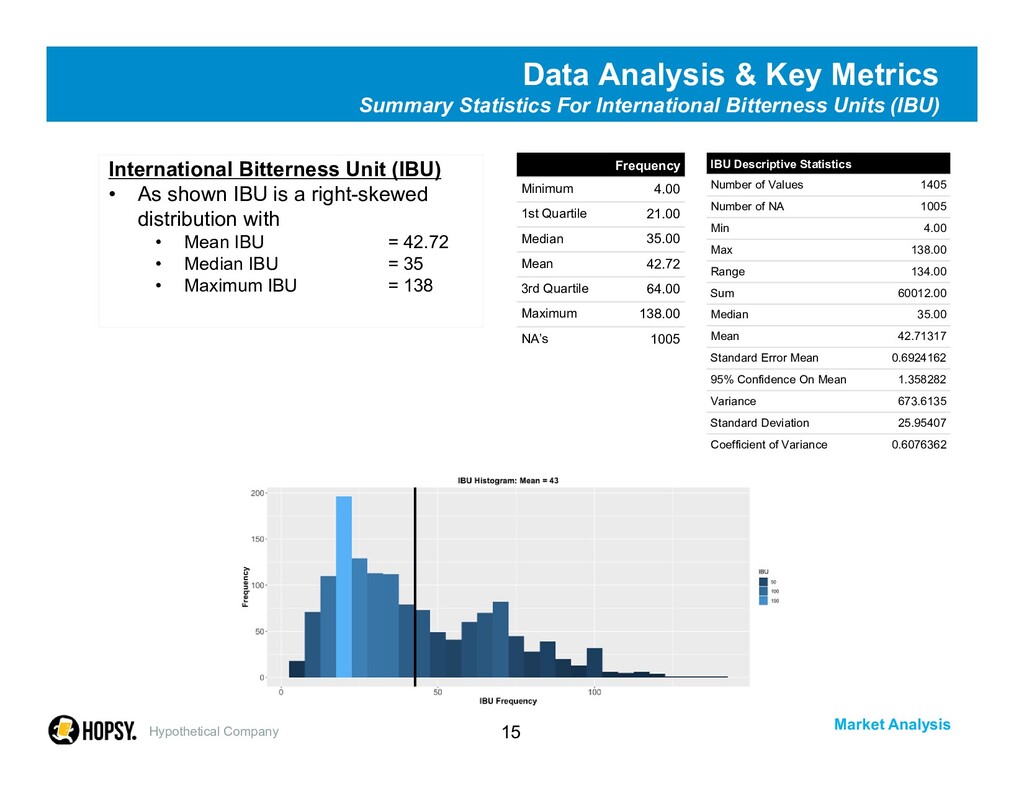
For International Bitterness Units (IBU) Hypothetical Company IBU Descriptive Statistics Number of Values 1405 Number of NA 1005 Min 4.00 Max 138.00 Range 134.00 Sum 60012.00 Median 35.00 Mean 42.71317 Standard Error Mean 0.6924162 95% Confidence On Mean 1.358282 Variance 673.6135 Standard Deviation 25.95407 Coefficient of Variance 0.6076362 Frequency Minimum 4.00 1st Quartile 21.00 Median 35.00 Mean 42.72 3rd Quartile 64.00 Maximum 138.00 NA’s 1005 International Bitterness Unit (IBU) • As shown IBU is a right-skewed distribution with • Mean IBU = 42.72 • Median IBU = 35 • Maximum IBU = 138
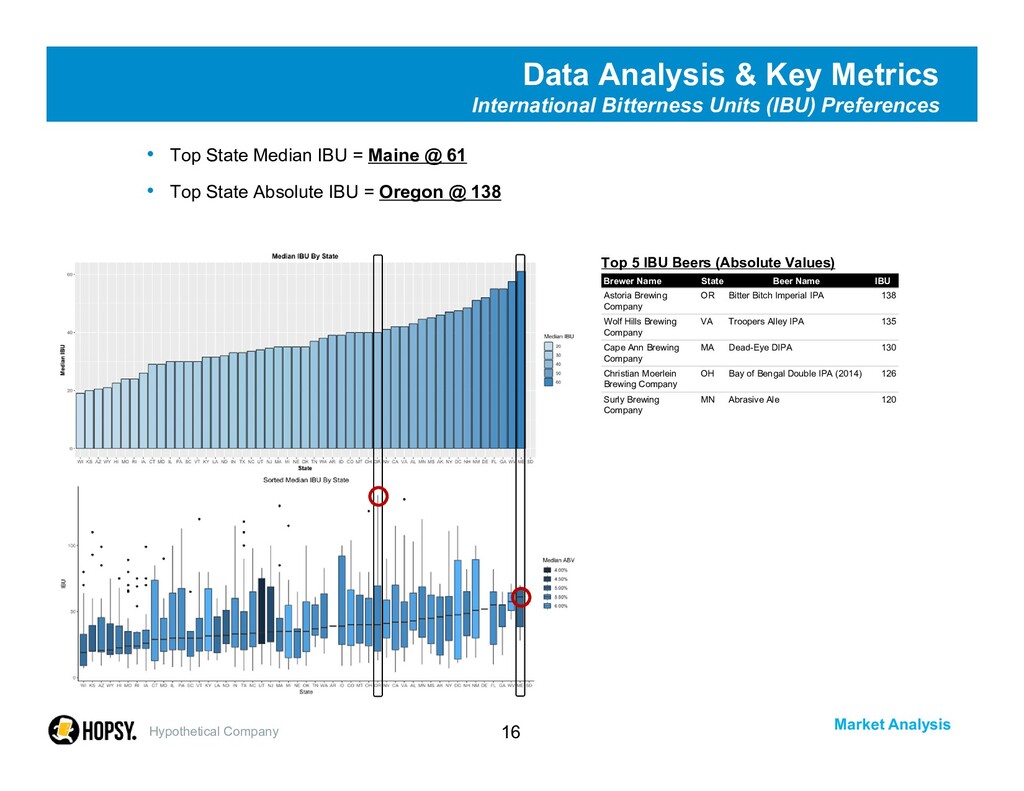
Units (IBU) Preferences • Top State Median IBU = Maine @ 61 • Top State Absolute IBU = Oregon @ 138 Hypothetical Company Brewer Name State Beer Name IBU Astoria Brewing Company OR Bitter Bitch Imperial IPA 138 Wolf Hills Brewing Company VA Troopers Alley IPA 135 Cape Ann Brewing Company MA Dead-Eye DIPA 130 Christian Moerlein Brewing Company OH Bay of Bengal Double IPA (2014) 126 Surly Brewing Company MN Abrasive Ale 120 Top 5 IBU Beers (Absolute Values)
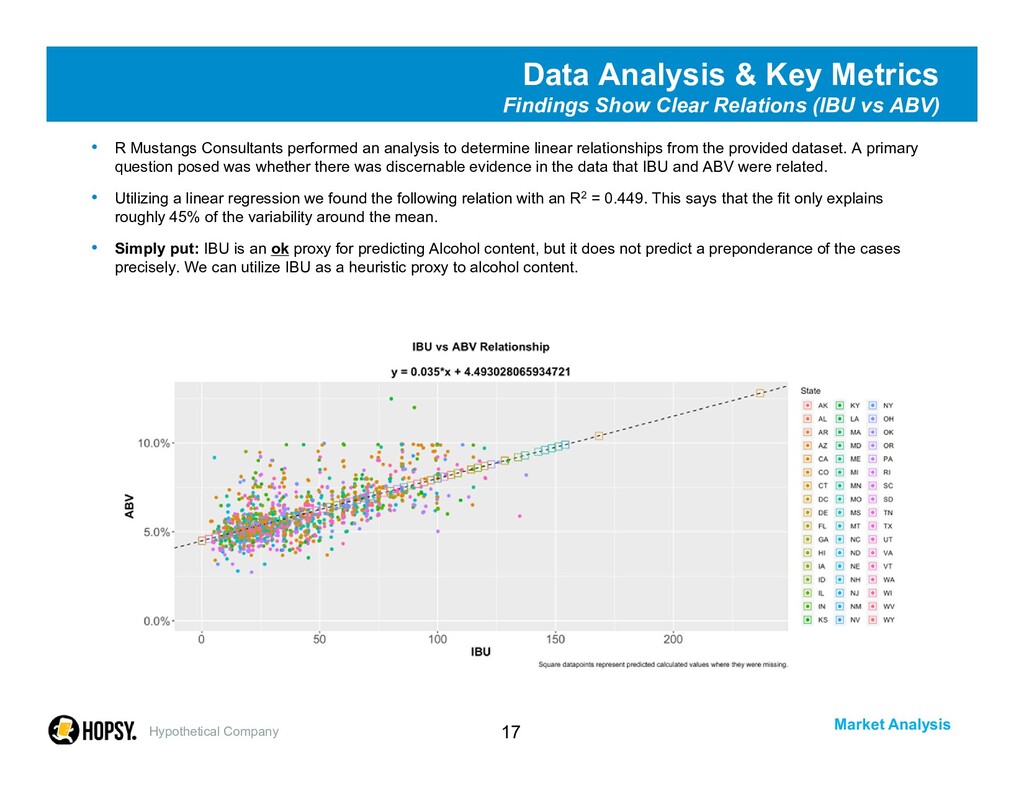
Clear Relations (IBU vs ABV) • R Mustangs Consultants performed an analysis to determine linear relationships from the provided dataset. A primary question posed was whether there was discernable evidence in the data that IBU and ABV were related. • Utilizing a linear regression we found the following relation with an R2 = 0.449. This says that the fit only explains roughly 45% of the variability around the mean. • Simply put: IBU is an ok proxy for predicting Alcohol content, but it does not predict a preponderance of the cases precisely. We can utilize IBU as a heuristic proxy to alcohol content. Hypothetical Company
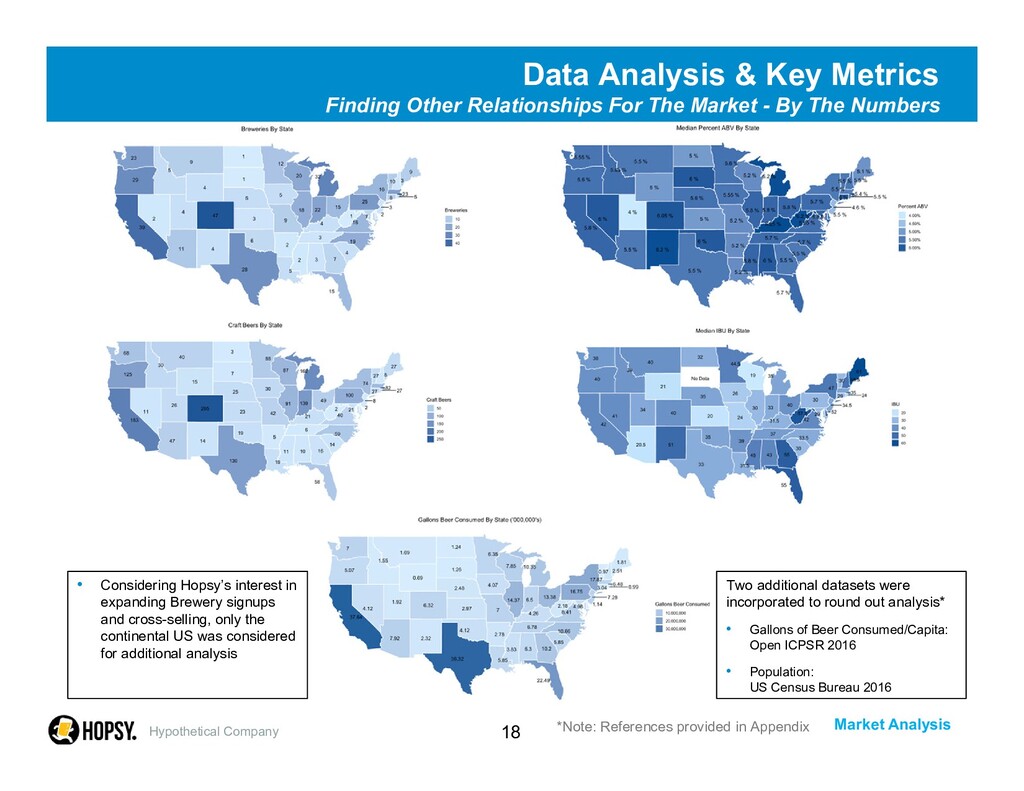
Relationships For The Market - By The Numbers • sd Hypothetical Company • Considering Hopsy’s interest in expanding Brewery signups and cross-selling, only the continental US was considered for additional analysis Two additional datasets were incorporated to round out analysis* • Gallons of Beer Consumed/Capita: Open ICPSR 2016 • Population: US Census Bureau 2016 *Note: References provided in Appendix
Truth – No Single Metric Helps Market Targeting No single metric allows for us to describe market dynamics on a detailed enough level to provide a framework with longevity. • Market Opportunity is a function of many variables – Beer and alcohol consumption culture within a local proximity – Brewery availability and marketing activities for locations – Craft beer diversity within market and saturation of styles – Alcohol content and taste preferences – Population availability within market to consume beer • For these reasons, we introduce what we have termed The Mustang Score – A State scoring mechanism based on weighted averages, easily extended to regions – Market Opportunity scoring includes weighted (adjustable) constants for a variety of factors that impact area potential – The “Score” is the sum of weighted averages for these metrics, scaled from 0 to 100 as an aggregate for all states. The sum of all state scores sum to 100. Hypothetical Company
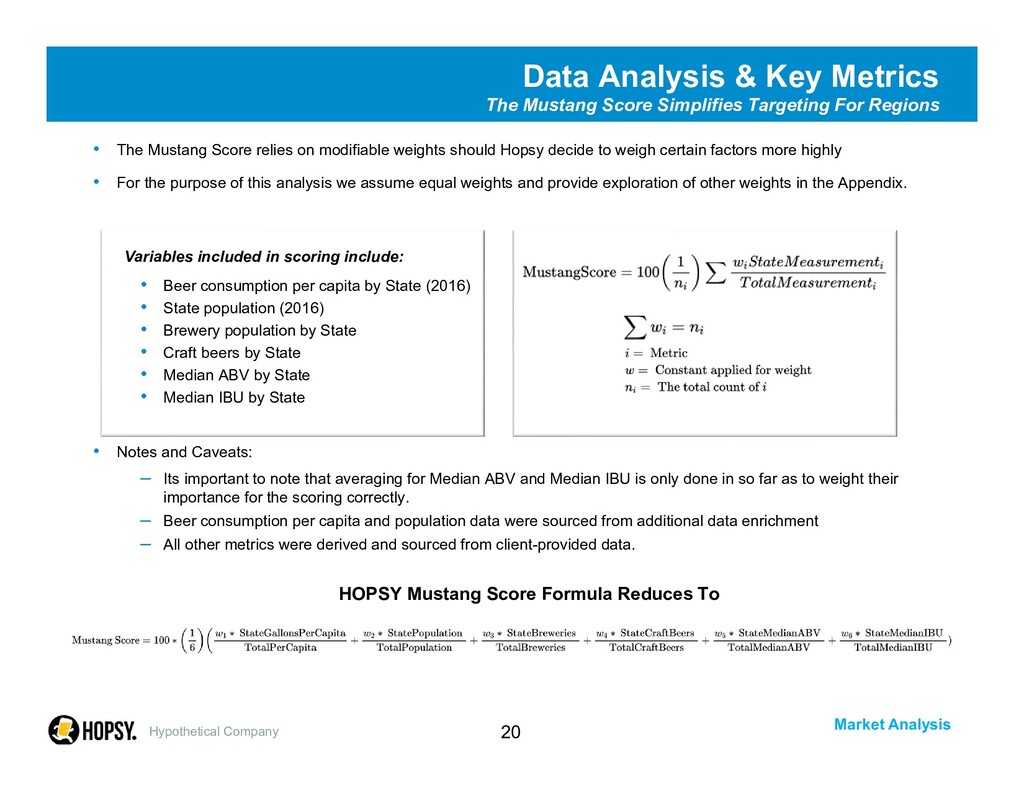
weights should Hopsy decide to weigh certain factors more highly • For the purpose of this analysis we assume equal weights and provide exploration of other weights in the Appendix. Variables included in scoring include: • Beer consumption per capita by State (2016) • State population (2016) • Brewery population by State • Craft beers by State • Median ABV by State • Median IBU by State • Notes and Caveats: – Its important to note that averaging for Median ABV and Median IBU is only done in so far as to weight their importance for the scoring correctly. – Beer consumption per capita and population data were sourced from additional data enrichment – All other metrics were derived and sourced from client-provided data. HOPSY Mustang Score Formula Reduces To Data Analysis & Key Metrics The Mustang Score Simplifies Targeting For Regions Hypothetical Company
Scoring Framework Paves The Way On Market Opportunity • The following map displays the Market Opportunity for Hopsy’s needs, based on the Mustang Score • Visually we can discern high Market Opportunity throughout the West Coast, Colorado, Texas, Florida, and portions of the Northeast • Interestingly Florida and Michigan are also unexpected contenders Hypothetical Company • Beer consumption per capita by State (2016) • State population (2016) • Brewery population by State • Craft beers by State • Median ABV by State • Median IBU by State Equal Weight Scoring
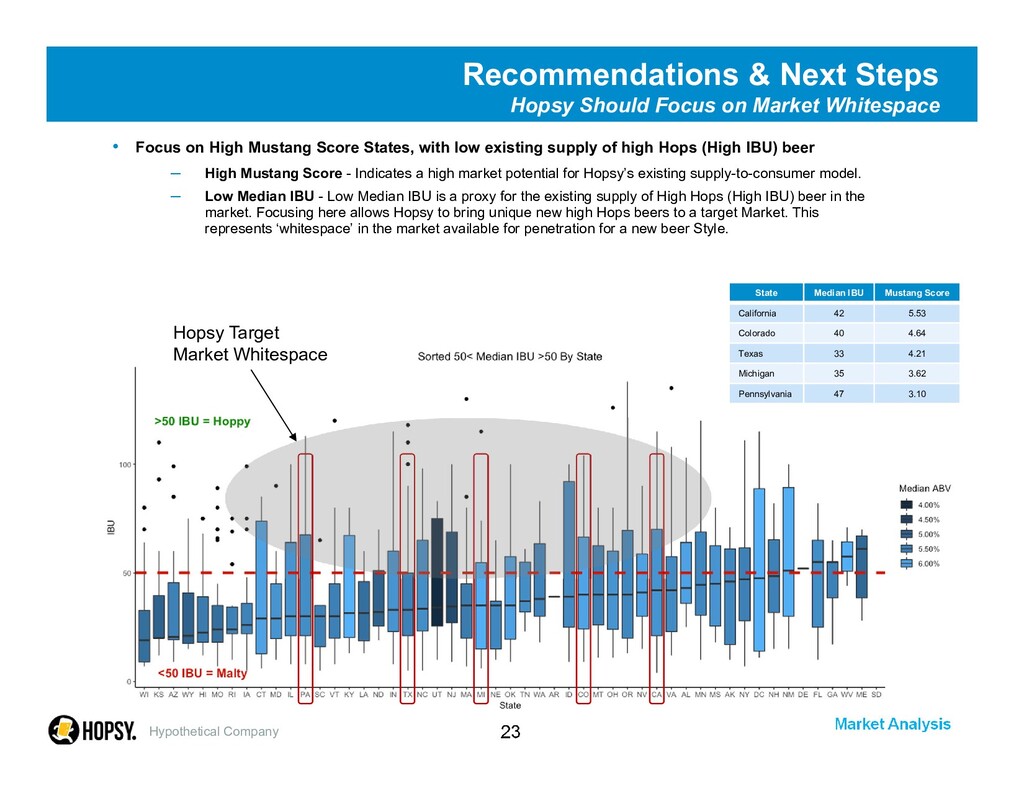
on Market Whitespace • Focus on High Mustang Score States, with low existing supply of high Hops (High IBU) beer – High Mustang Score - Indicates a high market potential for Hopsy’s existing supply-to-consumer model. – Low Median IBU - Low Median IBU is a proxy for the existing supply of High Hops (High IBU) beer in the market. Focusing here allows Hopsy to bring unique new high Hops beers to a target Market. This represents ‘whitespace’ in the market available for penetration for a new beer Style. Hypothetical Company State Median IBU Mustang Score California 42 5.53 Colorado 40 4.64 Texas 33 4.21 Michigan 35 3.62 Pennsylvania 47 3.10 Hopsy Target Market Whitespace
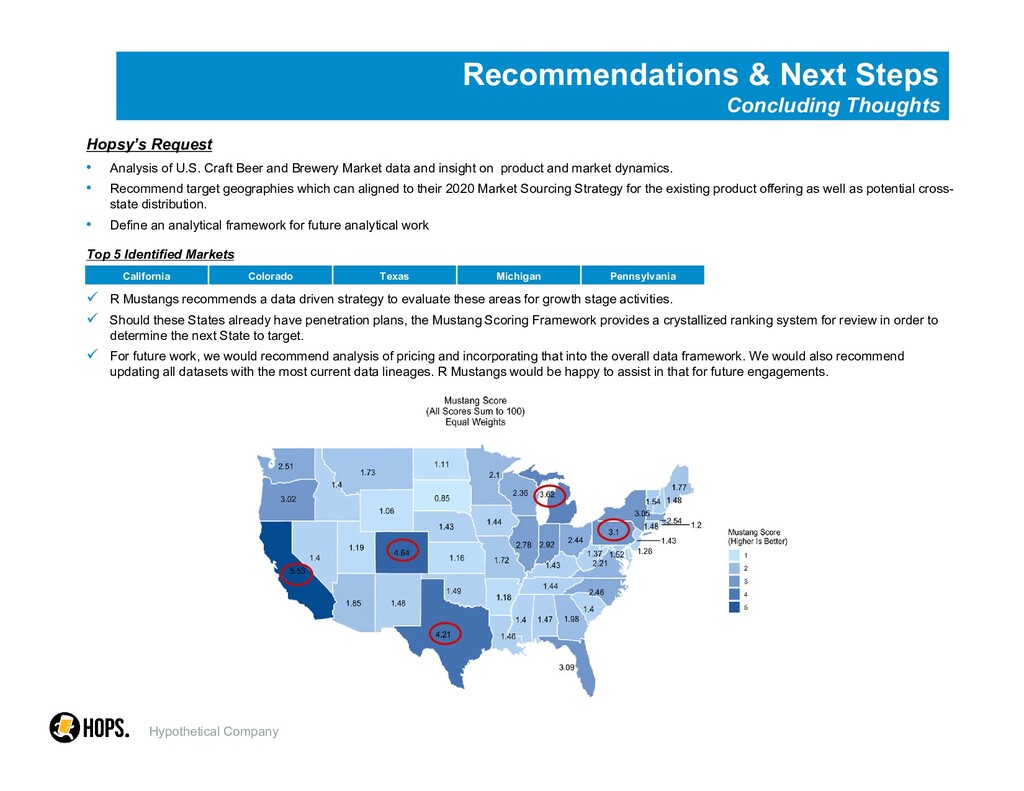
of U.S. Craft Beer and Brewery Market data and insight on product and market dynamics. • Recommend target geographies which can aligned to their 2020 Market Sourcing Strategy for the existing product offering as well as potential cross- state distribution. • Define an analytical framework for future analytical work Top 5 Identified Markets R Mustangs recommends a data driven strategy to evaluate these areas for growth stage activities. Should these States already have penetration plans, the Mustang Scoring Framework provides a crystallized ranking system for review in order to determine the next State to target. For future work, we would recommend analysis of pricing and incorporating that into the overall data framework. We would also recommend updating all datasets with the most current data lineages. R Mustangs would be happy to assist in that for future engagements. Hypothetical Company California Colorado Texas Michigan Pennsylvania
Study – Open ICPSR: https://www.openicpsr.org/openicpsr/project/105583/version/V2/vi ew;jsessionid=843DFC2FBDC320D1624BF92319E643FA?path=/ openicpsr/105583/fcr:versions/V2/apparent_per_capita_alcohol_c onsumption.csv&type – US Census Bureau: https://www2.census.gov/programs- surveys/popproj/datasets/2017/2017-popproj/np2017_d1.csv Hypothetical Company