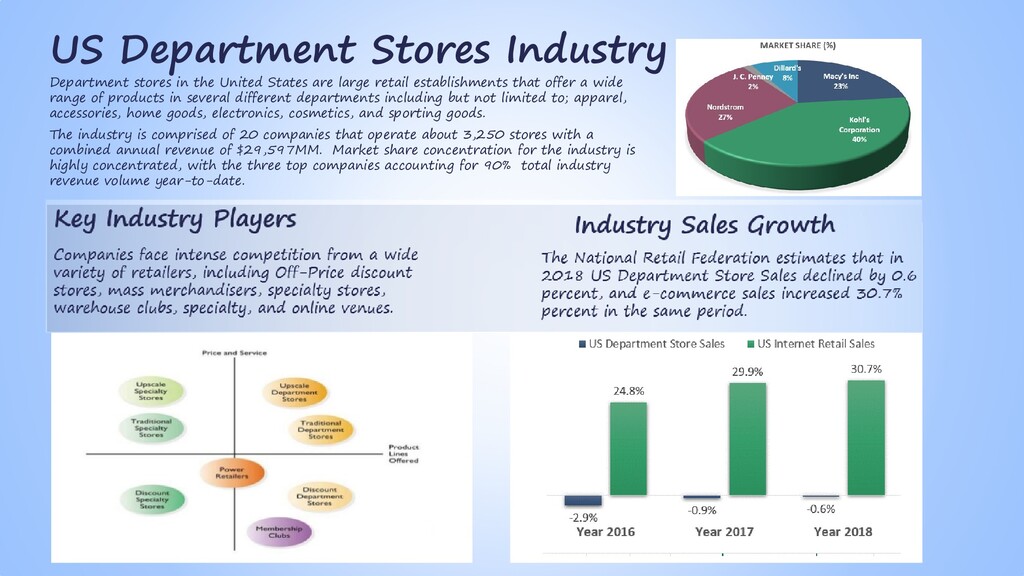
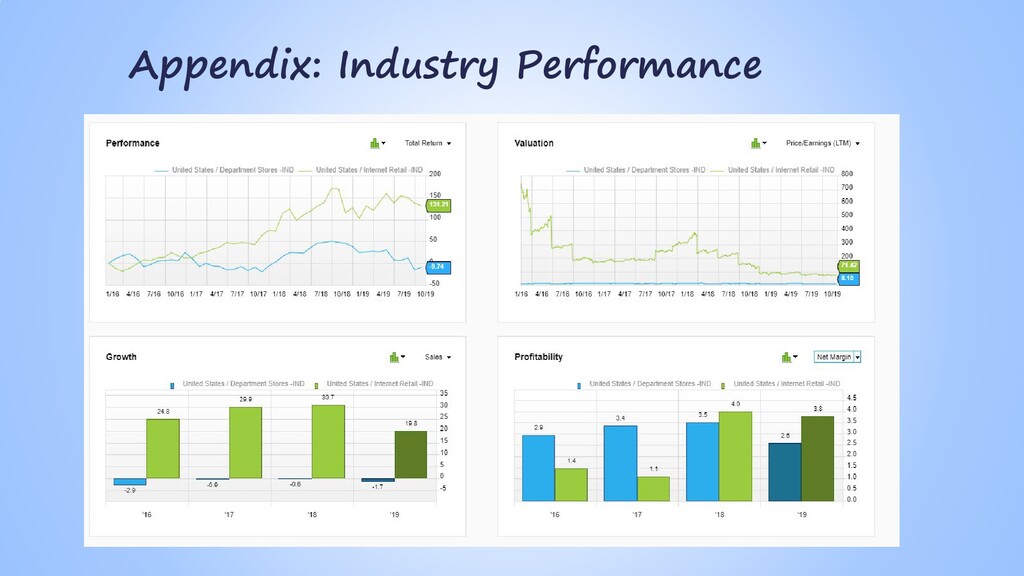
that offer a wide range of products in several different departments including but not limited to; apparel, accessories, home goods, electronics, cosmetics, and sporting goods. The industry is comprised of 20 companies that operate about 3,250 stores with a combined annual revenue of $29,597MM. Market share concentration for the industry is highly concentrated, with the three top companies accounting for 90% total industry revenue volume year-to-date. US Department Stores Industry Companies face intense competition from a wide variety of retailers, including Off-Price discount stores, mass merchandisers, specialty stores, warehouse clubs, specialty, and online venues. Key Industry Players The National Retail Federation estimates that in 2018 US Department Store Sales declined by 0.6 percent, and e-commerce sales increased 30.7% percent in the same period Industry Sales Growth
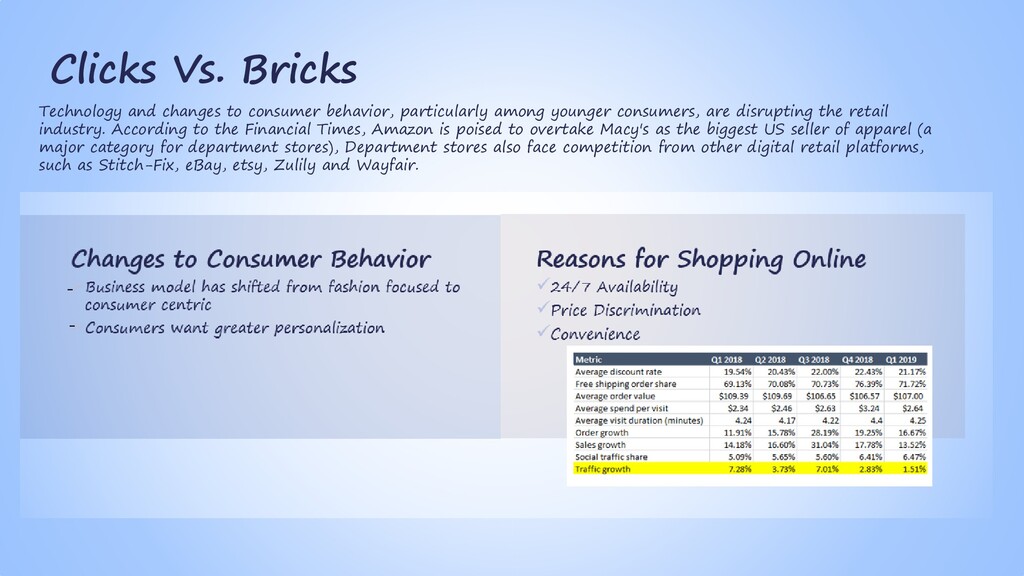
are disrupting the retail industry. According to the Financial Times, Amazon is poised to overtake Macy's as the biggest US seller of apparel (a major category for department stores), Department stores also face competition from other digital retail platforms, such as Stitch-Fix, eBay, etsy, Zulily and Wayfair. Clicks Vs. Bricks - -
behavior has led consumers to shift spend from offline to online. • In-store foot traffic continues to decline as shoppers look to time savings and price discounts by shopping online from the convenience of their home. • As a result, department stores seen a steady decline in profitability, driven by poor inventory turnover and force price markdowns. • Year-to-date, more than 10 multichannel retailers have closed their 8,600 stores and 68 retailers have filed for bankruptcies. • Unless Department Stores evolves their business model that puts customer experience its top priority to meet the changing demands of NextGen consumers, the threat of the Retail Apocalypse is not so far fetched.
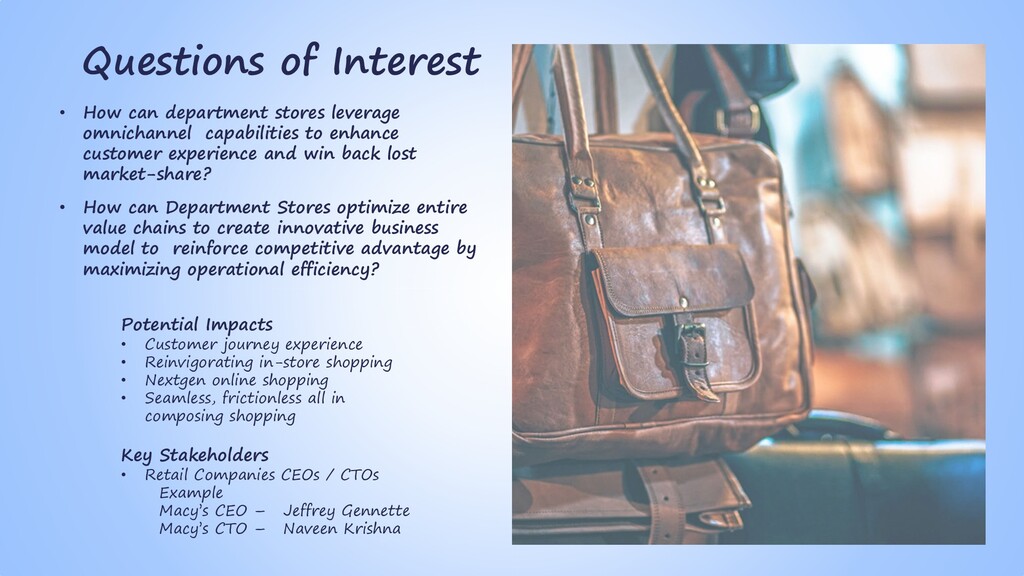
capabilities to enhance customer experience and win back lost market-share? • How can Department Stores optimize entire value chains to create innovative business model to reinforce competitive advantage by maximizing operational efficiency? Potential Impacts • Customer journey experience • Reinvigorating in-store shopping • Nextgen online shopping • Seamless, frictionless all in composing shopping Key Stakeholders • Retail Companies CEOs / CTOs Example Macy’s CEO – Jeffrey Gennette Macy’s CTO – Naveen Krishna
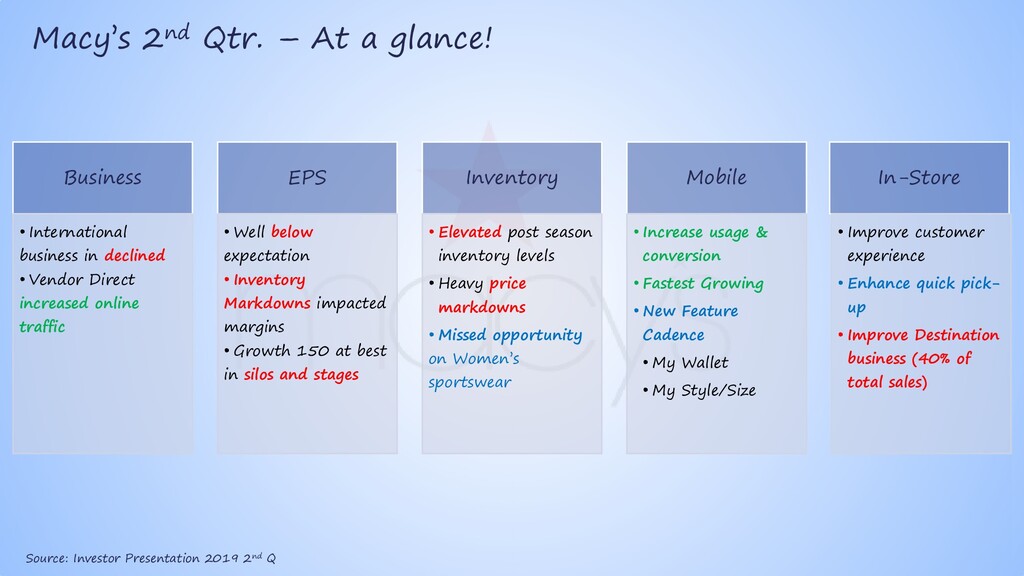
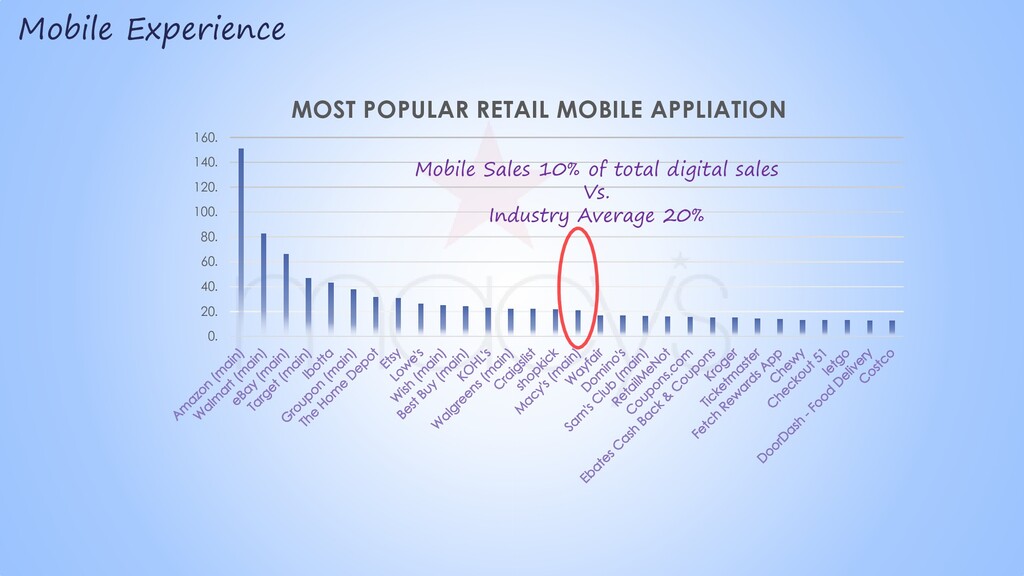
2019 2nd Q Business • International business in declined • Vendor Direct increased online traffic EPS • Well below expectation • Inventory Markdowns impacted margins • Growth 150 at best in silos and stages Inventory • Elevated post season inventory levels • Heavy price markdowns • Missed opportunity on Women’s sportswear Mobile • Increase usage & conversion • Fastest Growing • New Feature Cadence • My Wallet • My Style/Size In-Store • Improve customer experience • Enhance quick pick- up • Improve Destination business (40% of total sales)
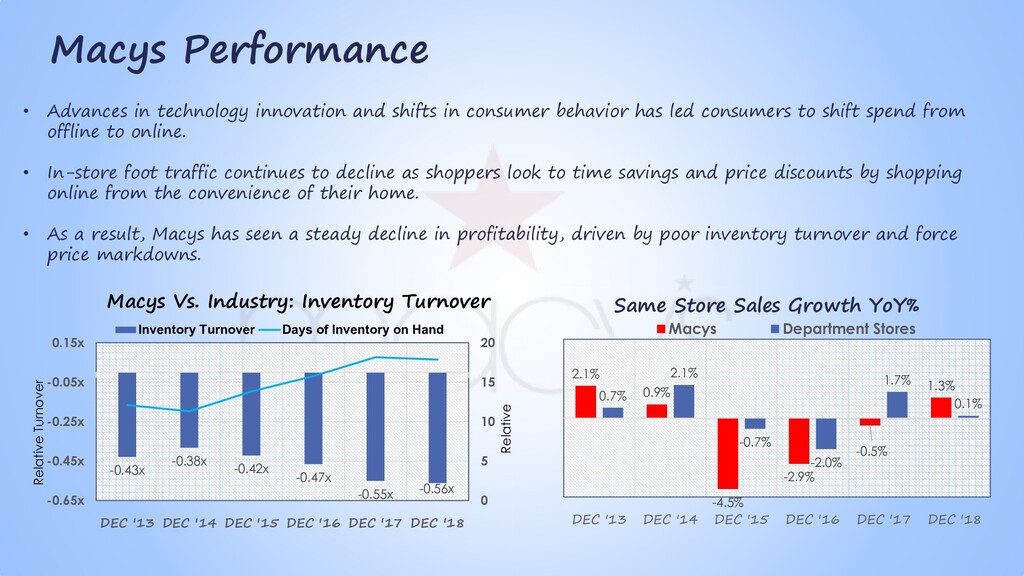
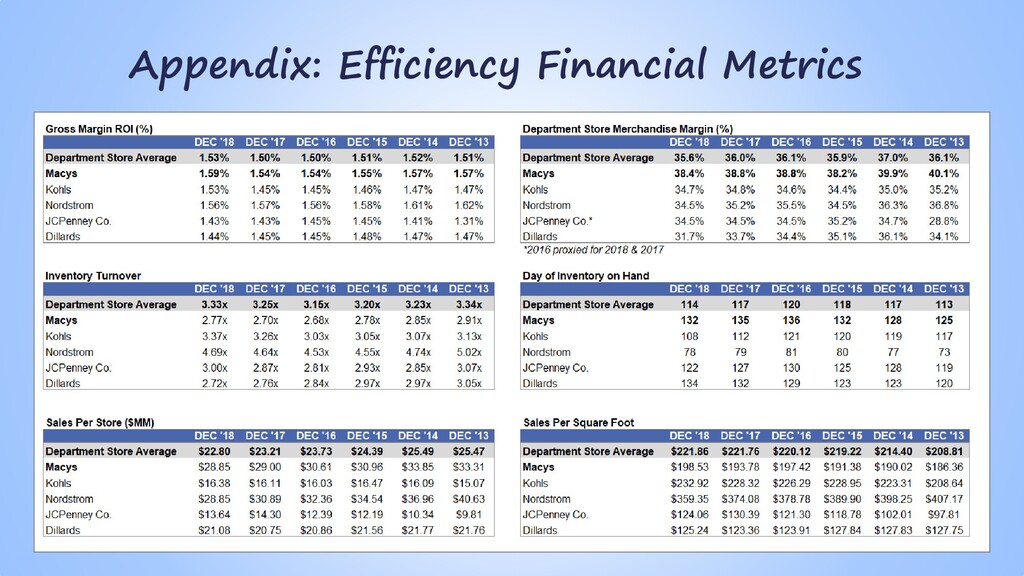
20 -0.65x -0.45x -0.25x -0.05x 0.15x DEC '13 DEC '14 DEC '15 DEC '16 DEC '17 DEC '18 Macys Vs. Industry: Inventory Turnover Inventory Turnover Days of Inventory on Hand Relative Relative Turnover • Advances in technology innovation and shifts in consumer behavior has led consumers to shift spend from offline to online. • In-store foot traffic continues to decline as shoppers look to time savings and price discounts by shopping online from the convenience of their home. • As a result, Macys has seen a steady decline in profitability, driven by poor inventory turnover and force price markdowns. 2.1% 0.9% -4.5% -2.9% -0.5% 1.3% 0.7% 2.1% -0.7% -2.0% 1.7% 0.1% DEC '13 DEC '14 DEC '15 DEC '16 DEC '17 DEC '18 Same Store Sales Growth YoY% Macys Department Stores Macys Performance
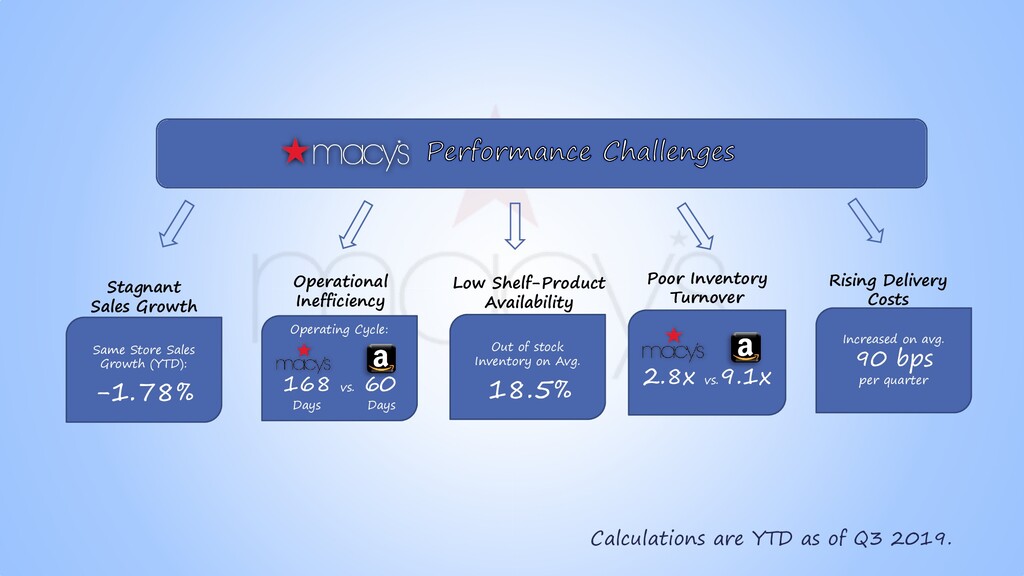
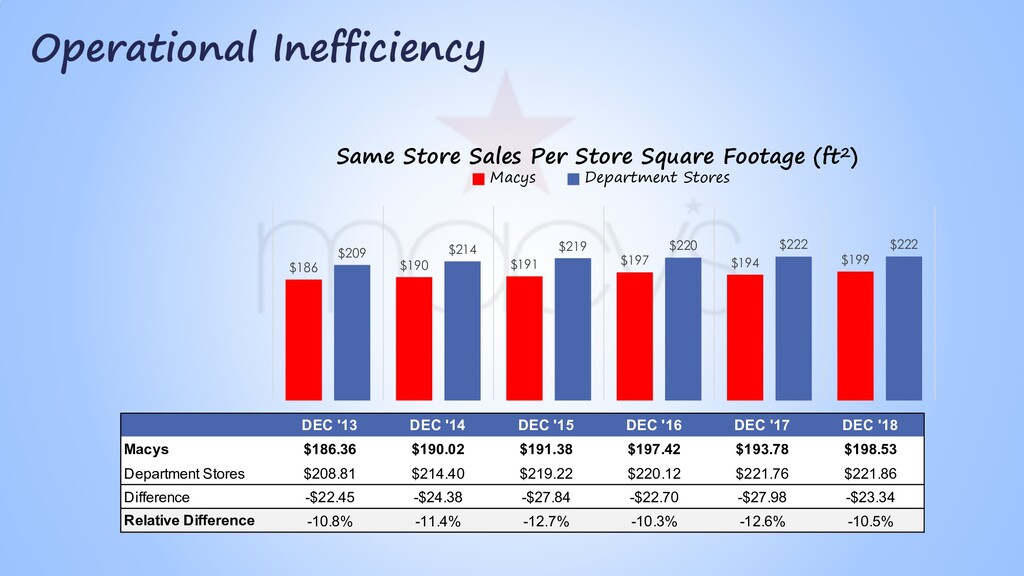
60 Days Days Out of stock Inventory on Avg. 18.5% 2.8x vs. 9.1x Increased on avg. 90 bps per quarter Poor Inventory Turnover Low Shelf-Product Availability Operational Inefficiency Stagnant Sales Growth Rising Delivery Costs Calculations are YTD as of Q3 2019.
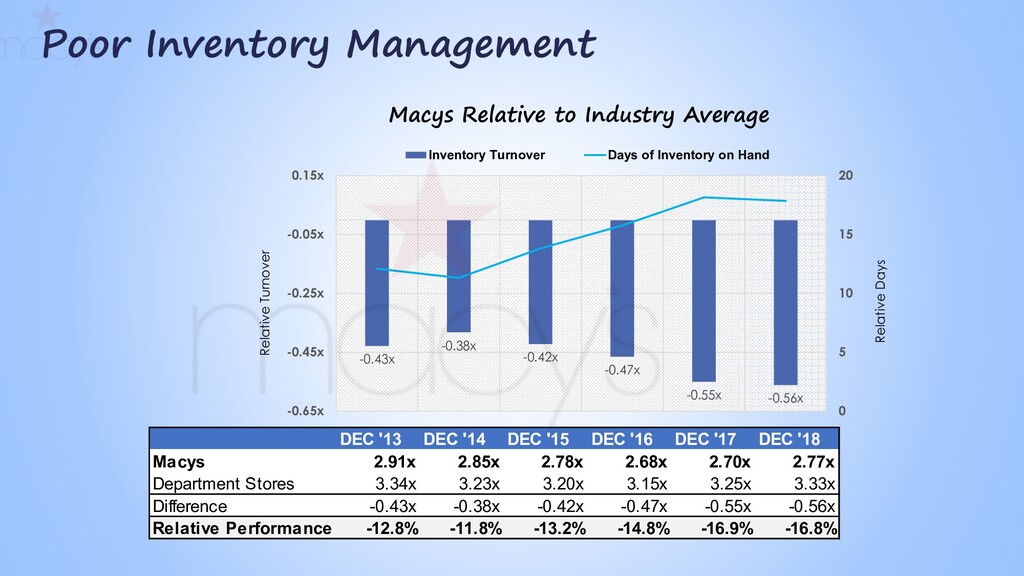
20 -0.65x -0.45x -0.25x -0.05x 0.15x DEC '13 DEC '14 DEC '15 DEC '16 DEC '17 DEC '18 Macys Relative to Industry Average Inventory Turnover Days of Inventory on Hand Relative Days Relative Turnover DEC '13 DEC '14 DEC '15 DEC '16 DEC '17 DEC '18 Macys 2.91x 2.85x 2.78x 2.68x 2.70x 2.77x Department Stores 3.34x 3.23x 3.20x 3.15x 3.25x 3.33x Difference -0.43x -0.38x -0.42x -0.47x -0.55x -0.56x Relative Performance -12.8% -11.8% -13.2% -14.8% -16.9% -16.8% Poor Inventory Management
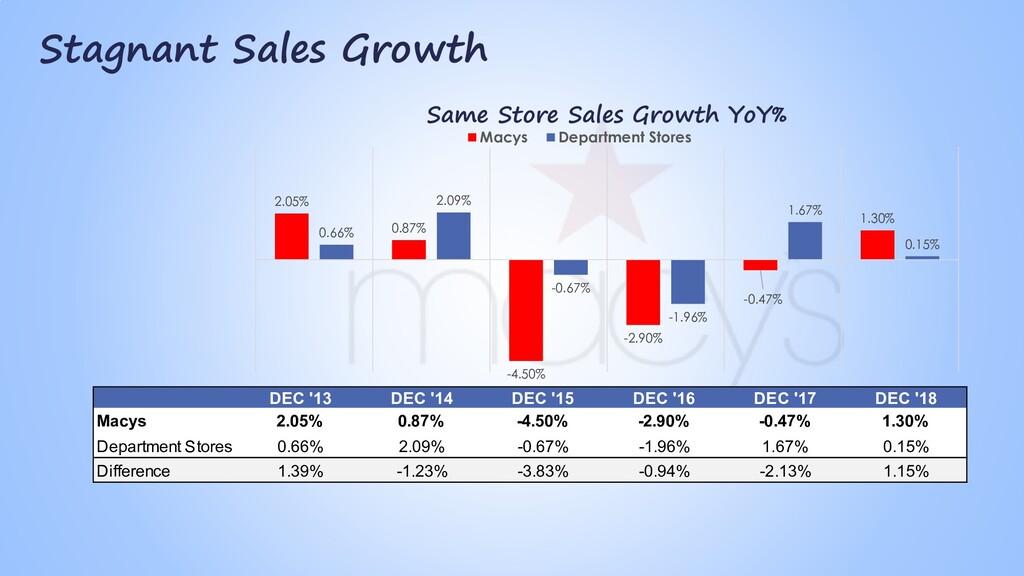
1.67% 0.15% DEC '13 DEC '14 DEC '15 DEC '16 DEC '17 DEC '18 Same Store Sales Growth YoY% Macys Department Stores DEC '13 DEC '14 DEC '15 DEC '16 DEC '17 DEC '18 Macys 2.05% 0.87% -4.50% -2.90% -0.47% 1.30% Department Stores 0.66% 2.09% -0.67% -1.96% 1.67% 0.15% Difference 1.39% -1.23% -3.83% -0.94% -2.13% 1.15% Stagnant Sales Growth
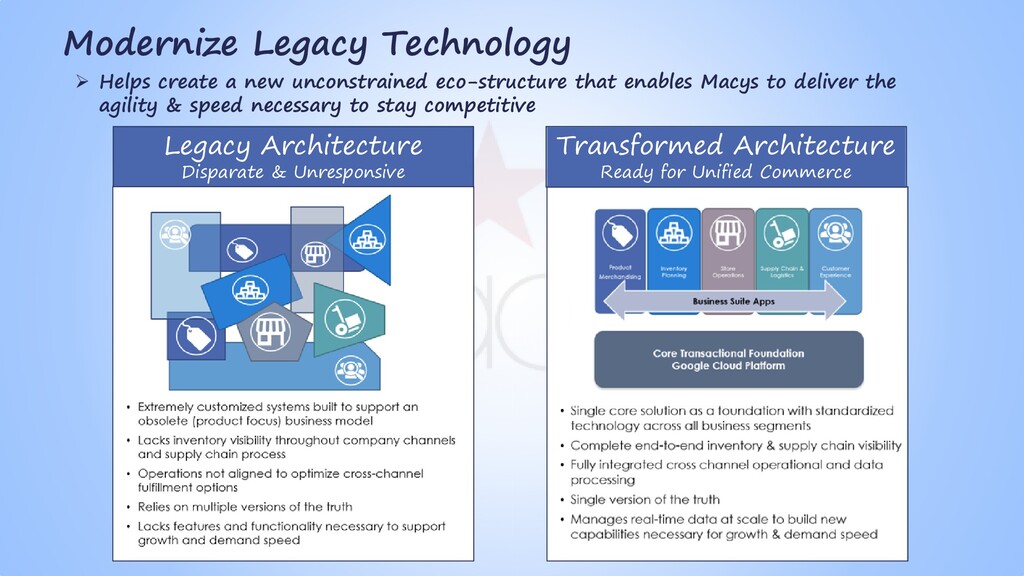
Ready for Unified Commerce Helps create a new unconstrained eco-structure that enables Macys to deliver the agility & speed necessary to stay competitive
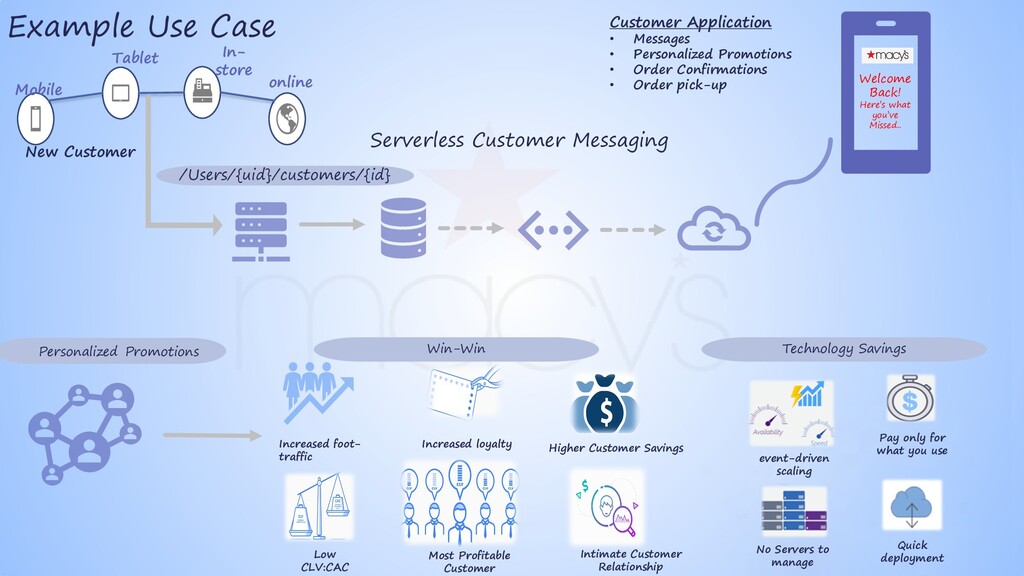
Messages • Personalized Promotions • Order Confirmations • Order pick-up Serverless Customer Messaging /Users/{uid}/customers/{id} Welcome Back! Here’s what you’ve Missed.. Personalized Promotions Most Profitable Customer Low CLV:CAC Increased foot- traffic Increased loyalty Intimate Customer Relationship Higher Customer Savings Win-Win Technology Savings Pay only for what you use event-driven scaling Quick deployment No Servers to manage Example Use Case
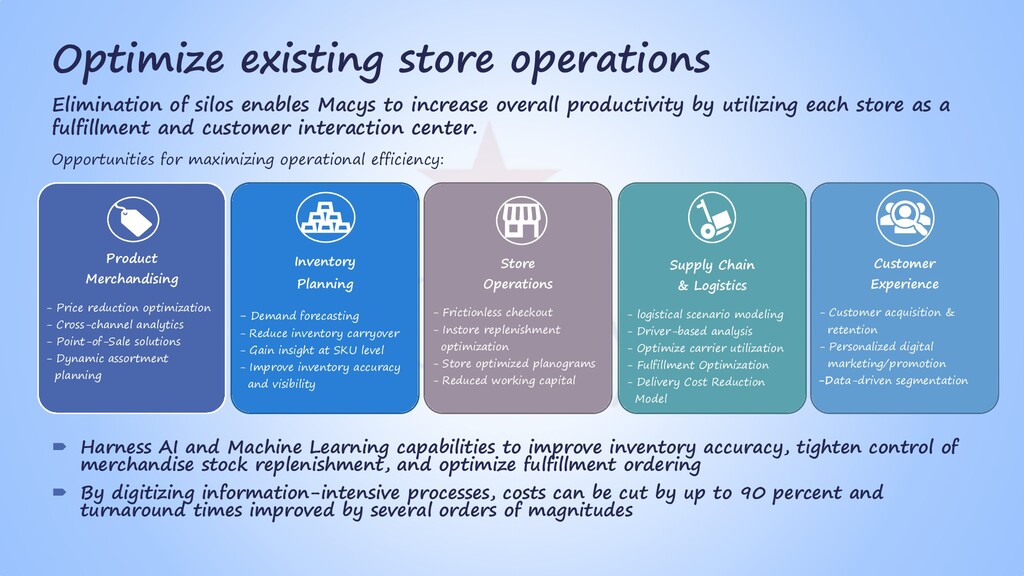
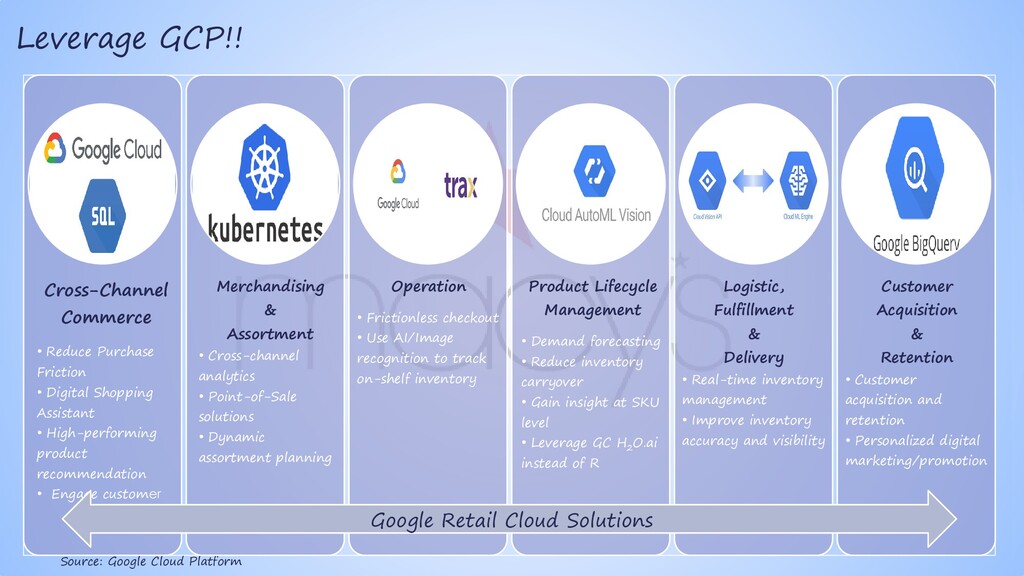
capabilities to improve inventory accuracy, tighten control of merchandise stock replenishment, and optimize fulfillment ordering By digitizing information-intensive processes, costs can be cut by up to 90 percent and turnaround times improved by several orders of magnitudes Product Merchandising - Price reduction optimization - Cross-channel analytics - Point-of-Sale solutions - Dynamic assortment planning Inventory Planning - Demand forecasting - Reduce inventory carryover - Gain insight at SKU level - Improve inventory accuracy and visibility Store Operations - Frictionless checkout - Instore replenishment optimization - Store optimized planograms - Reduced working capital Supply Chain & Logistics - logistical scenario modeling - Driver-based analysis - Optimize carrier utilization - Fulfillment Optimization - Delivery Cost Reduction Model Customer Experience - Customer acquisition & retention - Personalized digital marketing/promotion -Data-driven segmentation Elimination of silos enables Macys to increase overall productivity by utilizing each store as a fulfillment and customer interaction center. Opportunities for maximizing operational efficiency:
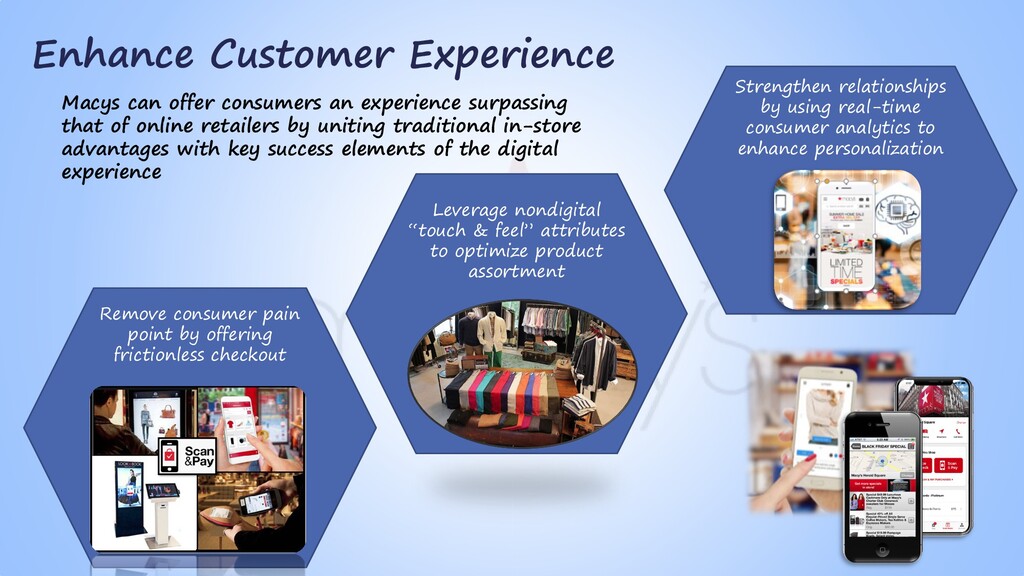
that of online retailers by uniting traditional in-store advantages with key success elements of the digital experience Leverage nondigital “touch & feel” attributes to optimize product assortment Remove consumer pain point by offering frictionless checkout Strengthen relationships by using real-time consumer analytics to enhance personalization
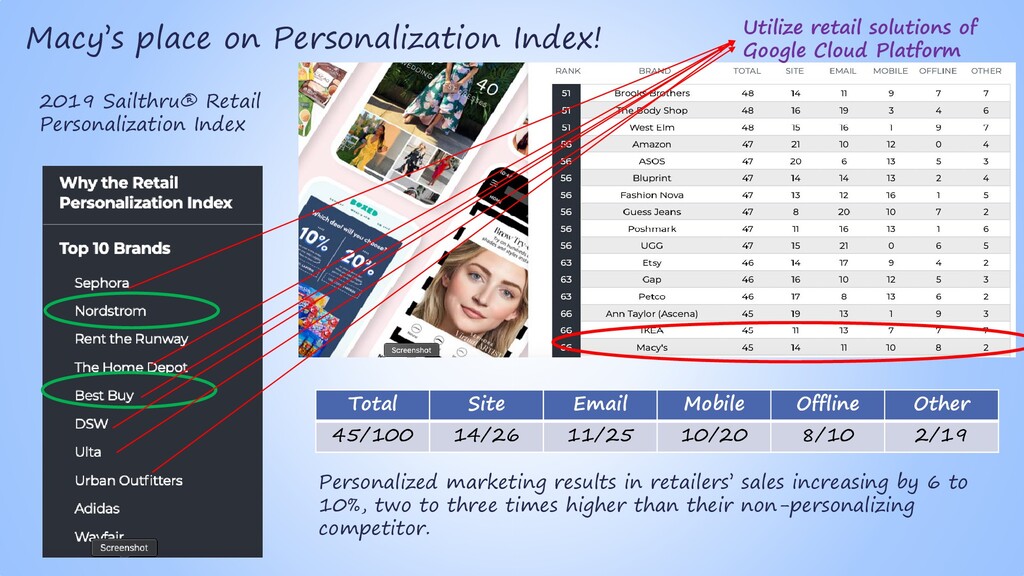
Total Site Email Mobile Offline Other 45/100 14/26 11/25 10/20 8/10 2/19 Personalized marketing results in retailers’ sales increasing by 6 to 10%, two to three times higher than their non-personalizing competitor. Utilize retail solutions of Google Cloud Platform
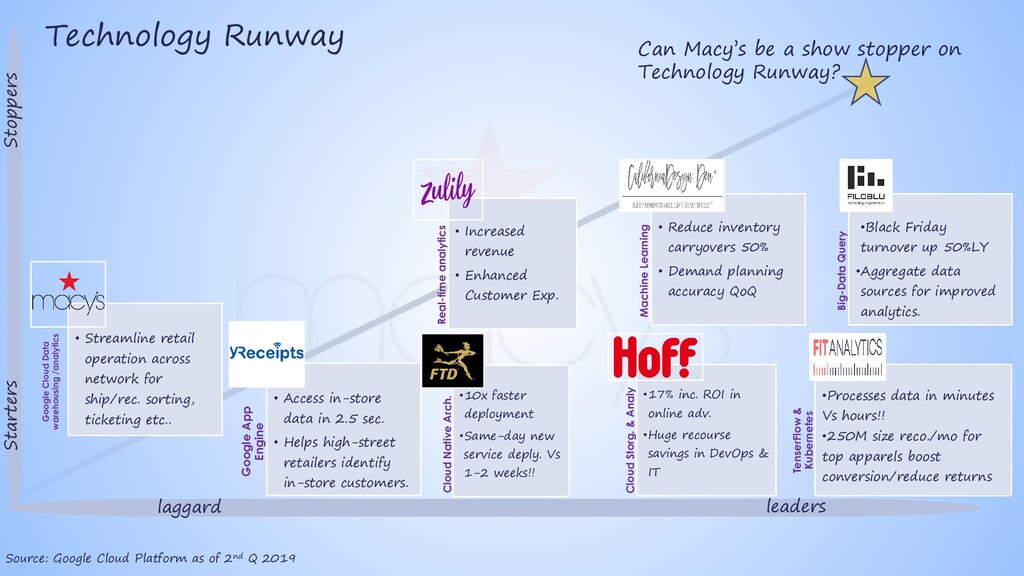
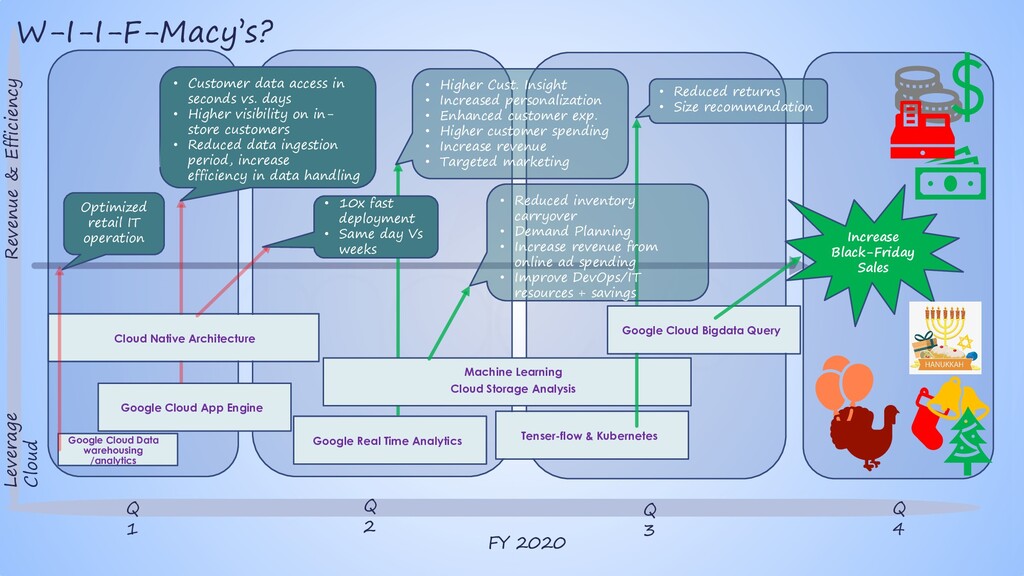
2019 Stoppers Starters Real-time analytics • Increased revenue • Enhanced Customer Exp. Machine Learning • Reduce inventory carryovers 50% • Demand planning accuracy QoQ Big-Data Query •Black Friday turnover up 50%LY •Aggregate data sources for improved analytics. Cloud Native Arch. •10x faster deployment •Same-day new service deply. Vs 1-2 weeks!! Cloud Storg. & Analy •17% inc. ROI in online adv. •Huge recourse savings in DevOps & IT TenserFlow & Kubernetes •Processes data in minutes Vs hours!! •250M size reco./mo for top apparels boost conversion/reduce returns Google App Engine • Access in-store data in 2.5 sec. • Helps high-street retailers identify in-store customers. Google Cloud Data warehousing /analytics • Streamline retail operation across network for ship/rec. sorting, ticketing etc.. Technology Runway Can Macy’s be a show stopper on Technology Runway?
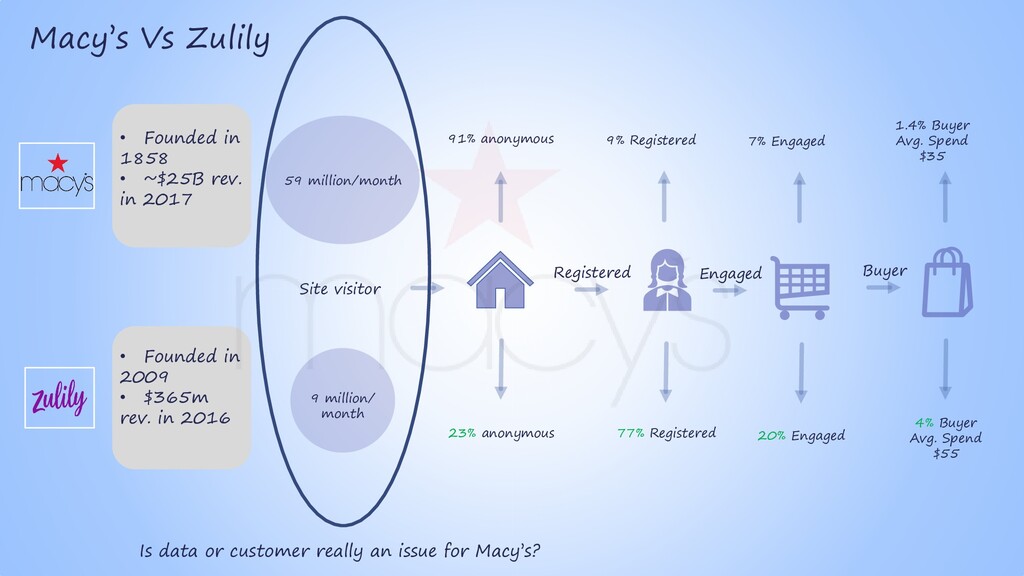
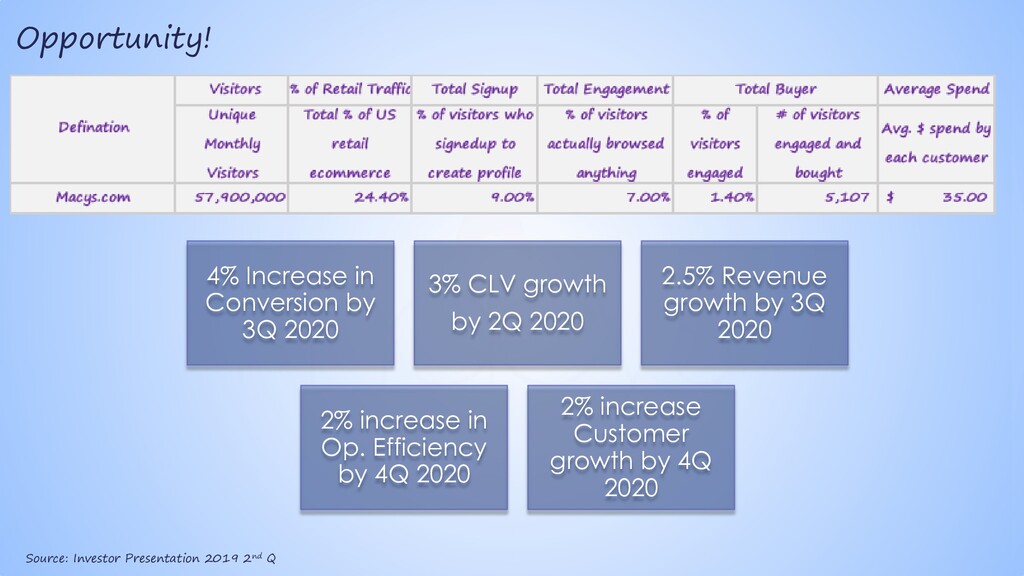
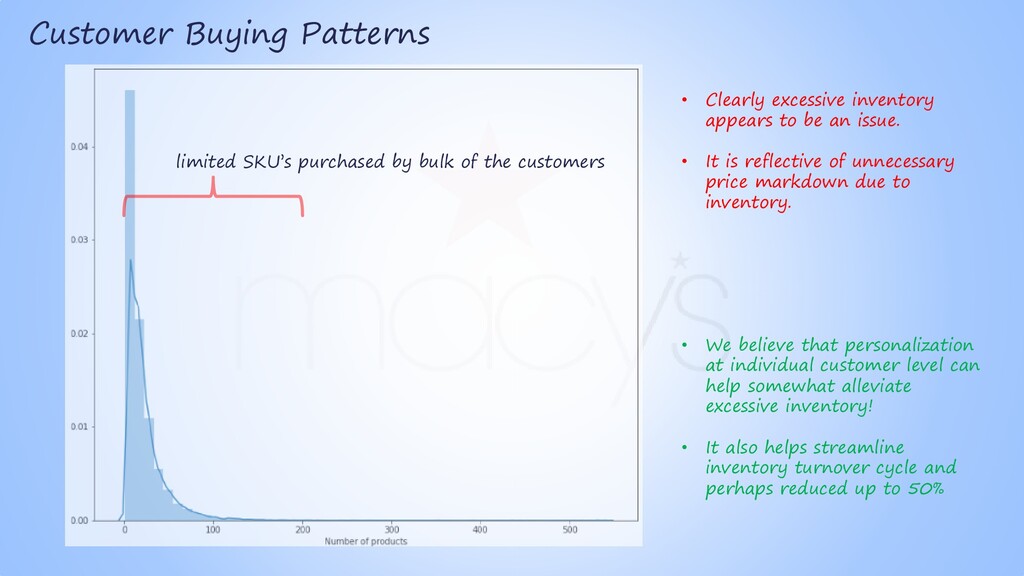
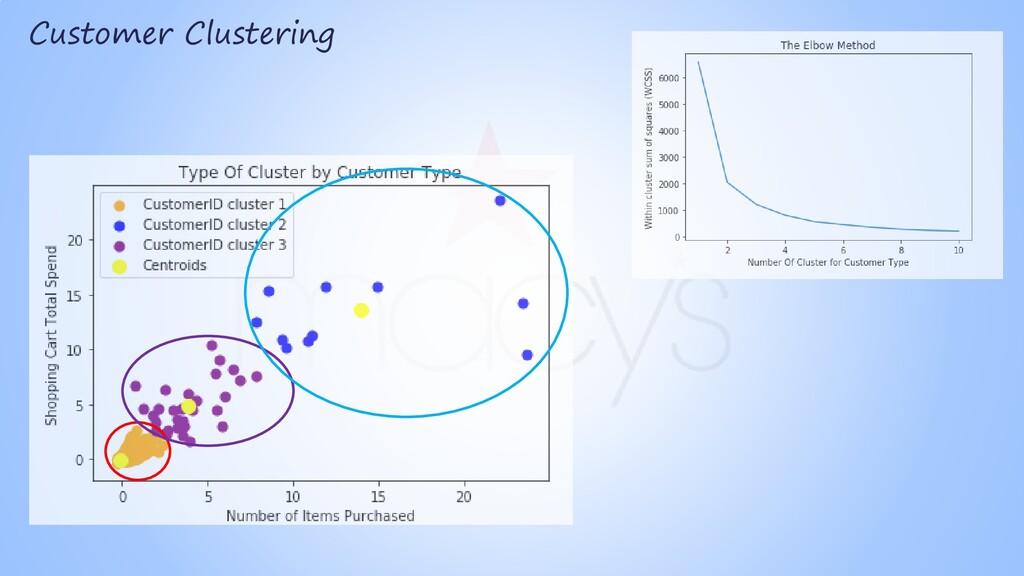
an issue. • It is reflective of unnecessary price markdown due to inventory. limited SKU’s purchased by bulk of the customers • We believe that personalization at individual customer level can help somewhat alleviate excessive inventory! • It also helps streamline inventory turnover cycle and perhaps reduced up to 50%
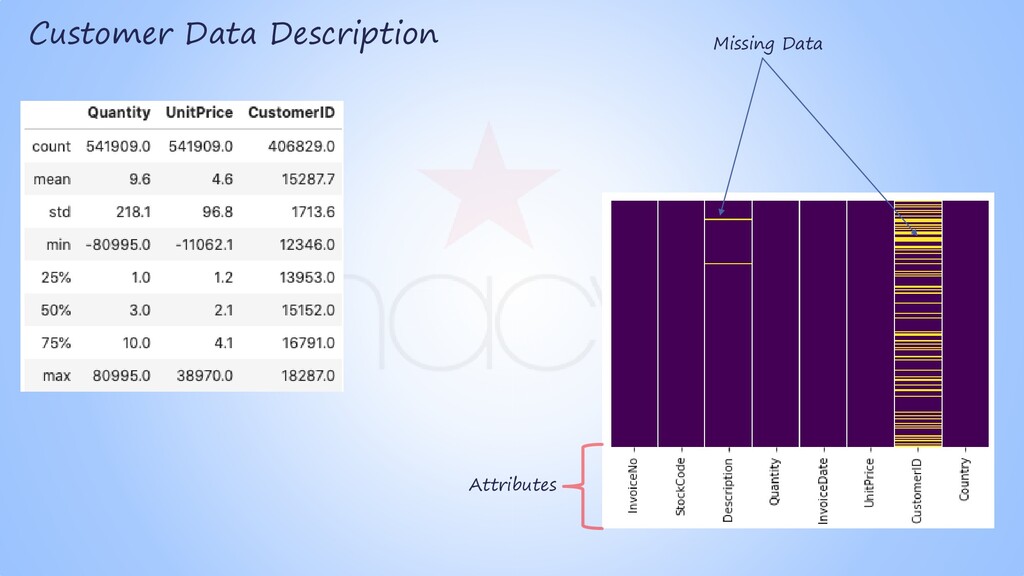
the MSDS program for the Retail Customer Spending data. - Our analysis were limited to given data constraint. - We like to have more data to continue our analysis - More granular customer behavior data - Most recent data at least 3 years - We were able to analyze transaction/yr., # of orders/customer - Highest spending customer - The observation of 'per customer baskets' and their value enabled customer clustering.