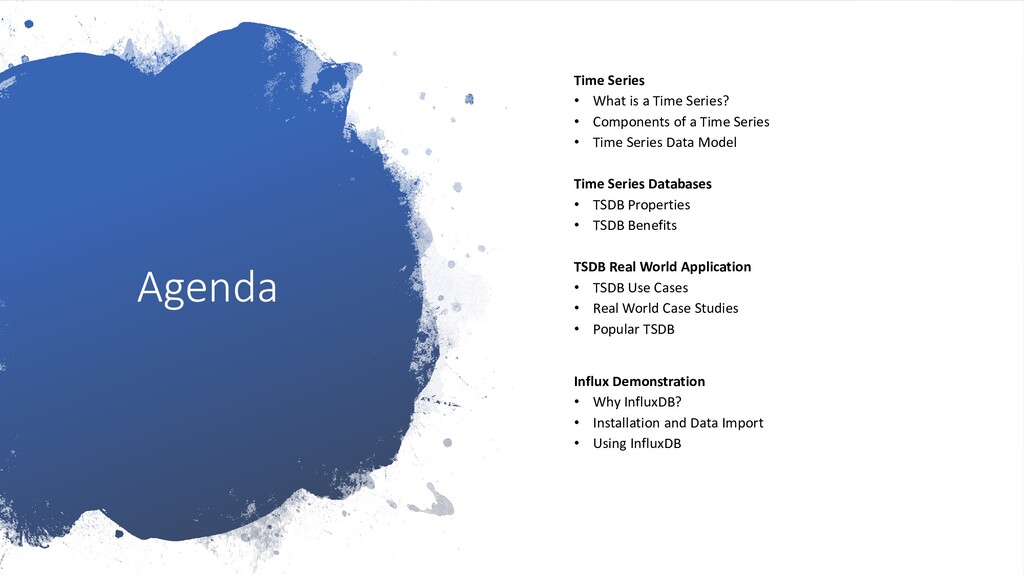
Components of a Time Series • Time Series Data Model Time Series Databases • TSDB Properties • TSDB Benefits TSDB Real World Application • TSDB Use Cases • Real World Case Studies • Popular TSDB Influx Demonstration • Why InfluxDB? • Installation and Data Import • Using InfluxDB
the movements of a time series is called trend. • Long-term trends are generally considered over a year or more period. • Ex. The sales increase/decrease over a period of time • Seasonal variations which occurs periodically and fluctuates over shore span in a time series. • Ex. Temperature rise during summer and drop in winter Trends • Long-term Trends • Short-term Trends
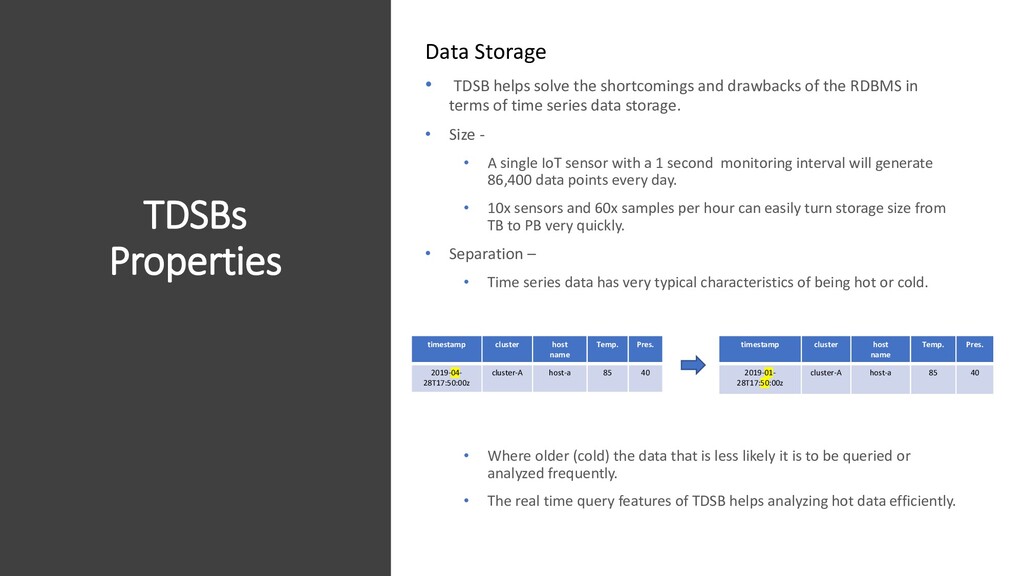
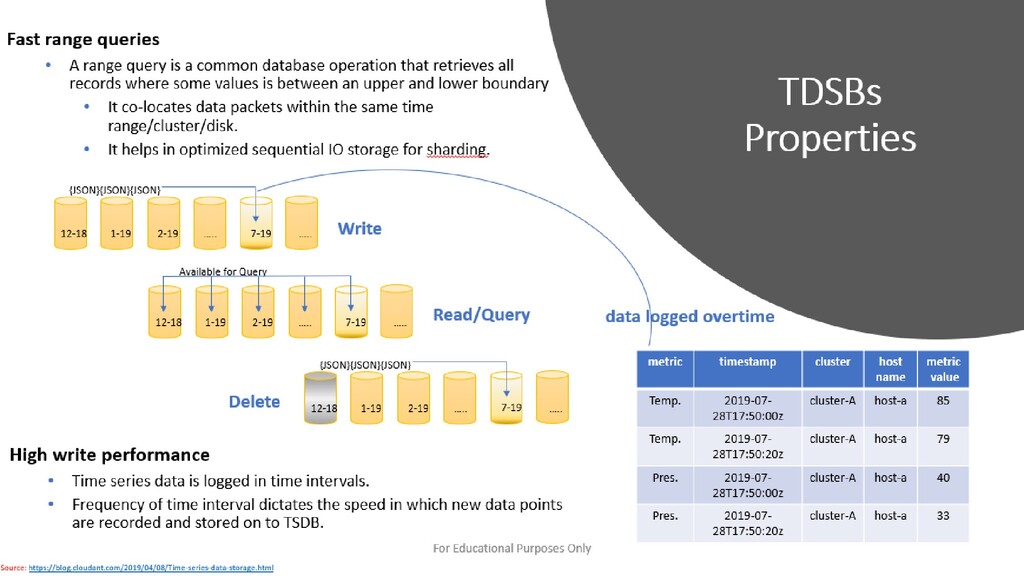
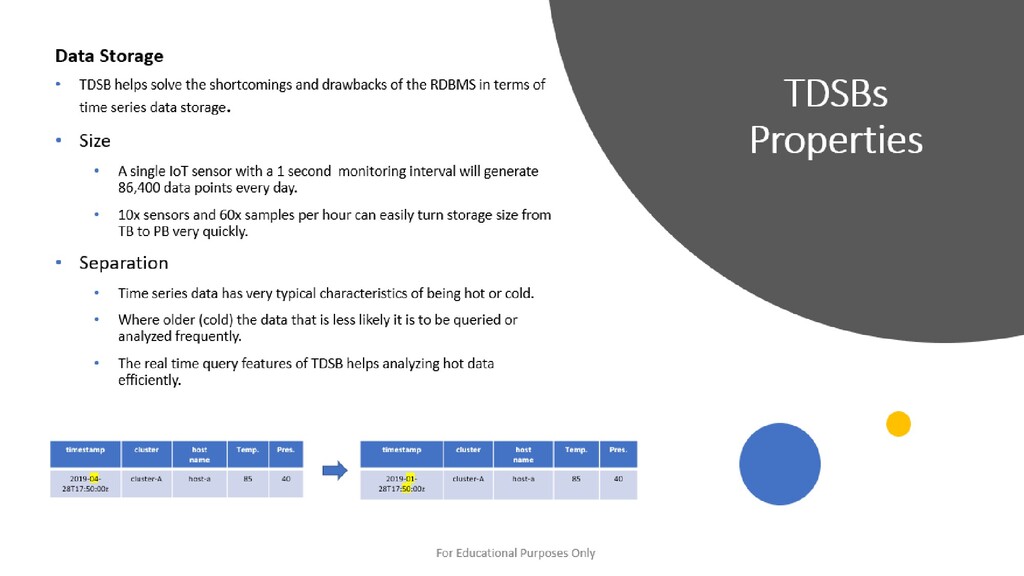
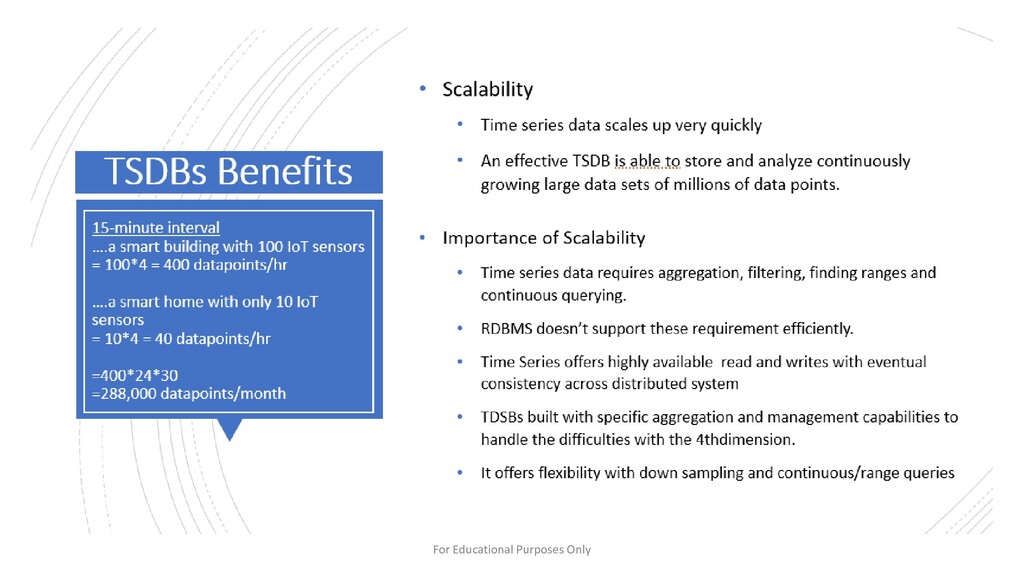
and drawbacks of the RDBMS in terms of time series data storage. • Size - • A single IoT sensor with a 1 second monitoring interval will generate 86,400 data points every day. • 10x sensors and 60x samples per hour can easily turn storage size from TB to PB very quickly. • Separation – • Time series data has very typical characteristics of being hot or cold. • Where older (cold) the data that is less likely it is to be queried or analyzed frequently. • The real time query features of TDSB helps analyzing hot data efficiently. timestamp cluster host name Temp. Pres. 2019-04- 28T17:50:00z cluster-A host-a 85 40 timestamp cluster host name Temp. Pres. 2019-01- 28T17:50:00z cluster-A host-a 85 40
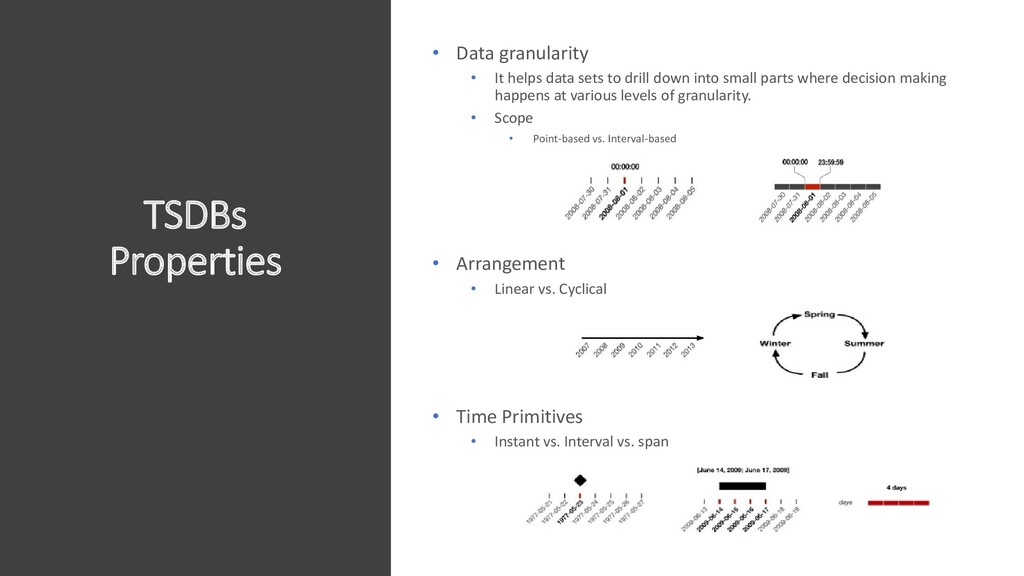
to drill down into small parts where decision making happens at various levels of granularity. • Scope • Point-based vs. Interval-based • Arrangement • Linear vs. Cyclical • Time Primitives • Instant vs. Interval vs. span
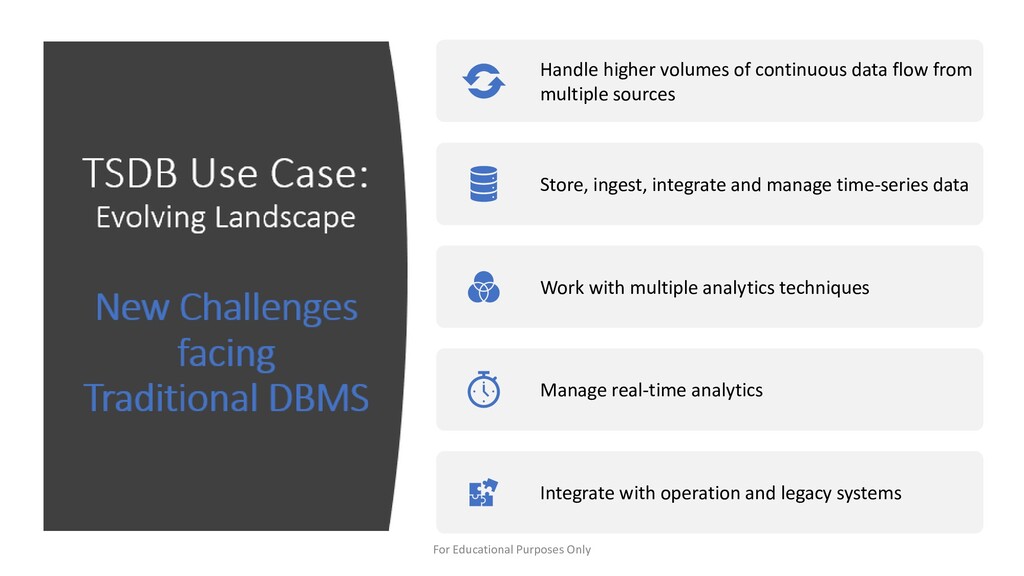
Store, ingest, integrate and manage time-series data Work with multiple analytics techniques Manage real-time analytics Integrate with operation and legacy systems For Educational Purposes Only
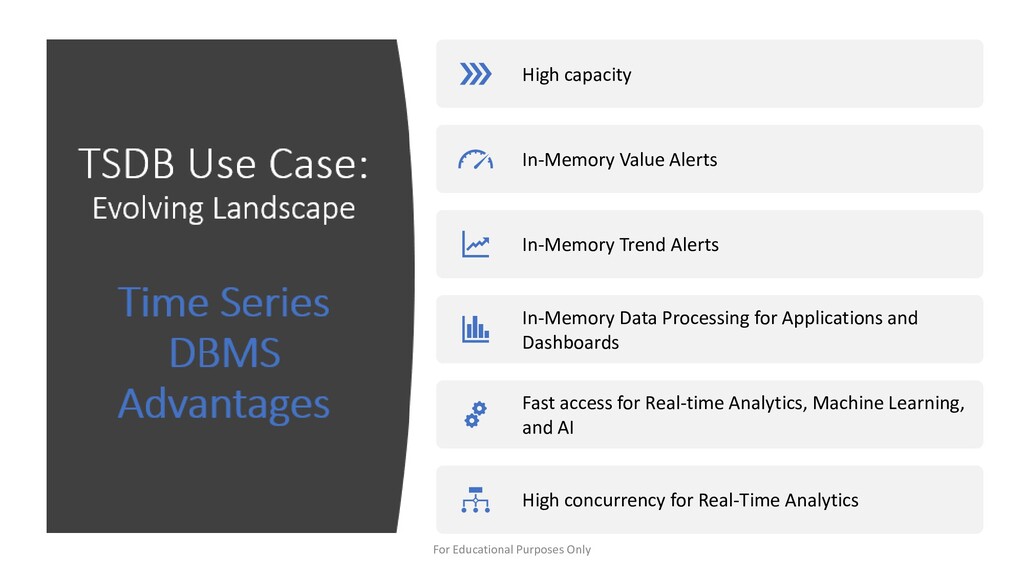
Processing for Applications and Dashboards Fast access for Real-time Analytics, Machine Learning, and AI High concurrency for Real-Time Analytics For Educational Purposes Only
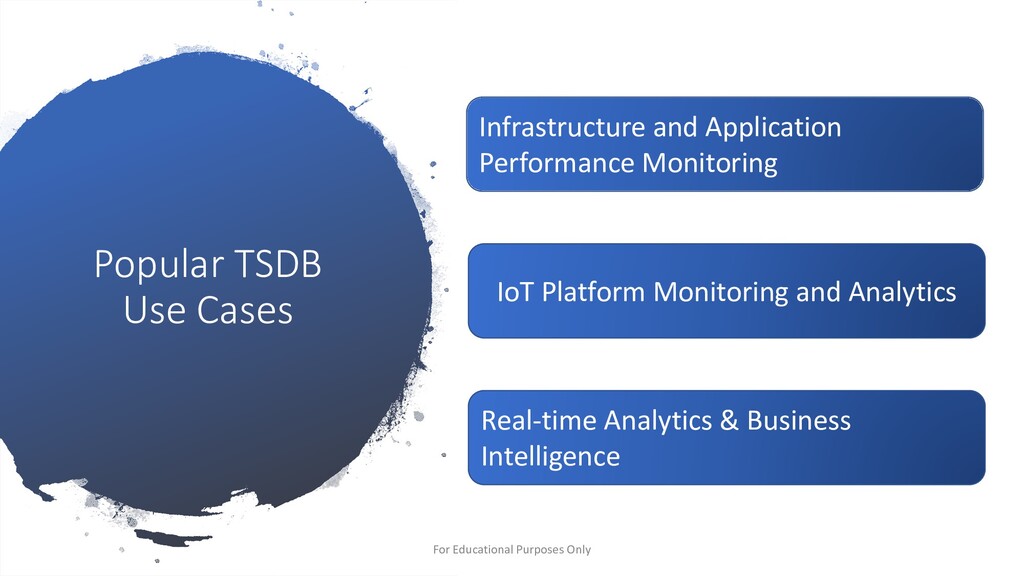
infrastructure and application monitoring using time series databases helps to identify problems before they negatively impact critical business procedures or begin to cause system failures. • Aims to detect and diagnose complex application performance problems to provide end users with a high-quality experience and to maintain expected levels of service. For Educational Purposes Only
your applications’ performance? • Gain early detection of anomalies • Anticipate service disruptions. • Reduce time to remediation and recovery • Optimize user experience • Monitor user traffic to keep experiences consistent • Translates to higher conversion and retention rates • Automate workflows • Use intelligent triggers integrated with auto- remediation to help reduce potential breakpoints For Educational Purposes Only
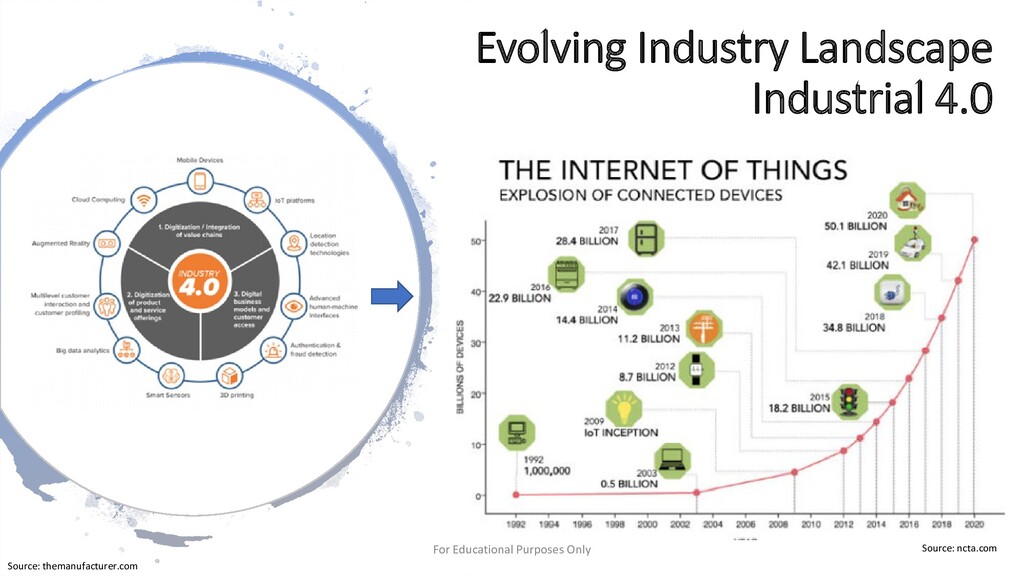
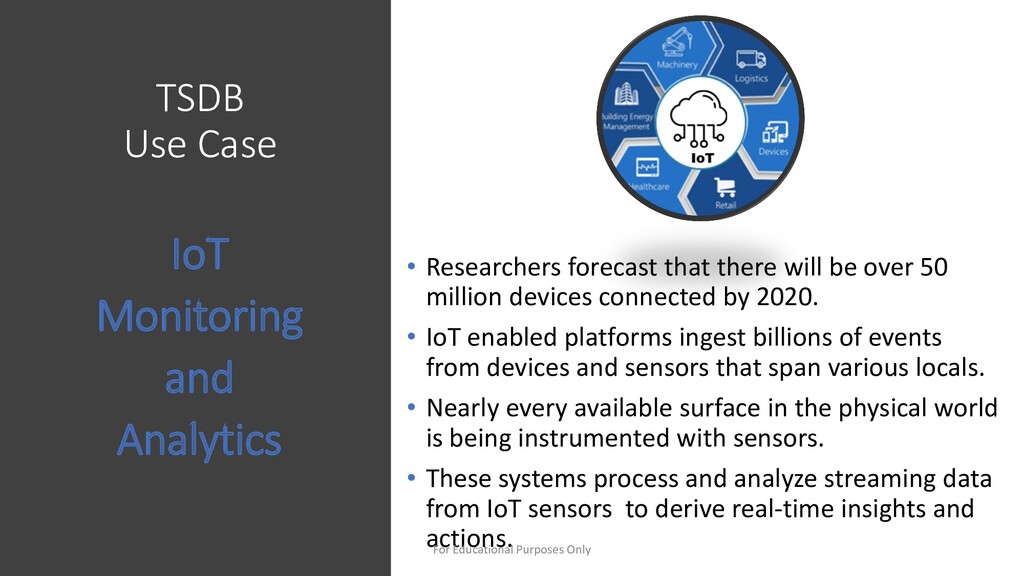
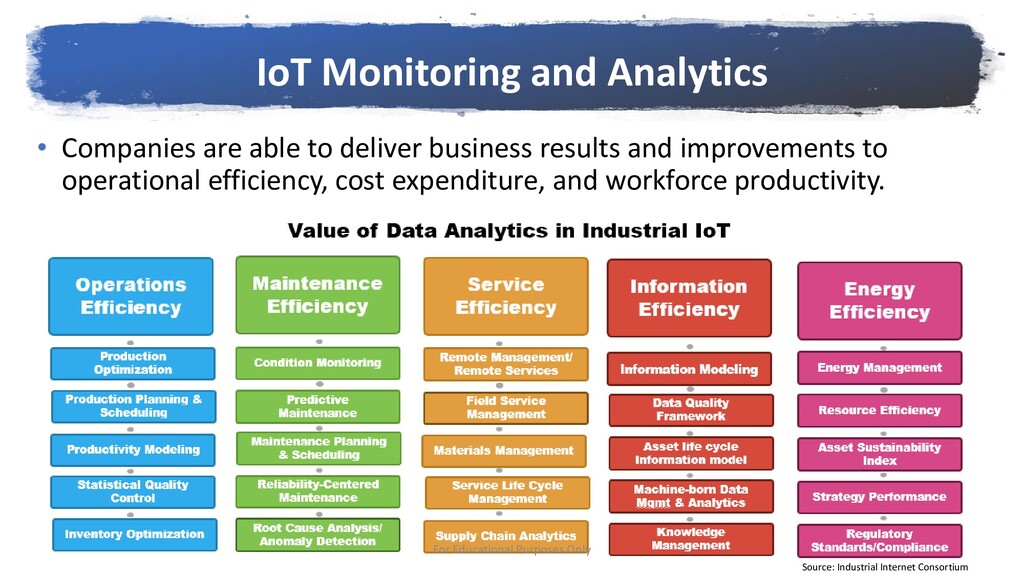
over 50 million devices connected by 2020. • IoT enabled platforms ingest billions of events from devices and sensors that span various locals. • Nearly every available surface in the physical world is being instrumented with sensors. • These systems process and analyze streaming data from IoT sensors to derive real-time insights and actions. IoT Monitoring and Analytics For Educational Purposes Only
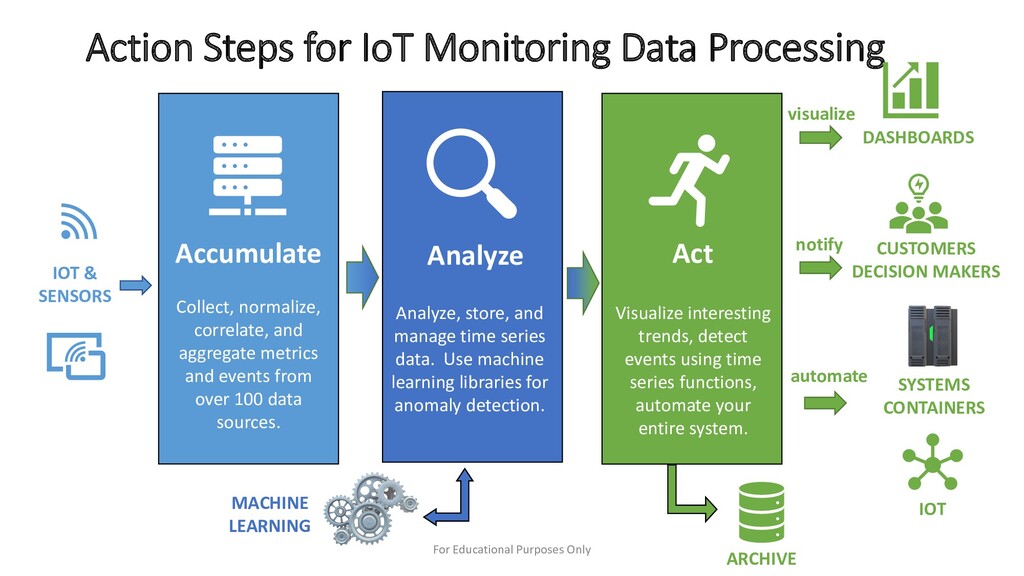
Accumulate Collect, normalize, correlate, and aggregate metrics and events from over 100 data sources. Analyze Analyze, store, and manage time series data. Use machine learning libraries for anomaly detection. Act Visualize interesting trends, detect events using time series functions, automate your entire system. visualize notify automate ARCHIVE MACHINE LEARNING IOT SYSTEMS CONTAINERS CUSTOMERS DECISION MAKERS DASHBOARDS IOT & SENSORS For Educational Purposes Only
to operational efficiency, cost expenditure, and workforce productivity. IoT Monitoring and Analytics For Educational Purposes Only Source: Industrial Internet Consortium
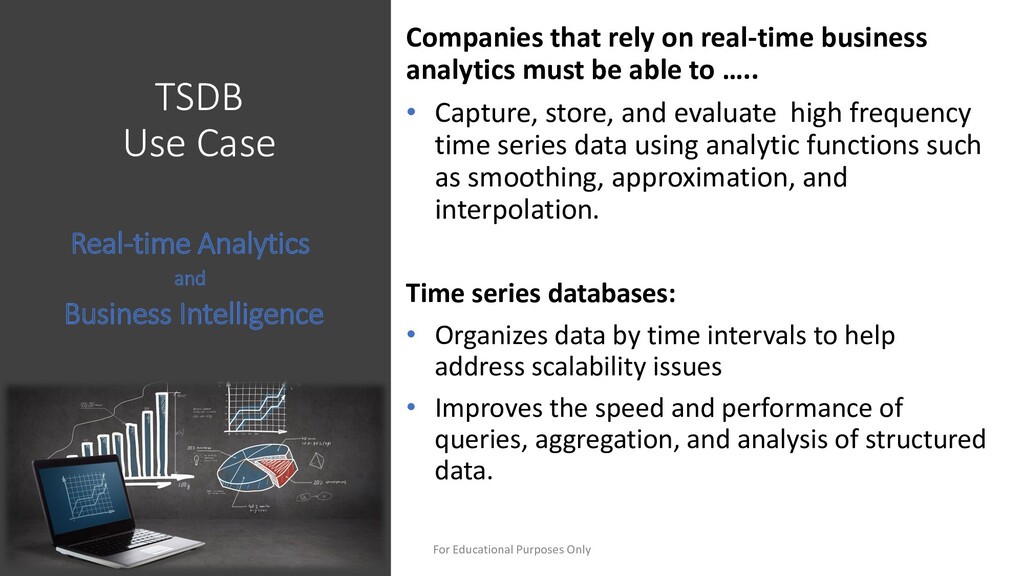
must be able to ….. • Capture, store, and evaluate high frequency time series data using analytic functions such as smoothing, approximation, and interpolation. Time series databases: • Organizes data by time intervals to help address scalability issues • Improves the speed and performance of queries, aggregation, and analysis of structured data. Real-time Analytics and Business Intelligence For Educational Purposes Only
time data with advanced analytics to obtain actionable insights that can be used for…….. • Improved decision making • Driving greater customer engagement • Improving products and services Real-time Analytics and Business Intelligence For Educational Purposes Only
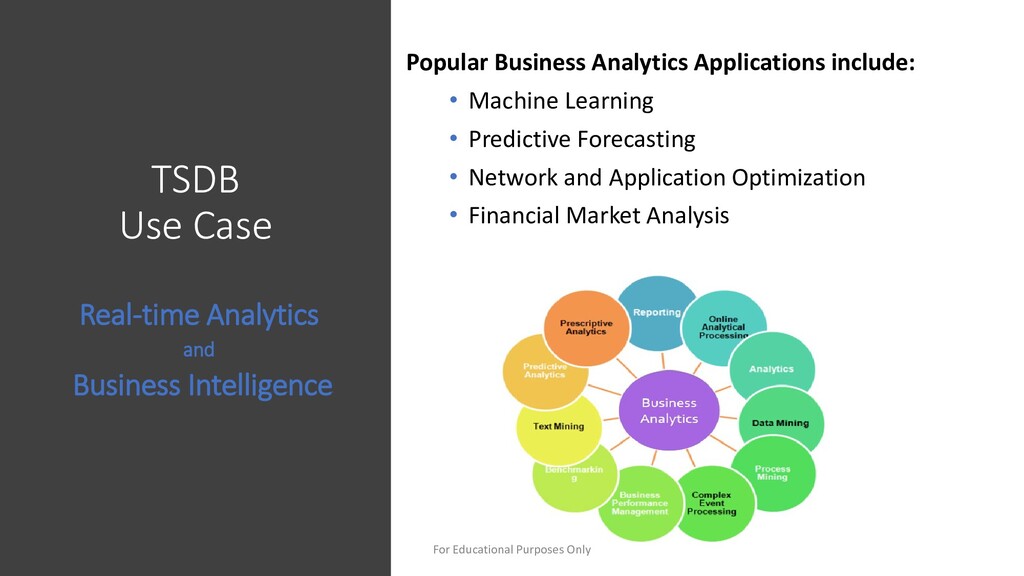
Learning • Predictive Forecasting • Network and Application Optimization • Financial Market Analysis Real-time Analytics and Business Intelligence For Educational Purposes Only
second-largest broadcasting and cable television company in the world by revenue and the largest home Internet service provider in the United States. Use Case Summary Leveraged the capabilities unique to TSDB to developed a new strategy for monitoring cloud and container-based environments Primary Goals: • Remove infrastructure heavy lifting • Consolidate tooling • Provide transparency • Drive efficiencies and identify opportunities • Provide application metrics for developers For Educational Purposes Only
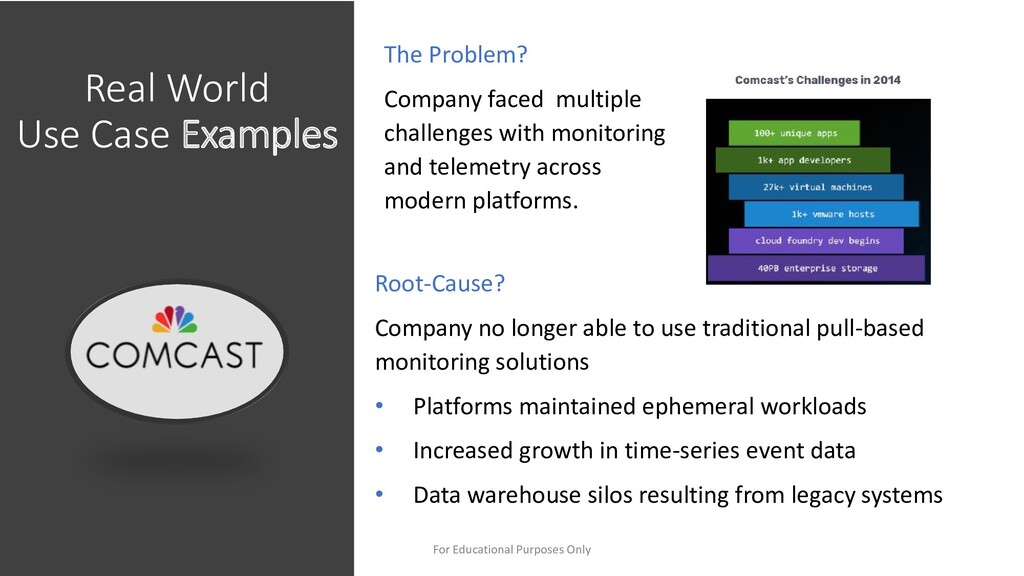
challenges with monitoring and telemetry across modern platforms. Root-Cause? Company no longer able to use traditional pull-based monitoring solutions • Platforms maintained ephemeral workloads • Increased growth in time-series event data • Data warehouse silos resulting from legacy systems For Educational Purposes Only
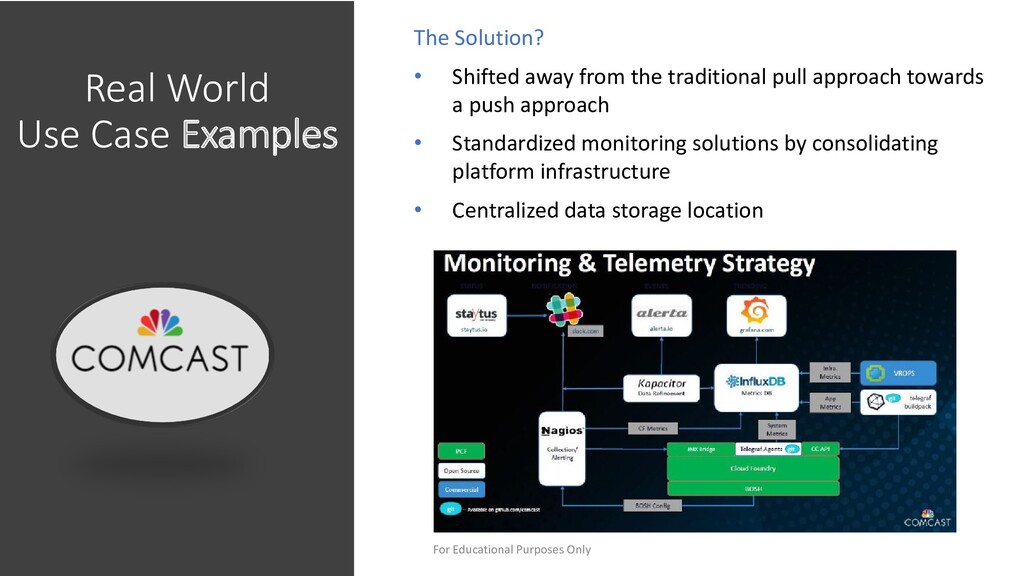
from the traditional pull approach towards a push approach • Standardized monitoring solutions by consolidating platform infrastructure • Centralized data storage location For Educational Purposes Only
how they manage infrastructure, and how they deliver products • Removed infrastructure heavy lifting • Consolidated tooling • Full transparency throughout the environment • Increased operational efficiency • App metrics are born with new products as they launch For Educational Purposes Only
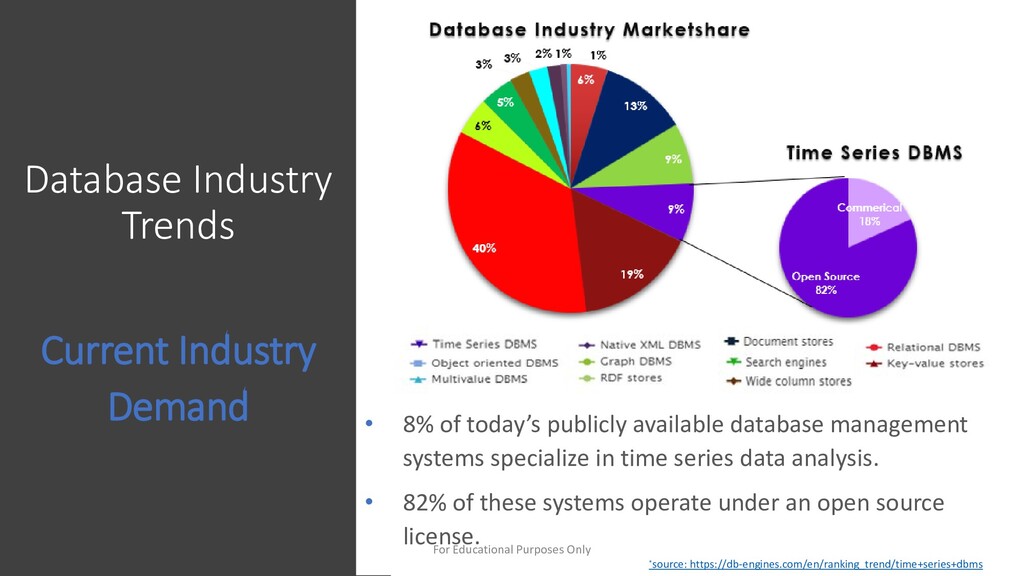
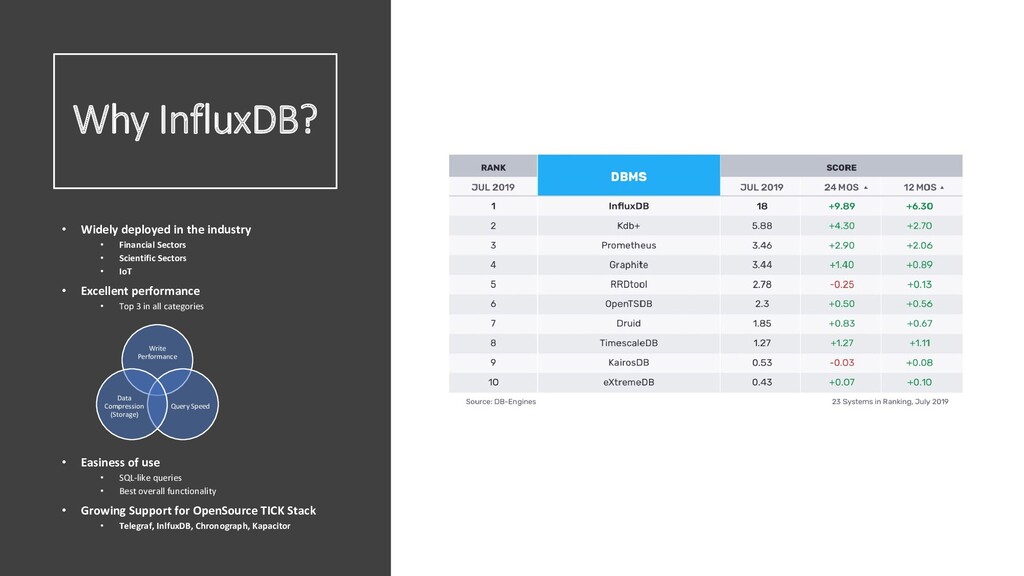
today’s publicly available database management systems specialize in time series data analysis. • 82% of these systems operate under an open source license. *source: https://db-engines.com/en/ranking_trend/time+series+dbms For Educational Purposes Only
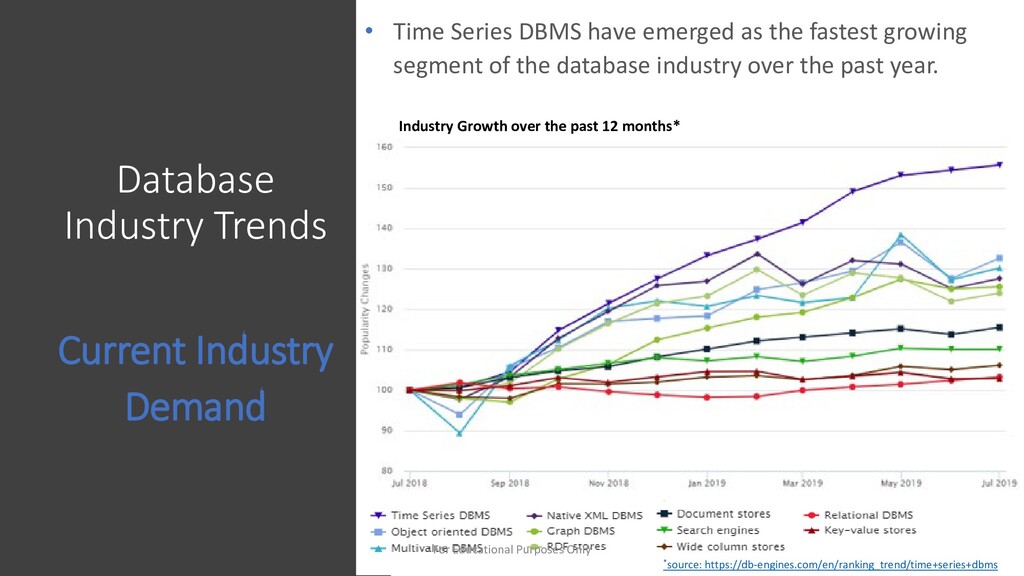
Series DBMS have emerged as the fastest growing segment of the database industry over the past year. Industry Growth over the past 12 months* For Educational Purposes Only
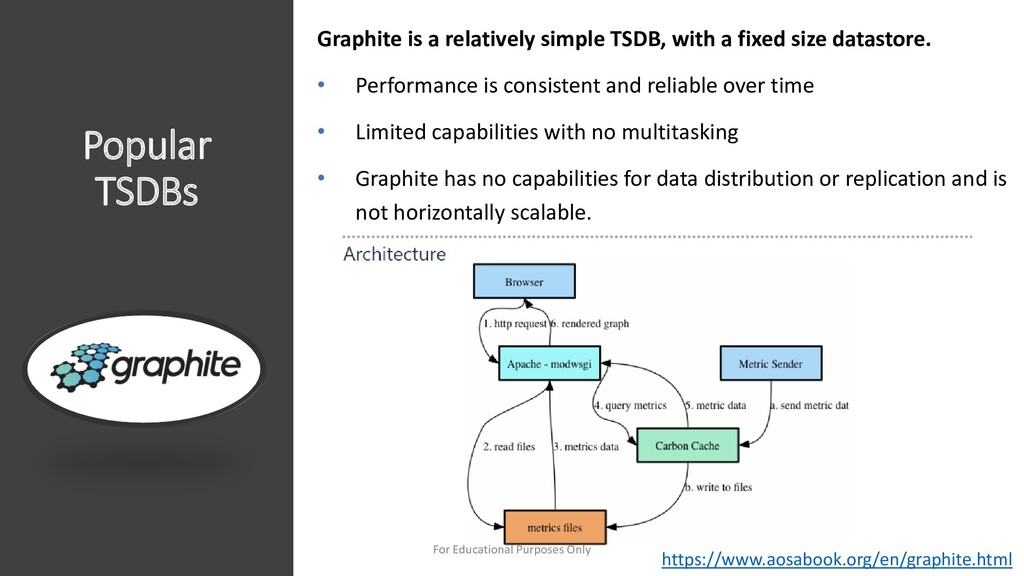
fixed size datastore. • Performance is consistent and reliable over time • Limited capabilities with no multitasking • Graphite has no capabilities for data distribution or replication and is not horizontally scalable. https://www.aosabook.org/en/graphite.html For Educational Purposes Only
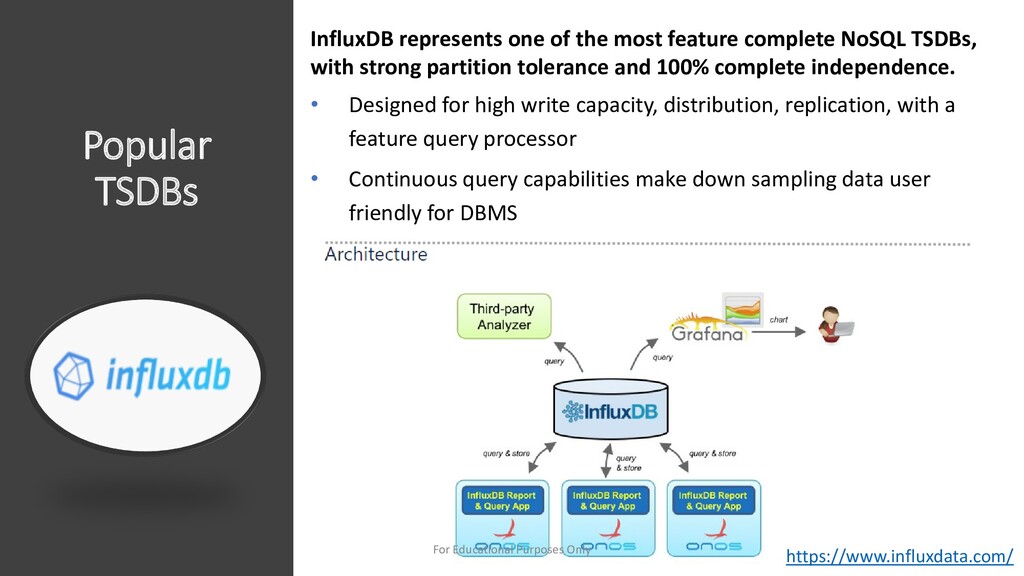
NoSQL TSDBs, with strong partition tolerance and 100% complete independence. • Designed for high write capacity, distribution, replication, with a feature query processor • Continuous query capabilities make down sampling data user friendly for DBMS https://www.influxdata.com/ For Educational Purposes Only
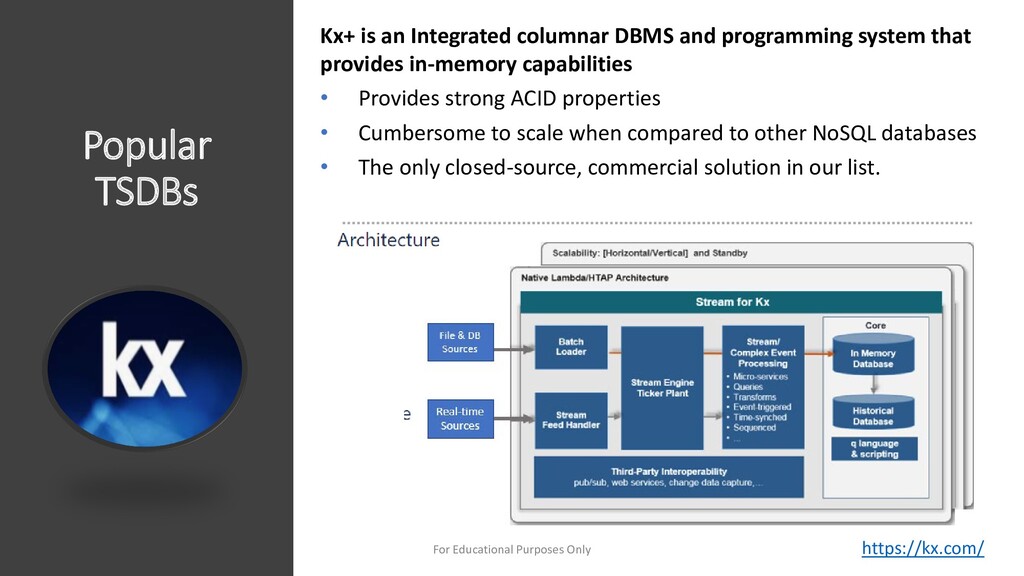
system that provides in-memory capabilities • Provides strong ACID properties • Cumbersome to scale when compared to other NoSQL databases • The only closed-source, commercial solution in our list. https://kx.com/ For Educational Purposes Only
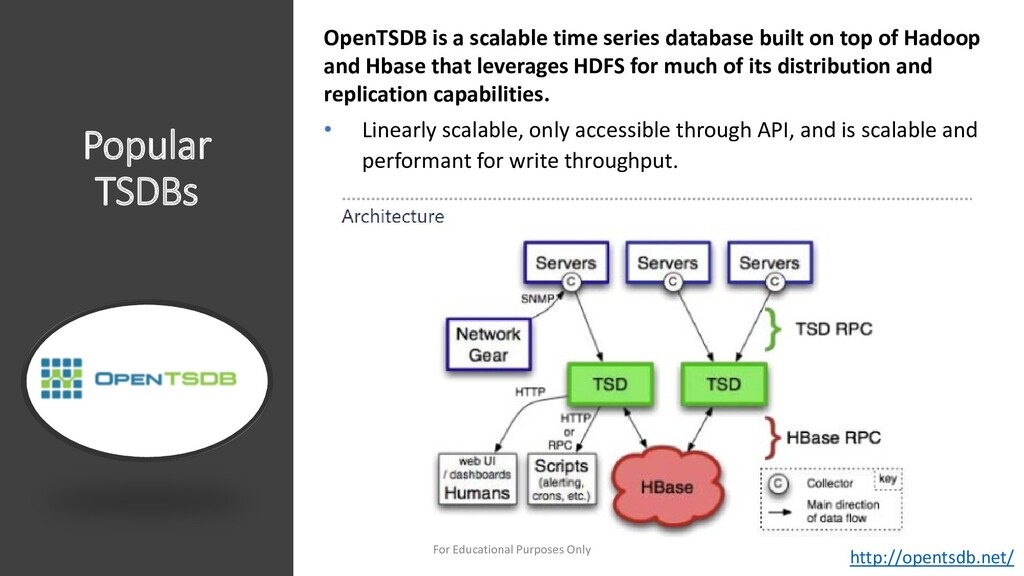
on top of Hadoop and Hbase that leverages HDFS for much of its distribution and replication capabilities. • Linearly scalable, only accessible through API, and is scalable and performant for write throughput. http://opentsdb.net/ For Educational Purposes Only
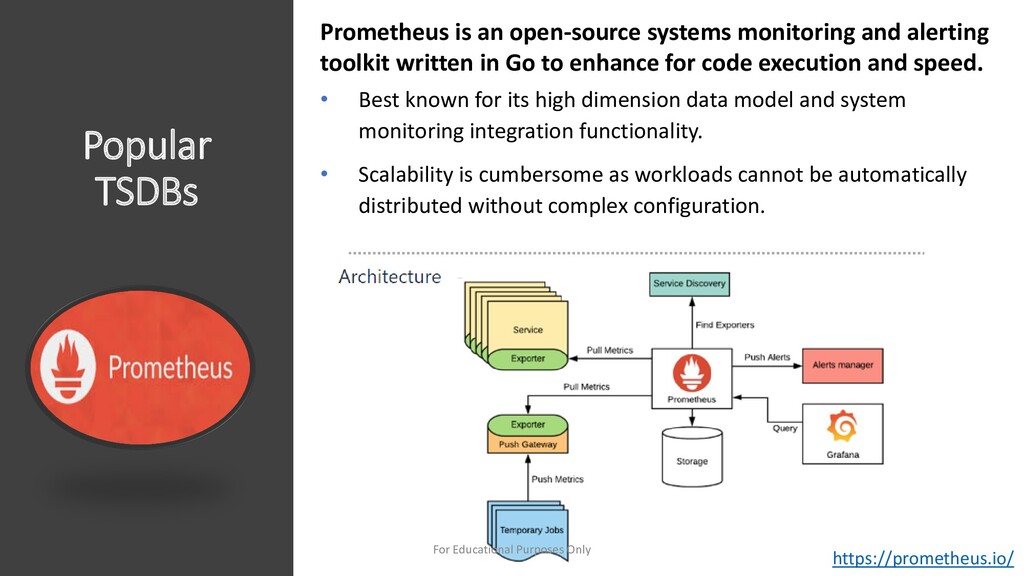
toolkit written in Go to enhance for code execution and speed. • Best known for its high dimension data model and system monitoring integration functionality. • Scalability is cumbersome as workloads cannot be automatically distributed without complex configuration. https://prometheus.io/ For Educational Purposes Only
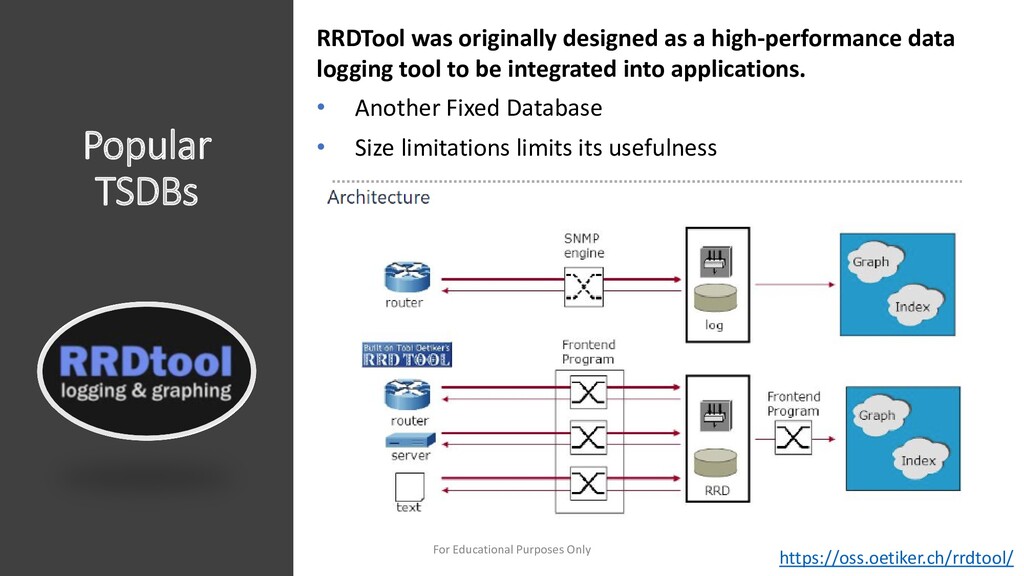
logging tool to be integrated into applications. • Another Fixed Database • Size limitations limits its usefulness https://oss.oetiker.ch/rrdtool/ For Educational Purposes Only
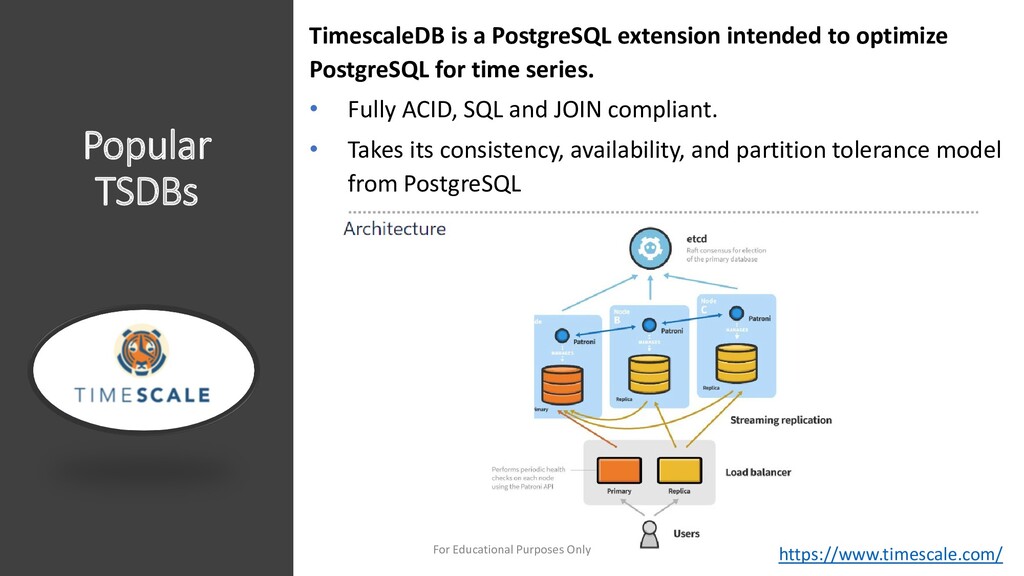
PostgreSQL for time series. • Fully ACID, SQL and JOIN compliant. • Takes its consistency, availability, and partition tolerance model from PostgreSQL https://www.timescale.com/ For Educational Purposes Only
PostgreSQL for time series. • Fully ACID, SQL and JOIN compliant. • Takes its consistency, availability, and partition tolerance model from PostgreSQL https://www.timescale.com/ For Educational Purposes Only
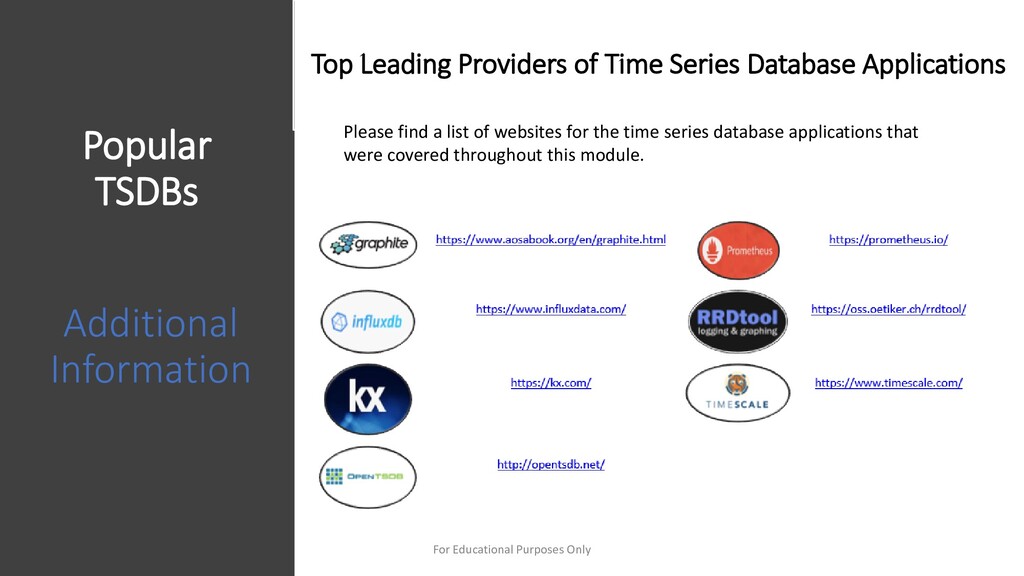
Additional Information Please find a list of websites for the time series database applications that were covered throughout this module. https://www.timescale.com/ https://prometheus.io/ https://kx.com/ https://www.influxdata.com/ For Educational Purposes Only
Sectors • Scientific Sectors • IoT • Excellent performance • Top 3 in all categories • Easiness of use • SQL-like queries • Best overall functionality • Growing Support for OpenSource TICK Stack • Telegraf, InlfuxDB, Chronograph, Kapacitor Write Performance Query Speed Data Compression (Storage)
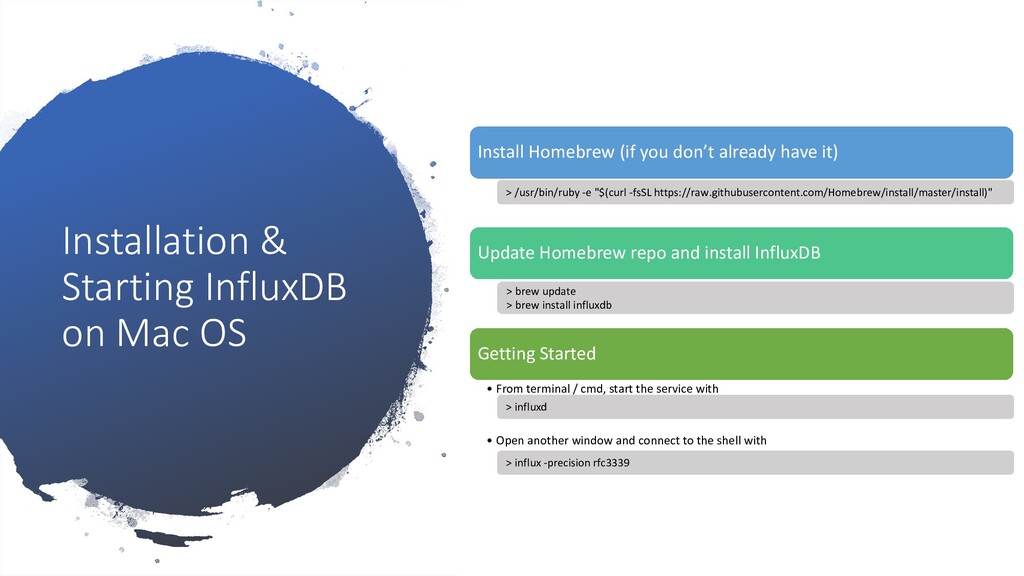
you don’t already have it) Update Homebrew repo and install InfluxDB Getting Started • From terminal / cmd, start the service with • Open another window and connect to the shell with > /usr/bin/ruby -e "$(curl -fsSL https://raw.githubusercontent.com/Homebrew/install/master/install)" > brew update > brew install influxdb > influxd > influx -precision rfc3339
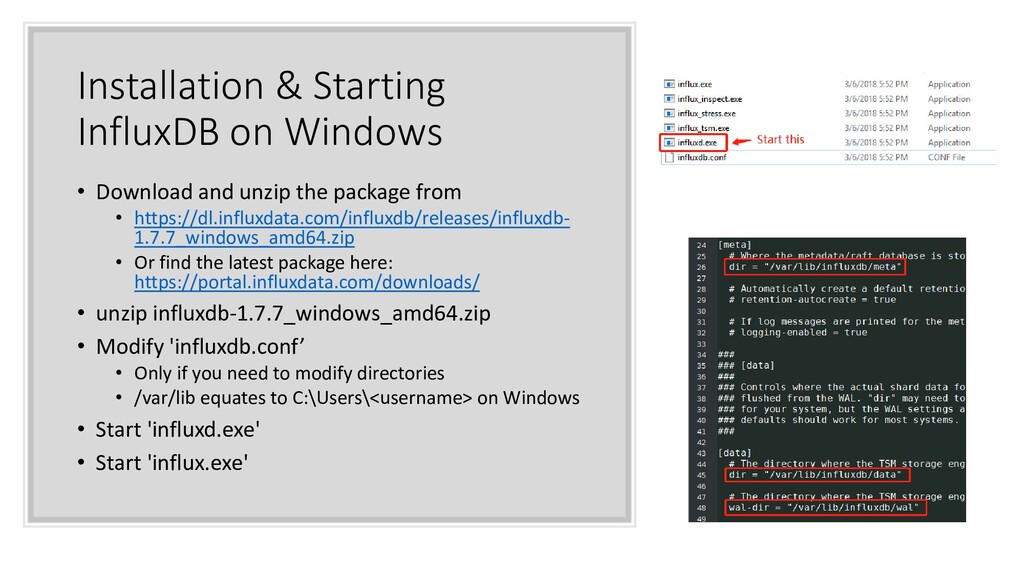
the package from • https://dl.influxdata.com/influxdb/releases/influxdb- 1.7.7_windows_amd64.zip • Or find the latest package here: https://portal.influxdata.com/downloads/ • unzip influxdb-1.7.7_windows_amd64.zip • Modify 'influxdb.conf’ • Only if you need to modify directories • /var/lib equates to C:\Users\<username> on Windows • Start 'influxd.exe' • Start 'influx.exe'
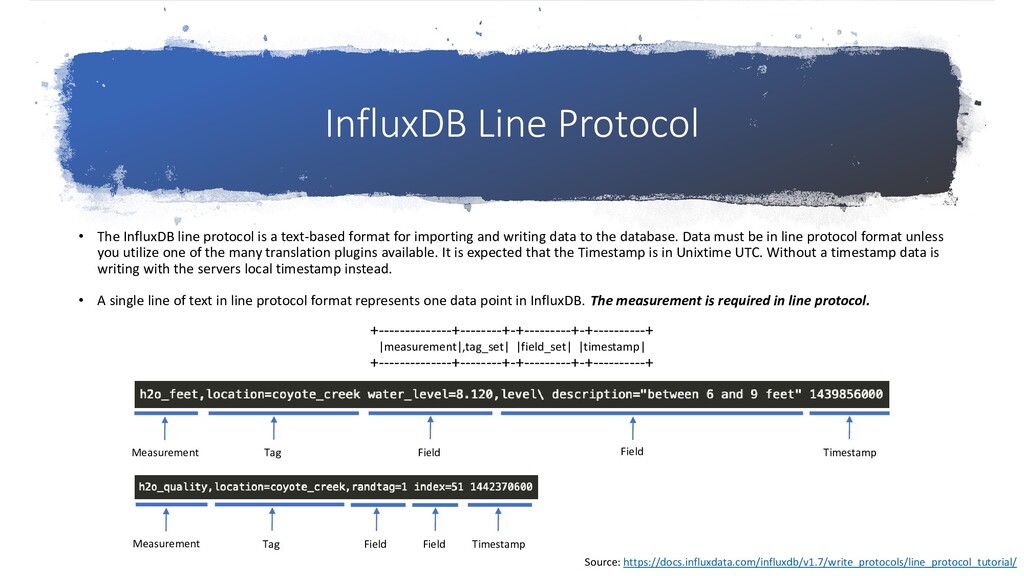
text-based format for importing and writing data to the database. Data must be in line protocol format unless you utilize one of the many translation plugins available. It is expected that the Timestamp is in Unixtime UTC. Without a timestamp data is writing with the servers local timestamp instead. • A single line of text in line protocol format represents one data point in InfluxDB. The measurement is required in line protocol. +--------------+--------+-+---------+-+----------+ |measurement|,tag_set| |field_set| |timestamp| +--------------+--------+-+---------+-+----------+ Measurement Tag Field Field Timestamp Measurement Tag Field Field Timestamp Source: https://docs.influxdata.com/influxdb/v1.7/write_protocols/line_protocol_tutorial/
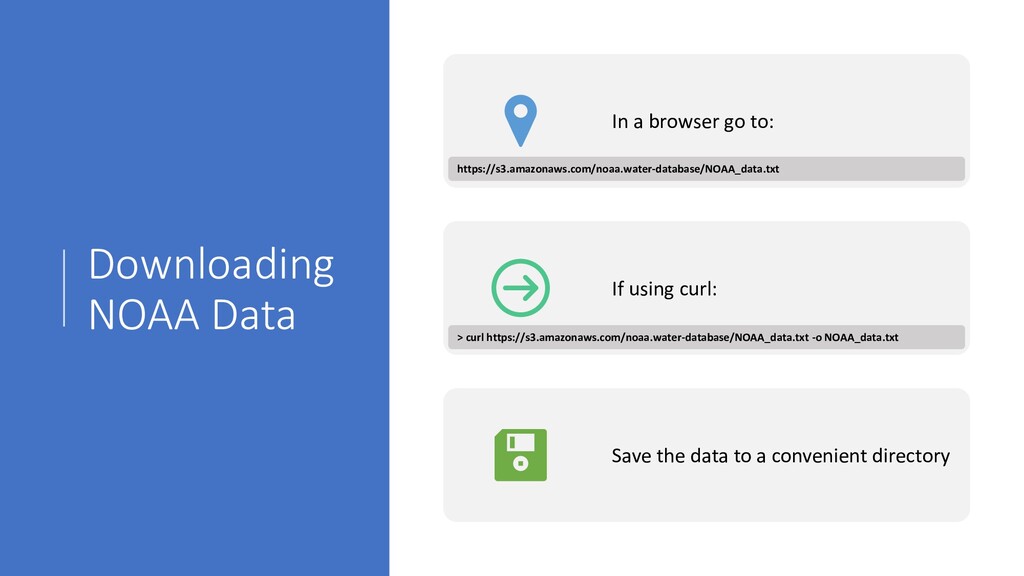
will utilize water and weather data from the National Oceanic and Atmospheric Administration (NOAA) We will perform the following steps: Download the data – this data is preformatted to line protocol Connect to the Influx database engine Create a new database called NOAA_water_database Import data into Influx Run test queries
curl: Save the data to a convenient directory > curl https://s3.amazonaws.com/noaa.water-database/NOAA_data.txt -o NOAA_data.txt https://s3.amazonaws.com/noaa.water-database/NOAA_data.txt
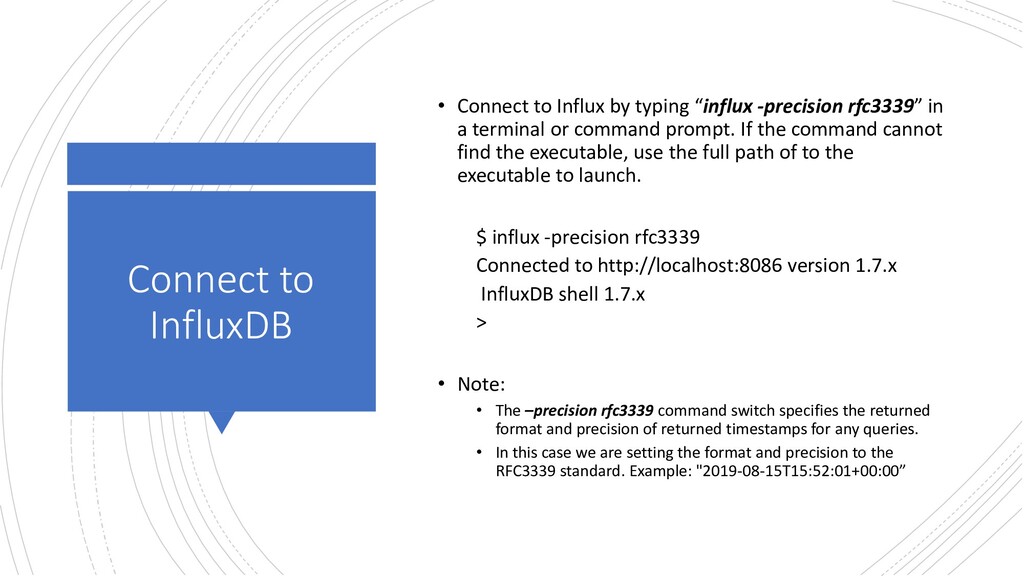
-precision rfc3339” in a terminal or command prompt. If the command cannot find the executable, use the full path of to the executable to launch. $ influx -precision rfc3339 Connected to http://localhost:8086 version 1.7.x InfluxDB shell 1.7.x > • Note: • The –precision rfc3339 command switch specifies the returned format and precision of returned timestamps for any queries. • In this case we are setting the format and precision to the RFC3339 standard. Example: "2019-08-15T15:52:01+00:00”
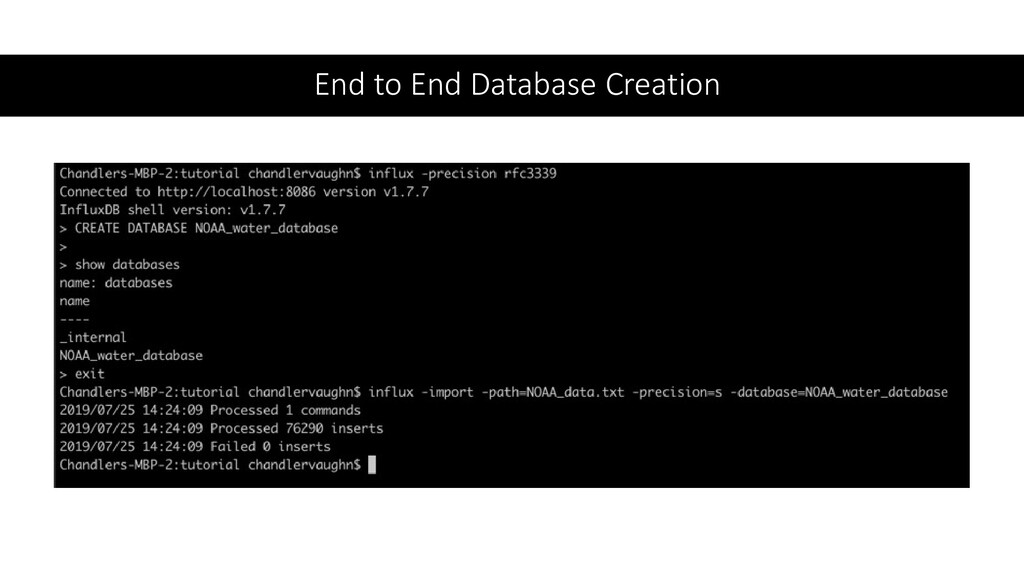
that we have successful connected to Influx, we can test our connection and create a new database • In the Influx terminal you connected to type: > CREATE DATABASE NOAA_water_database • Once completed exit by typing: > exit
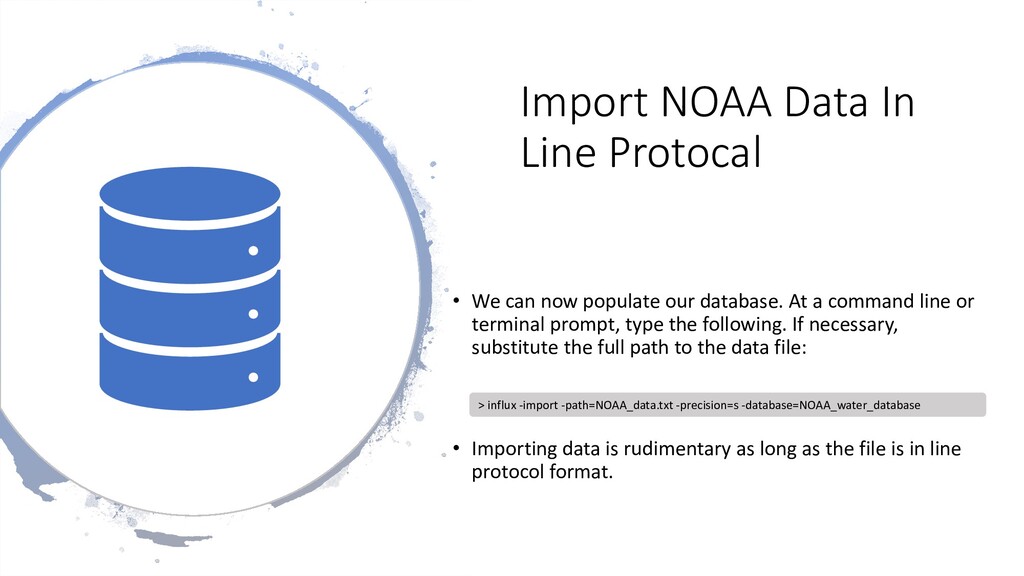
populate our database. At a command line or terminal prompt, type the following. If necessary, substitute the full path to the data file: • Importing data is rudimentary as long as the file is in line protocol format. > influx -import -path=NOAA_data.txt -precision=s -database=NOAA_water_database
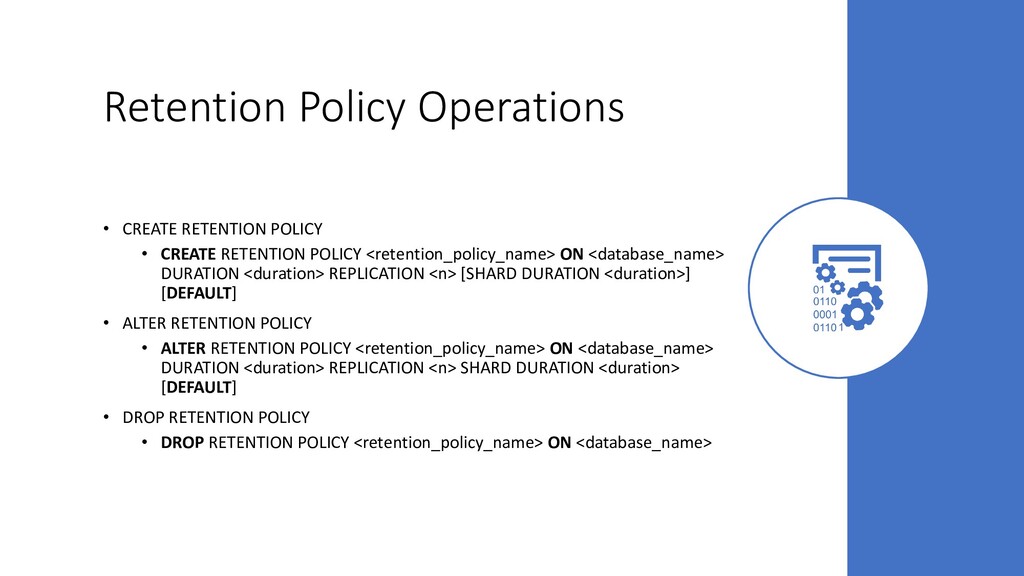
SHOW MEASUREMENTS SHOW RETENTION POLICIES [ON [DATABASE]] SELECT field-key(s),tag-key(s) FROM measurement SELECT function(field-key) FROM measurement SELECT [...] WHERE [tag-conditional | field-conditional | time-conditional] SELECT [...] GROUP BY [tag-key(s) | time-interval] CREATE [DATABASE | RETENTION POLICY] DROP [DATABASE | RETENTION POLICY] DELETE DROP MEASUREMENT measurement DROP SERIES FROM measurement WHERE [tag-conditional | field-conditional | time-conditional] Schema Navigation Influx Query Language (SQL-like) Data Management
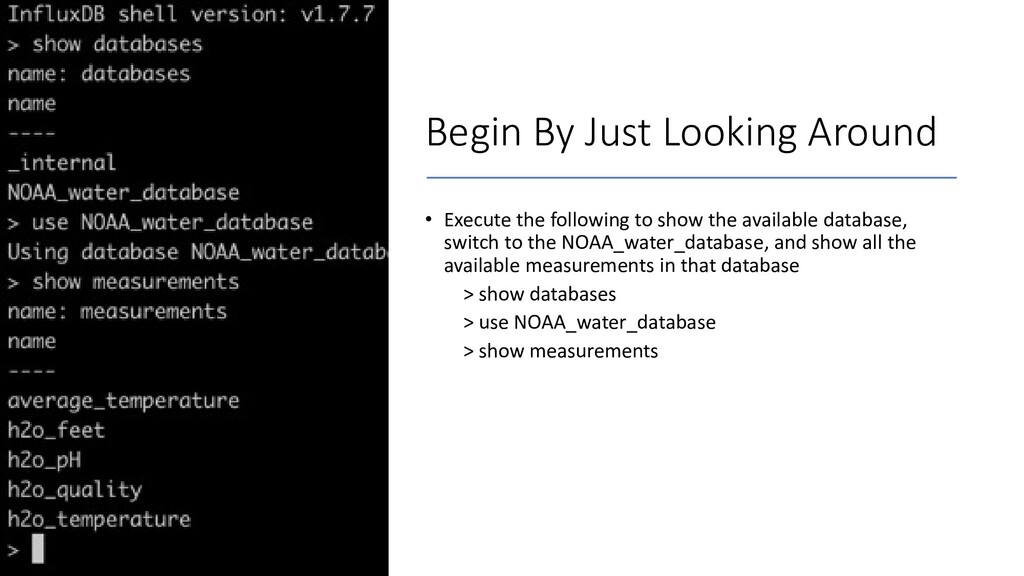
show the available database, switch to the NOAA_water_database, and show all the available measurements in that database > show databases > use NOAA_water_database > show measurements
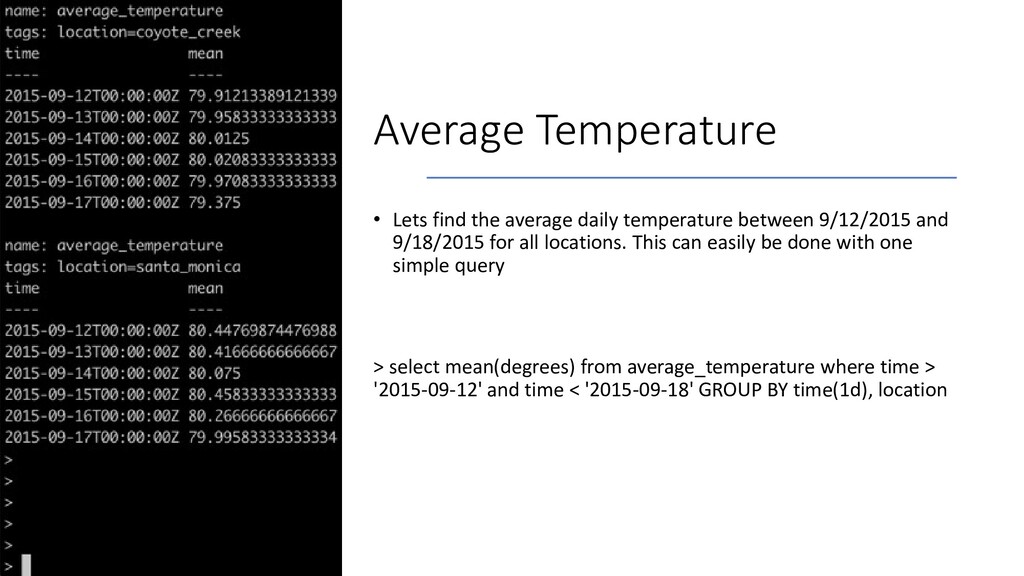
9/12/2015 and 9/18/2015 for all locations. This can easily be done with one simple query > select mean(degrees) from average_temperature where time > '2015-09-12' and time < '2015-09-18' GROUP BY time(1d), location
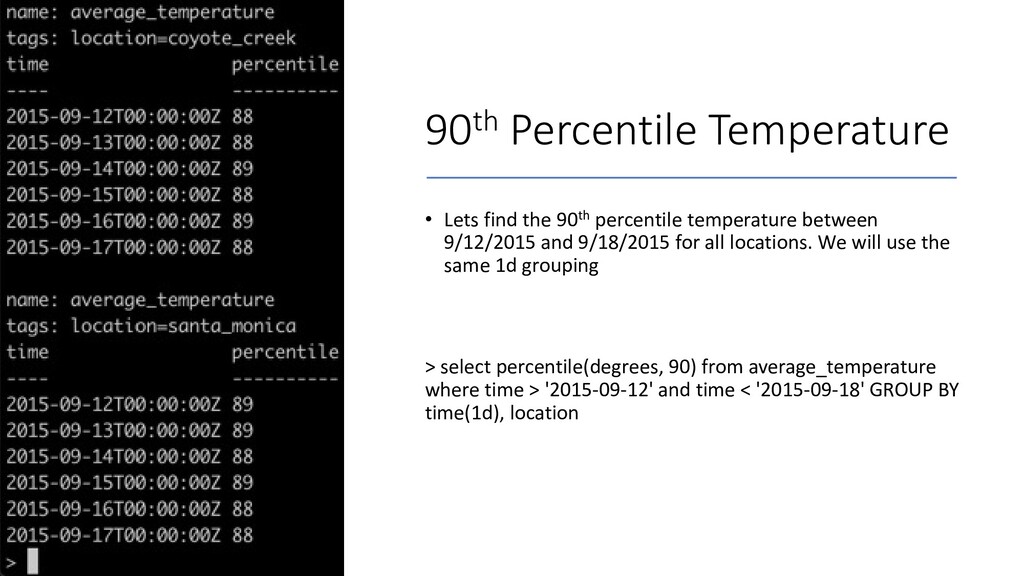
between 9/12/2015 and 9/18/2015 for all locations. We will use the same 1d grouping > select percentile(degrees, 90) from average_temperature where time > '2015-09-12' and time < '2015-09-18' GROUP BY time(1d), location
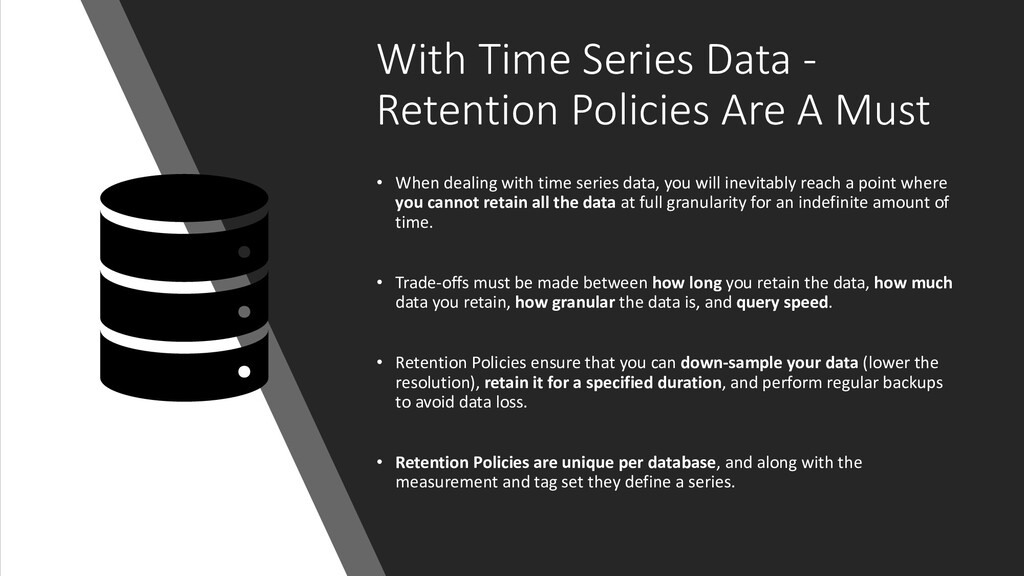
• When dealing with time series data, you will inevitably reach a point where you cannot retain all the data at full granularity for an indefinite amount of time. • Trade-offs must be made between how long you retain the data, how much data you retain, how granular the data is, and query speed. • Retention Policies ensure that you can down-sample your data (lower the resolution), retain it for a specified duration, and perform regular backups to avoid data loss. • Retention Policies are unique per database, and along with the measurement and tag set they define a series.
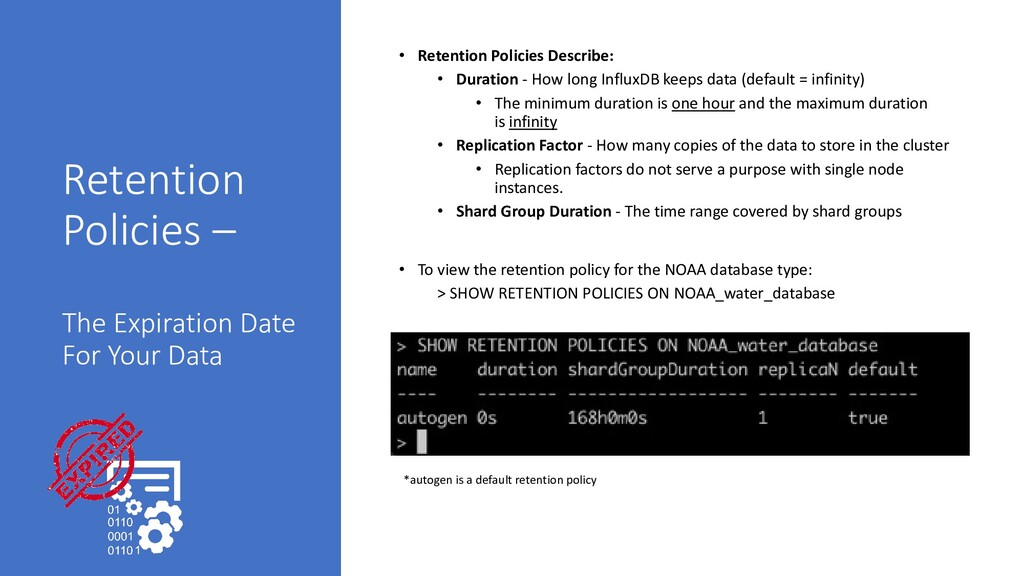
Retention Policies Describe: • Duration - How long InfluxDB keeps data (default = infinity) • The minimum duration is one hour and the maximum duration is infinity • Replication Factor - How many copies of the data to store in the cluster • Replication factors do not serve a purpose with single node instances. • Shard Group Duration - The time range covered by shard groups • To view the retention policy for the NOAA database type: > SHOW RETENTION POLICIES ON NOAA_water_database *autogen is a default retention policy
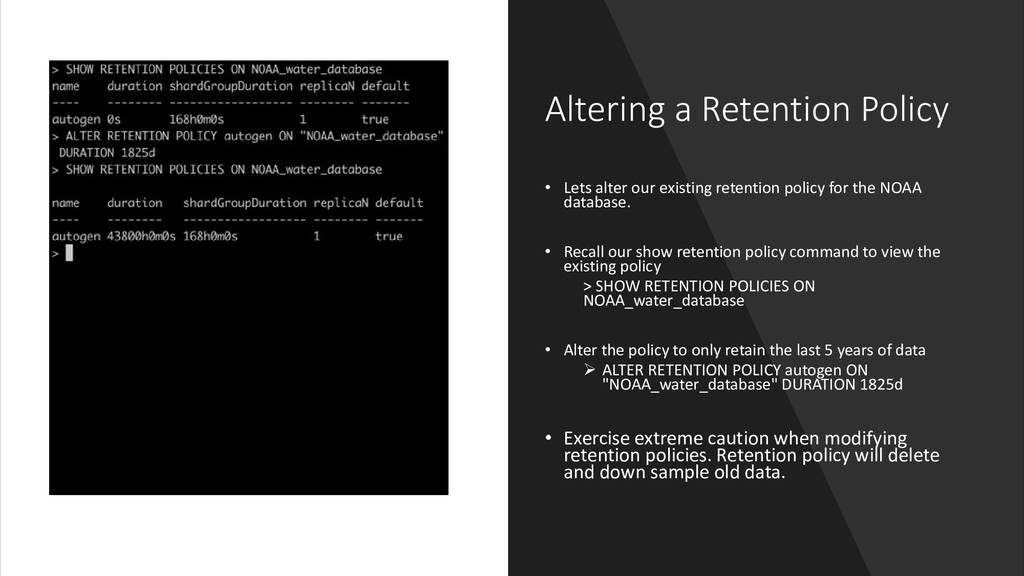
policy for the NOAA database. • Recall our show retention policy command to view the existing policy > SHOW RETENTION POLICIES ON NOAA_water_database • Alter the policy to only retain the last 5 years of data ALTER RETENTION POLICY autogen ON "NOAA_water_database" DURATION 1825d • Exercise extreme caution when modifying retention policies. Retention policy will delete and down sample old data.
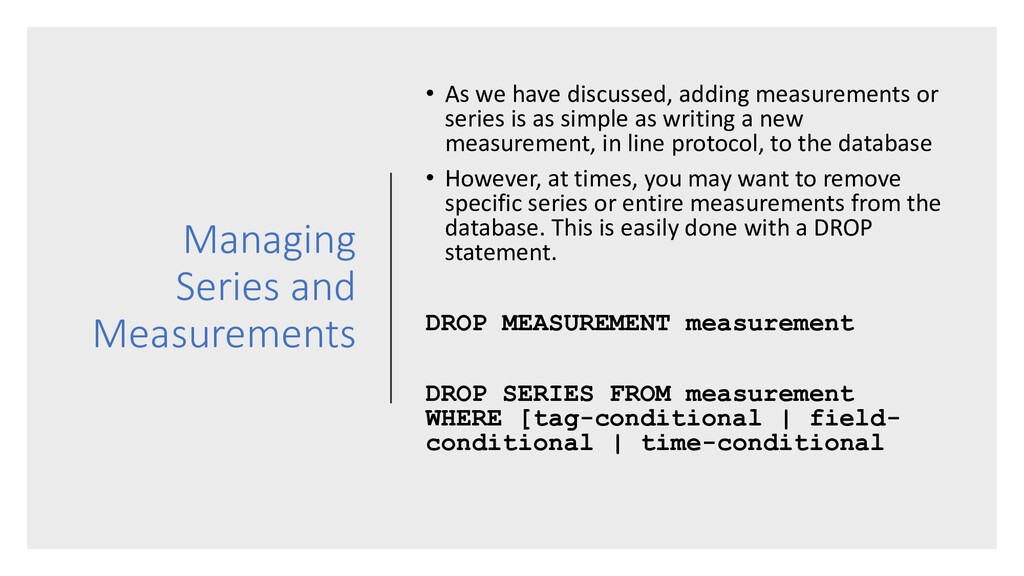
measurements or series is as simple as writing a new measurement, in line protocol, to the database • However, at times, you may want to remove specific series or entire measurements from the database. This is easily done with a DROP statement. DROP MEASUREMENT measurement DROP SERIES FROM measurement WHERE [tag-conditional | field- conditional | time-conditional
location series from average_temperature measurement • Lets also drop the entire h2o_temperature measurement > drop series from "average_temperature" where "location" = 'coyote_creek' > drop measurement "h2o_temperature"
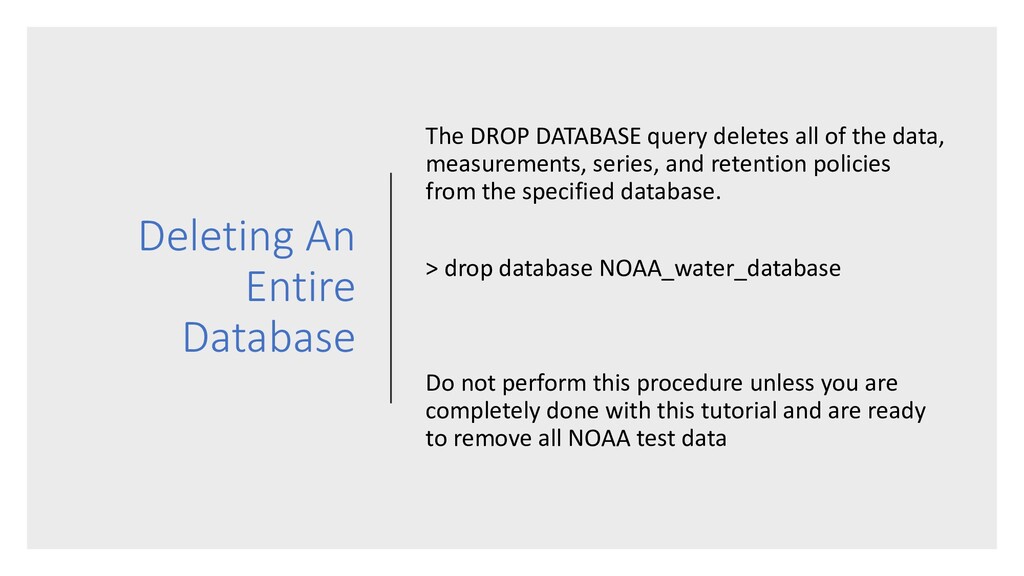
of the data, measurements, series, and retention policies from the specified database. > drop database NOAA_water_database Do not perform this procedure unless you are completely done with this tutorial and are ready to remove all NOAA test data
timeseries in the InfluxDB Time Series Database • Installation • Terminology for Time Series • Data Import Procedure • Data Manipulation • Data Management • Database Management
![InfluxDB Query Language Basics USE [DATABASE] SHOW DATABASES SHOW SERIES](https://files.speakerdeck.com/presentations/bfb6a815092b46b1a33871947ab8bf63/slide_64.jpg)