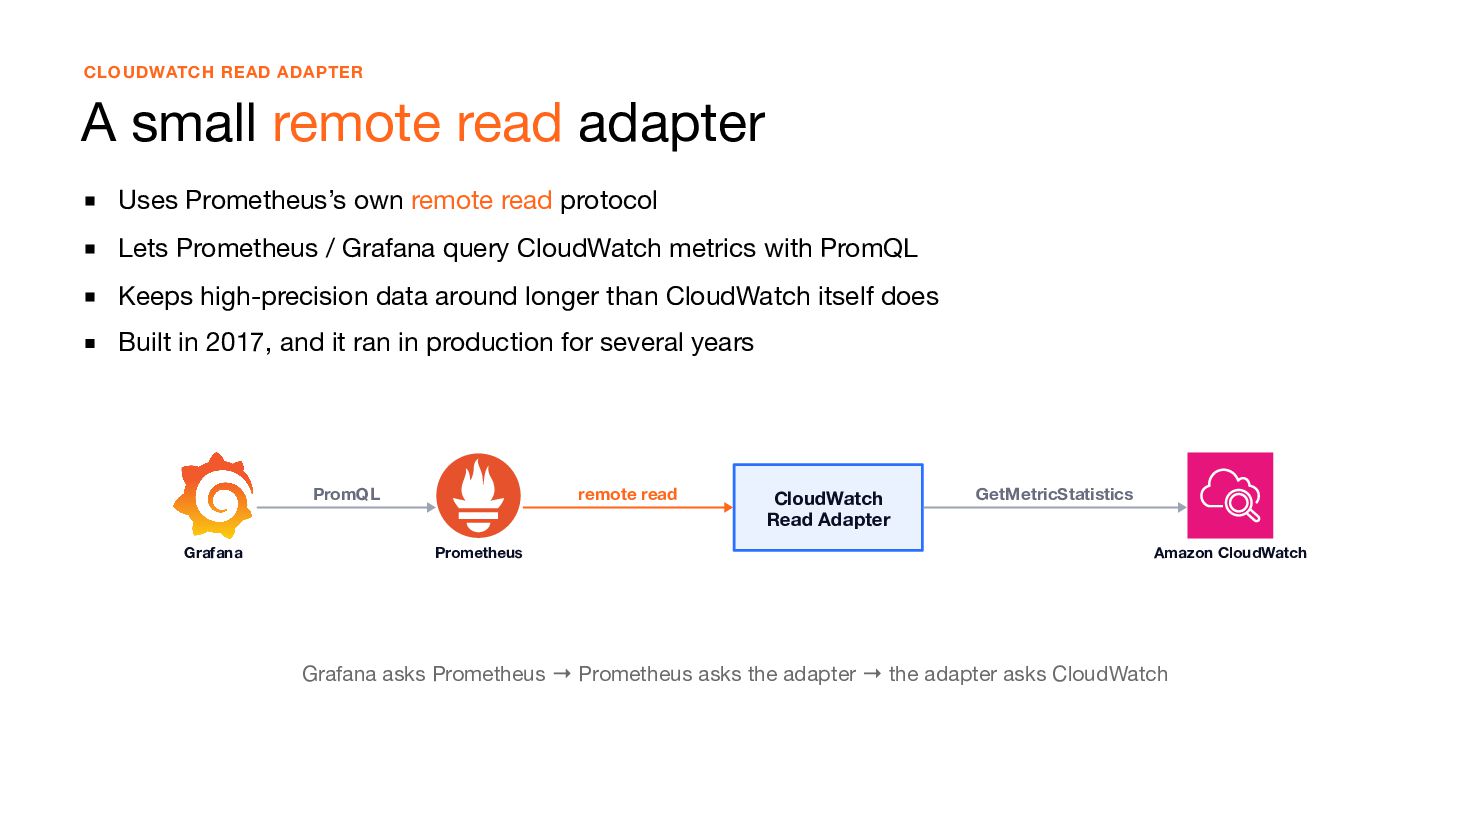
own remote read protocol Lets Prometheus / Grafana query CloudWatch metrics with PromQL Keeps high-precision data around longer than CloudWatch itself does Built in 2017, and it ran in production for several years PromQL Grafana remote read Prometheus CloudWatch Read Adapter GetMetricStatistics Amazon CloudWatch Grafana asks Prometheus → Prometheus asks the adapter → the adapter asks CloudWatch
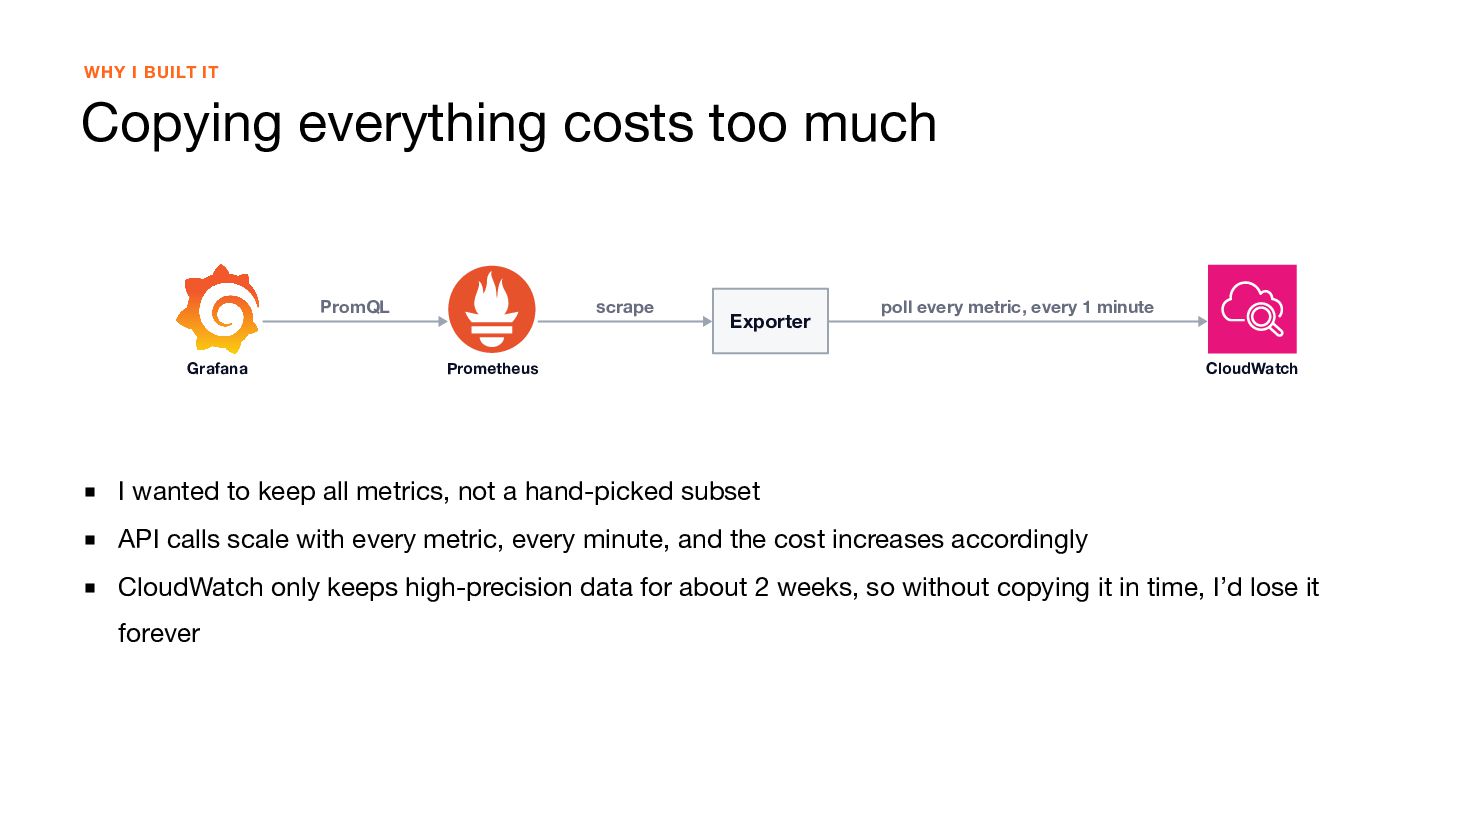
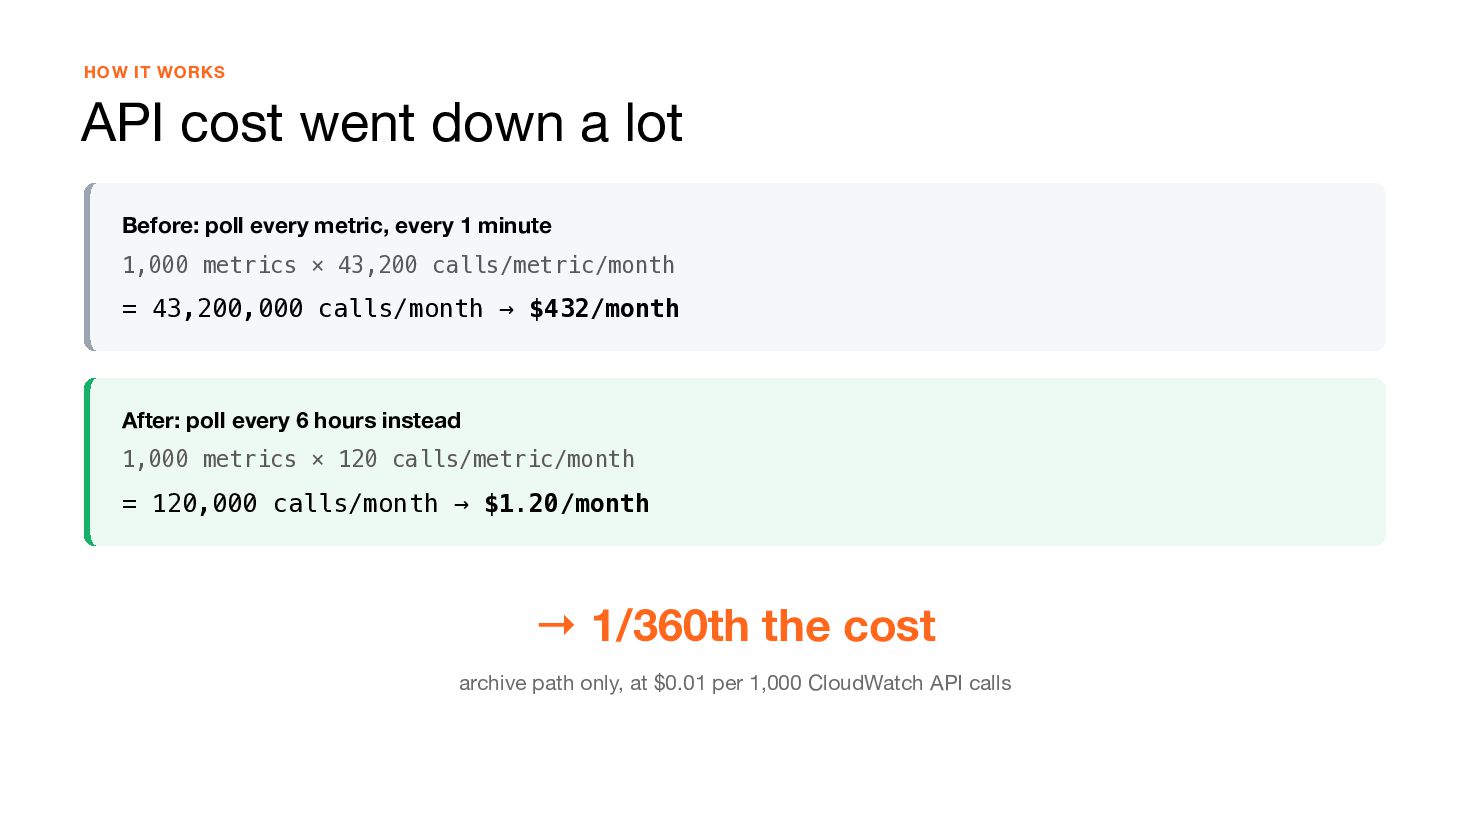
Grafana scrape Exporter poll every metric, every 1 minute Prometheus CloudWatch I wanted to keep all metrics, not a hand-picked subset API calls scale with every metric, every minute, and the cost increases accordingly CloudWatch only keeps high-precision data for about 2 weeks, so without copying it in time, I’d lose it forever
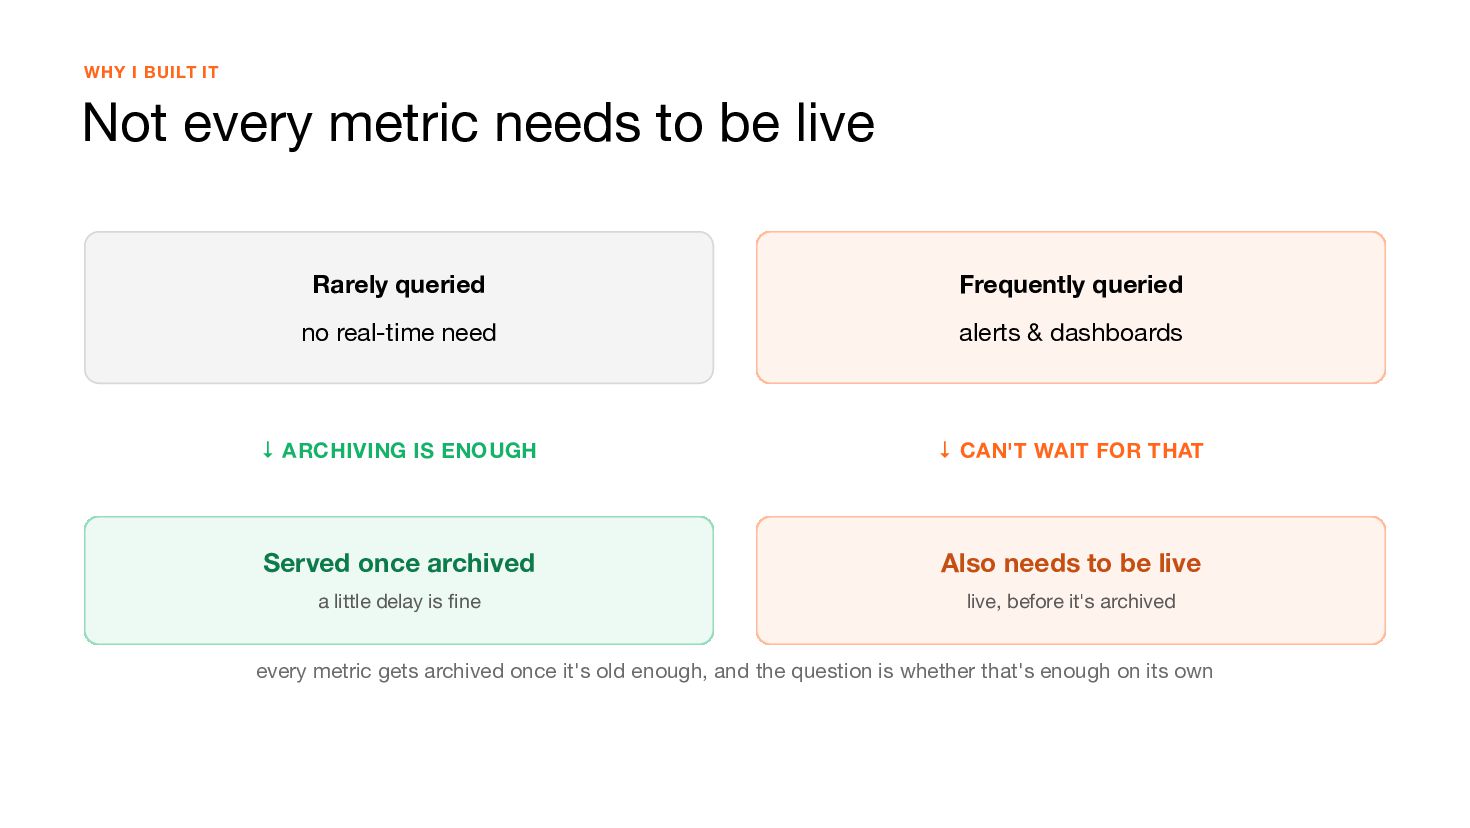
live Rarely queried Frequently queried no real-time need alerts & dashboards ↓ ARCHIVING IS ENOUGH ↓ CAN'T WAIT FOR THAT Served once archived Also needs to be live a little delay is fine live, before it's archived every metric gets archived once it's old enough, and the question is whether that's enough on its own
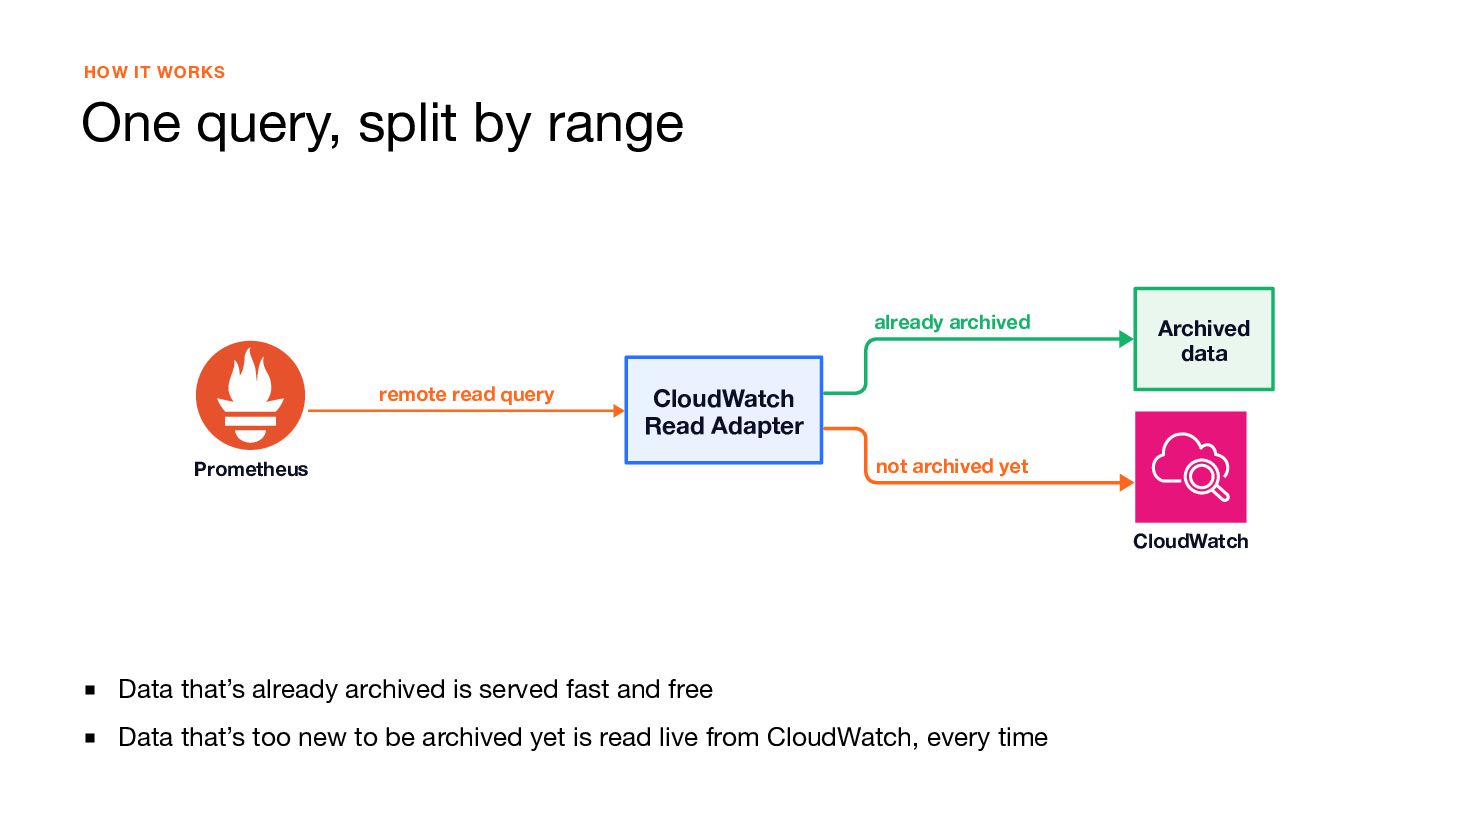
remote read query Archived data CloudWatch Read Adapter Prometheus not archived yet CloudWatch Data that’s already archived is served fast and free Data that’s too new to be archived yet is read live from CloudWatch, every time
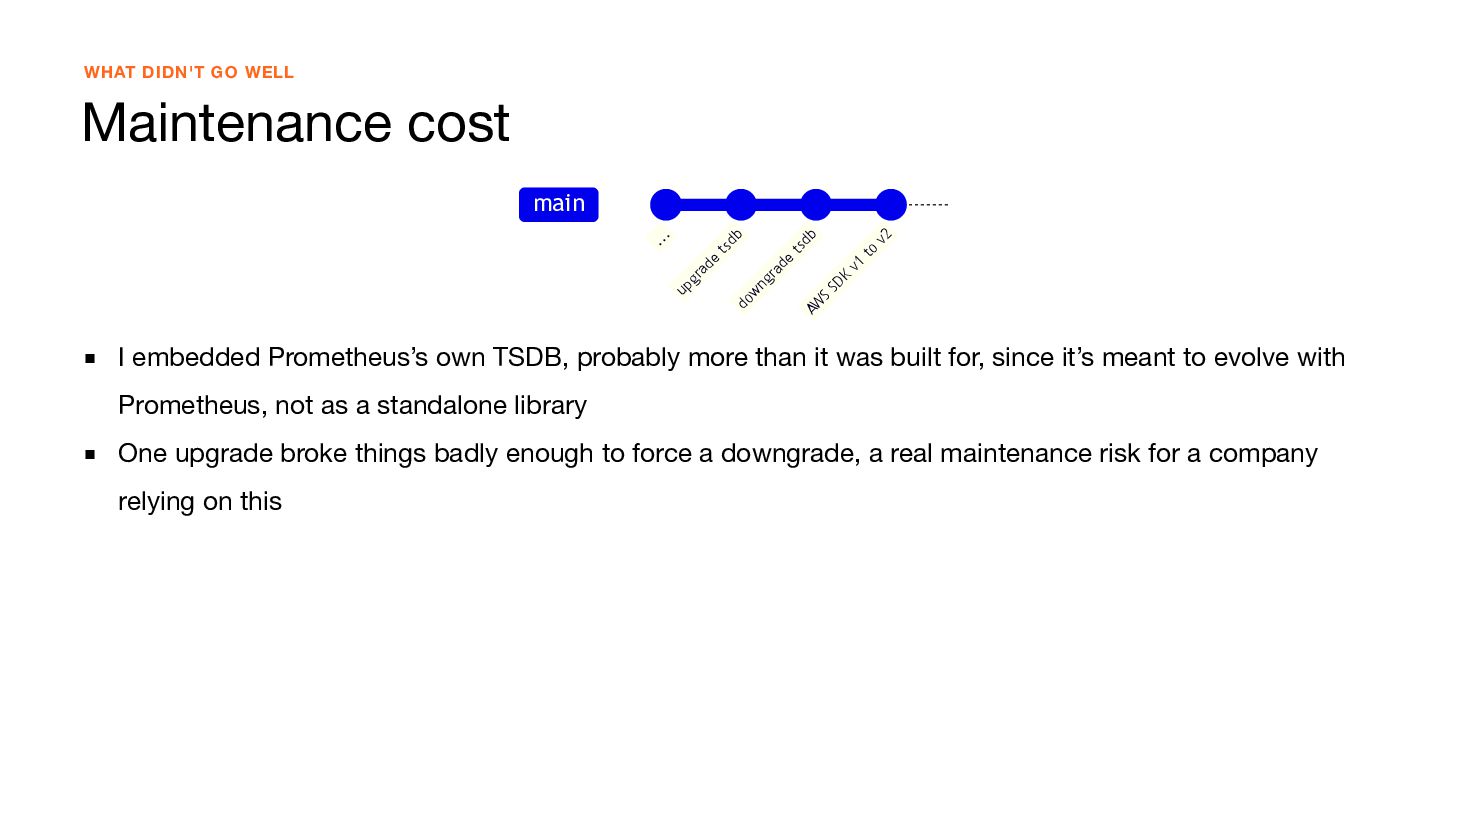
to ts db AW S ts db do w ng ra de up gr ad e .. . main I embedded Prometheus’s own TSDB, probably more than it was built for, since it’s meant to evolve with Prometheus, not as a standalone library One upgrade broke things badly enough to force a downgrade, a real maintenance risk for a company relying on this
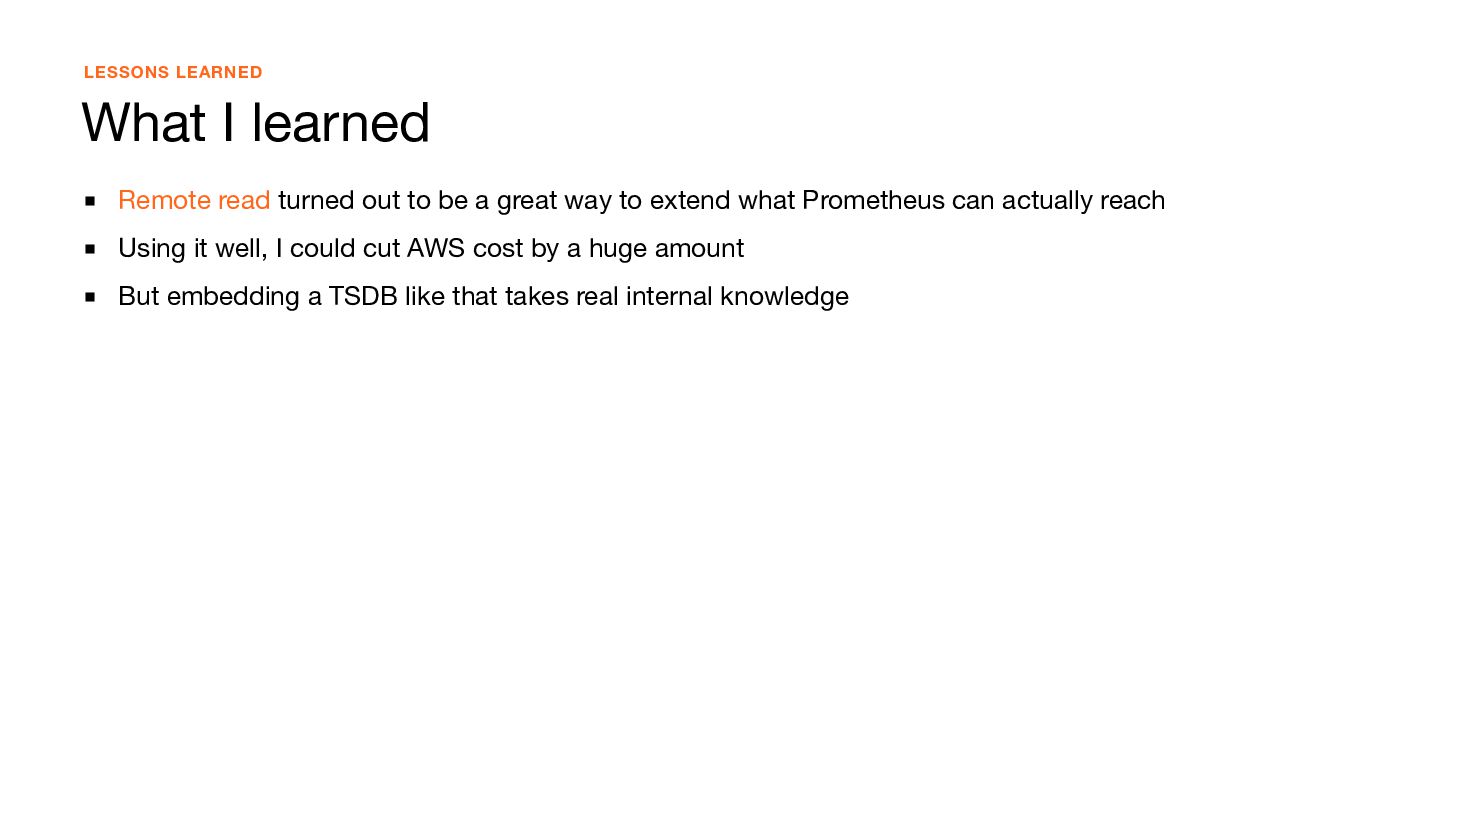
be a great way to extend what Prometheus can actually reach Using it well, I could cut AWS cost by a huge amount But embedding a TSDB like that takes real internal knowledge


 mtanda
 jlugia
 portentint
 techseoconnect
 addyosmani
 raygrieselhuber
 katiecoart
 geshan
 szymonslowik
 tessaabrams
 kimpetersen
 jonoalderson
 panda_program