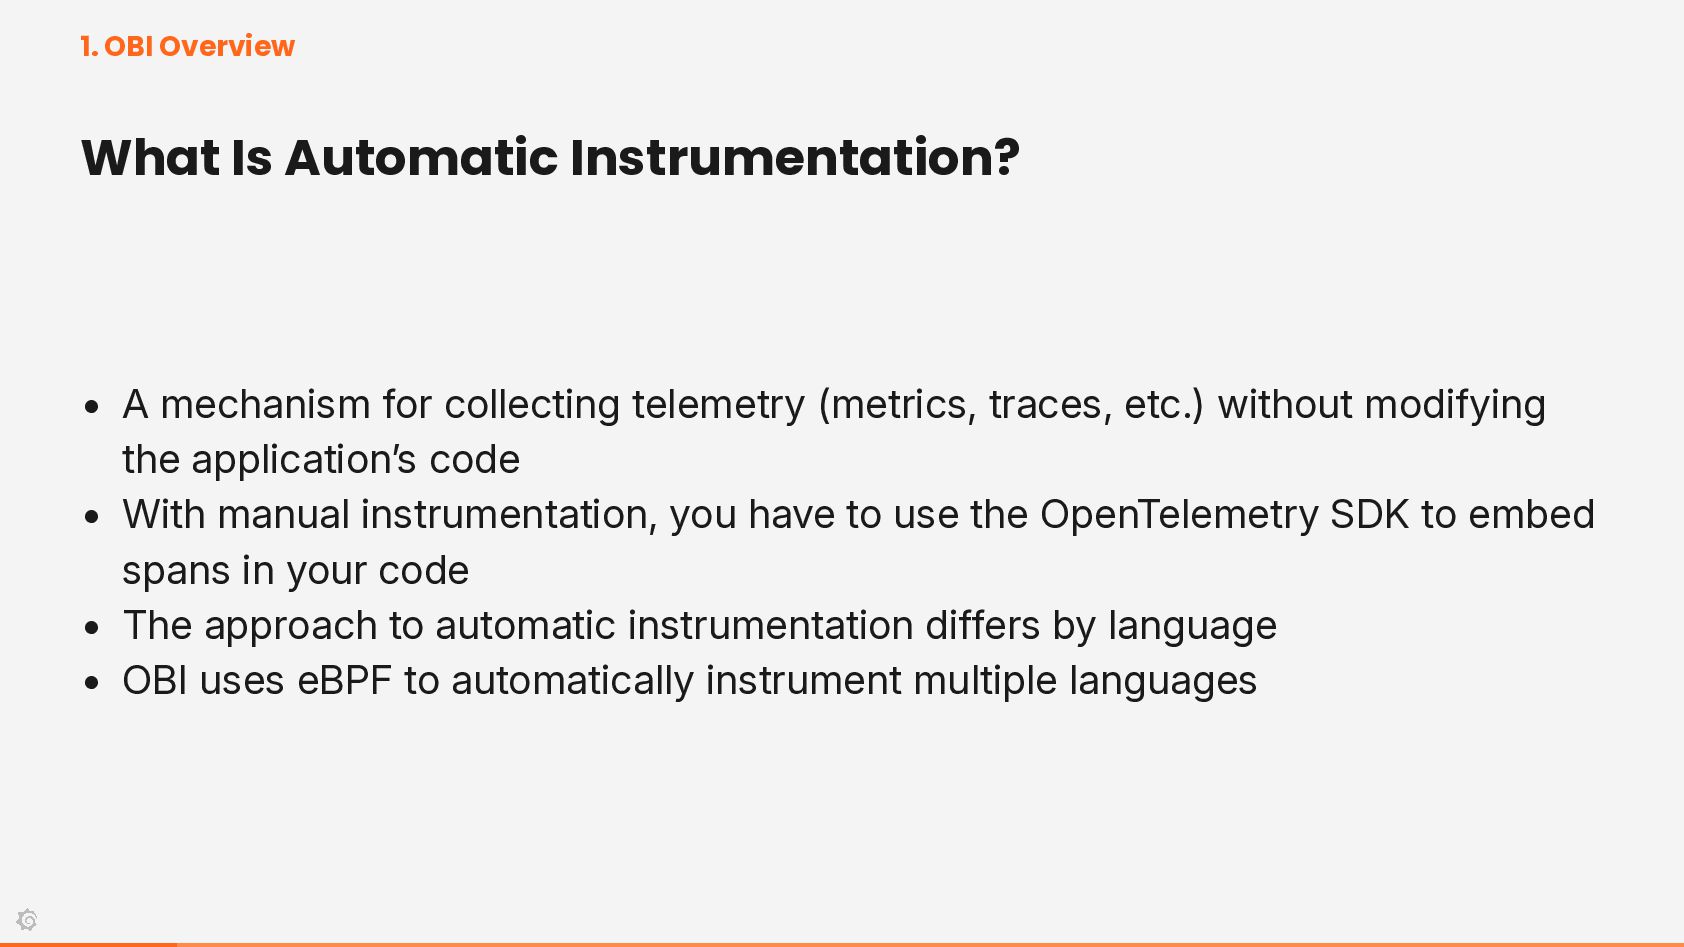
for collecting telemetry (metrics, traces, etc.) without modifying the application’s code • With manual instrumentation, you have to use the OpenTelemetry SDK to embed spans in your code • The approach to automatic instrumentation differs by language • OBI uses eBPF to automatically instrument multiple languages
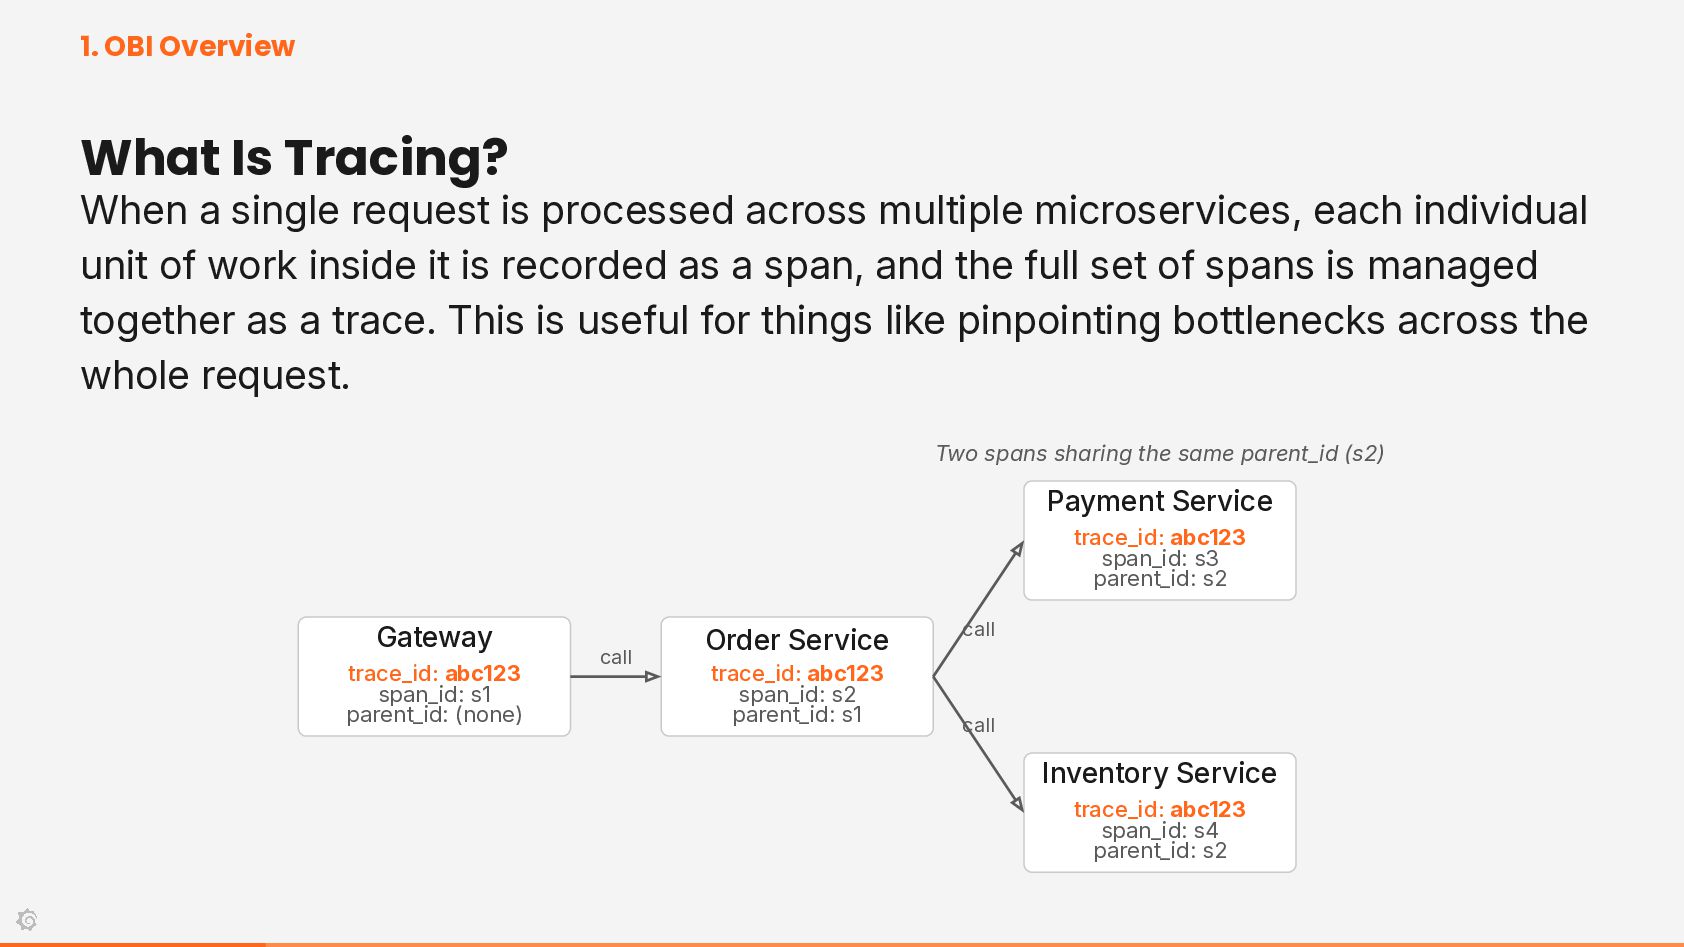
is processed across multiple microservices, each individual unit of work inside it is recorded as a span, and the full set of spans is managed together as a trace. This is useful for things like pinpointing bottlenecks across the whole request. Two spans sharing the same parent_id (s2) Payment Service trace_id: abc123 span_id: s3 parent_id: s2 Gateway trace_id: abc123 span_id: s1 parent_id: (none) call Order Service trace_id: abc123 span_id: s2 parent_id: s1 call call Inventory Service trace_id: abc123 span_id: s4 parent_id: s2
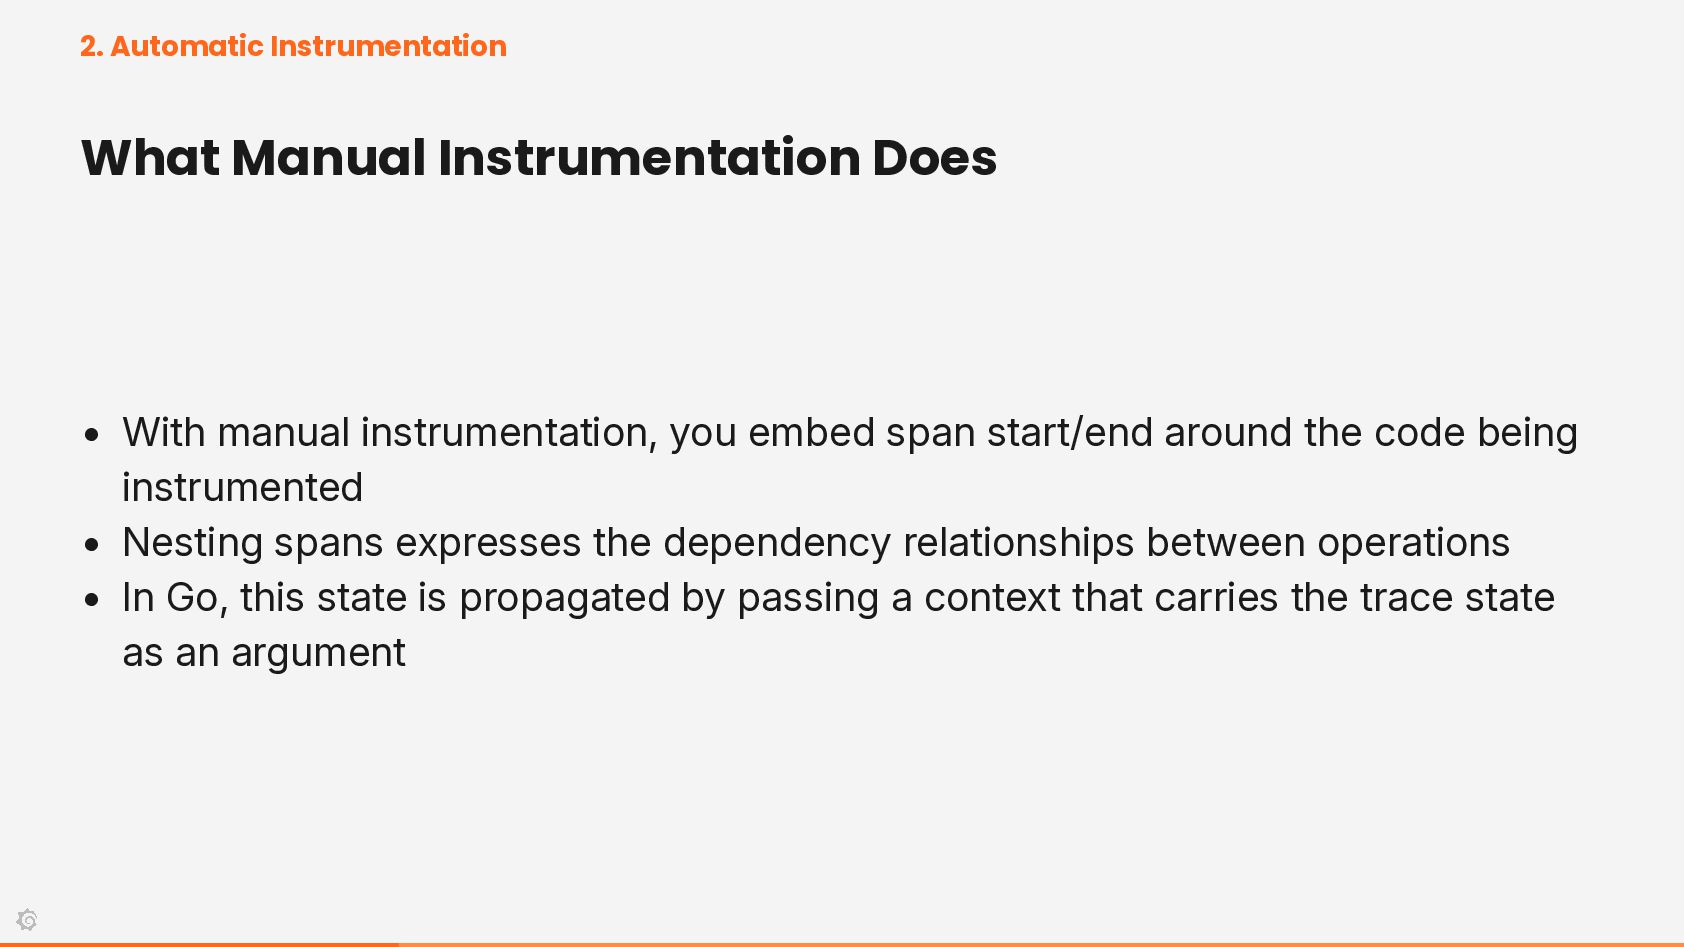
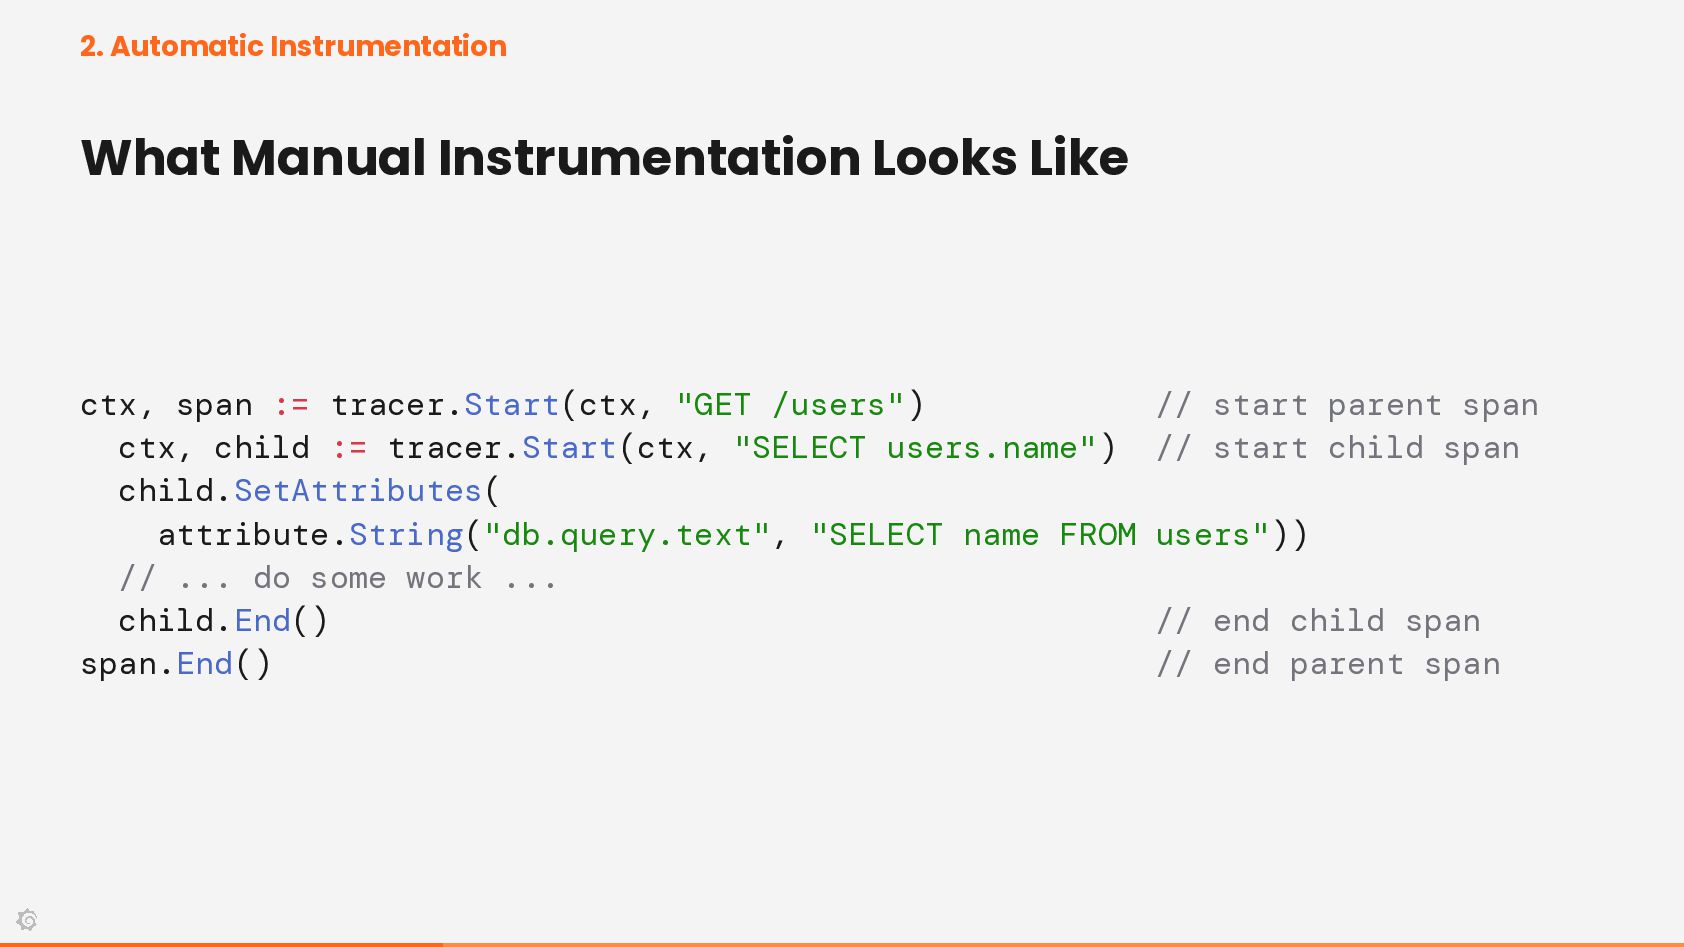
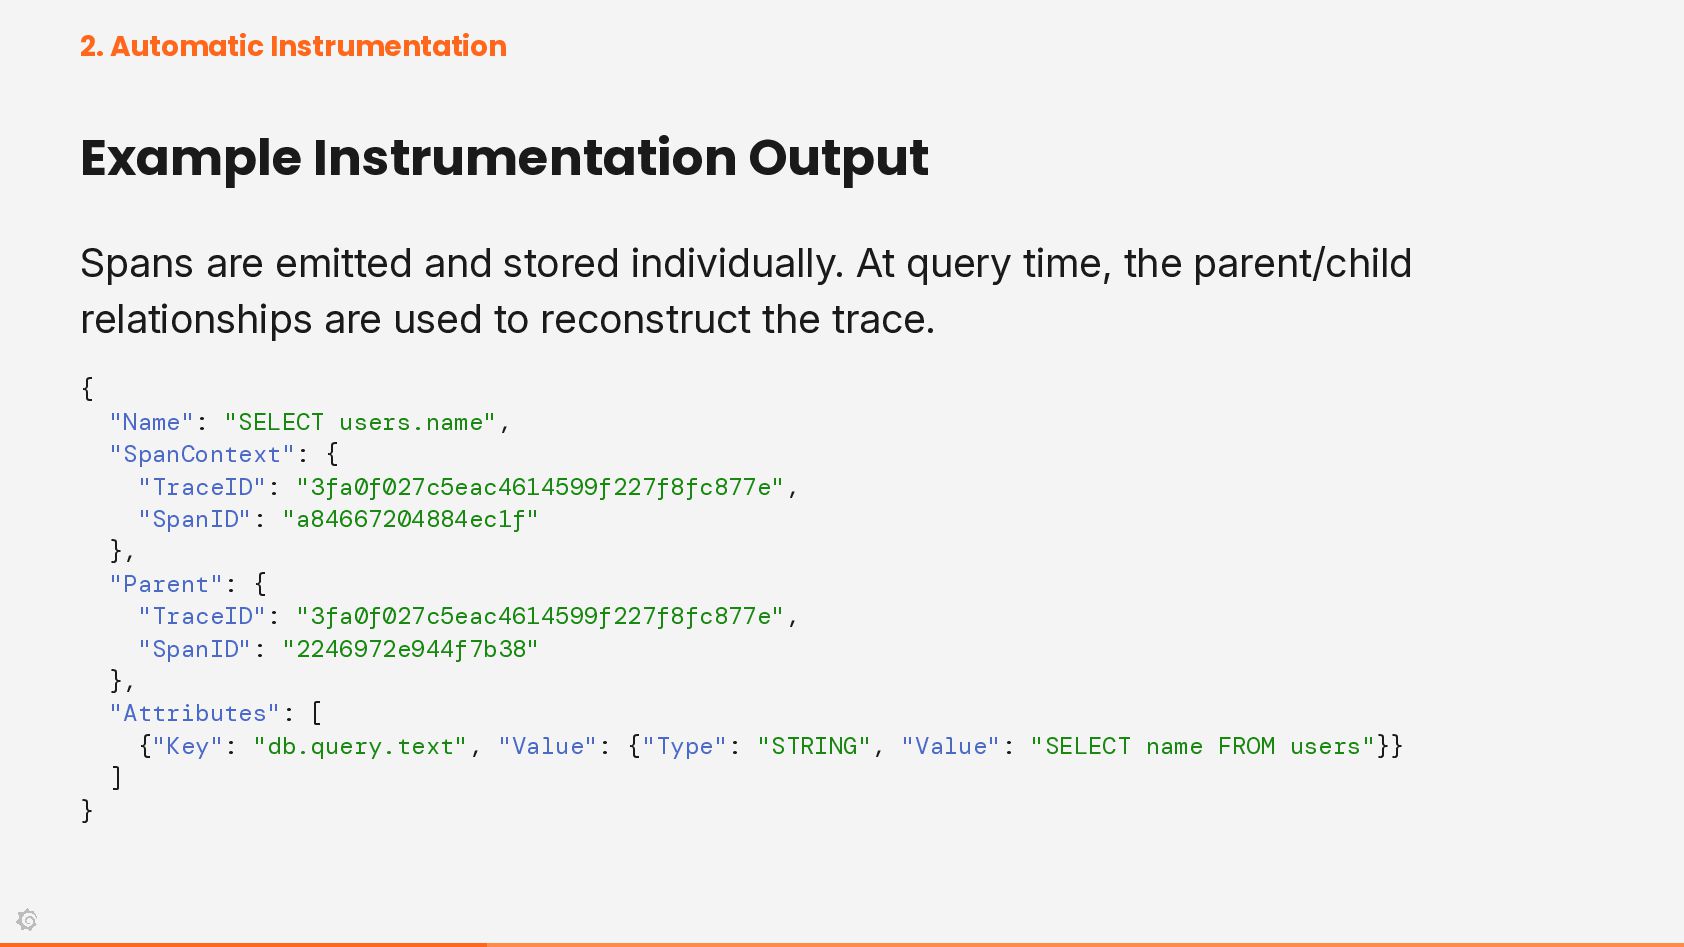
instrumentation, you embed span start/end around the code being instrumented • Nesting spans expresses the dependency relationships between operations • In Go, this state is propagated by passing a context that carries the trace state as an argument
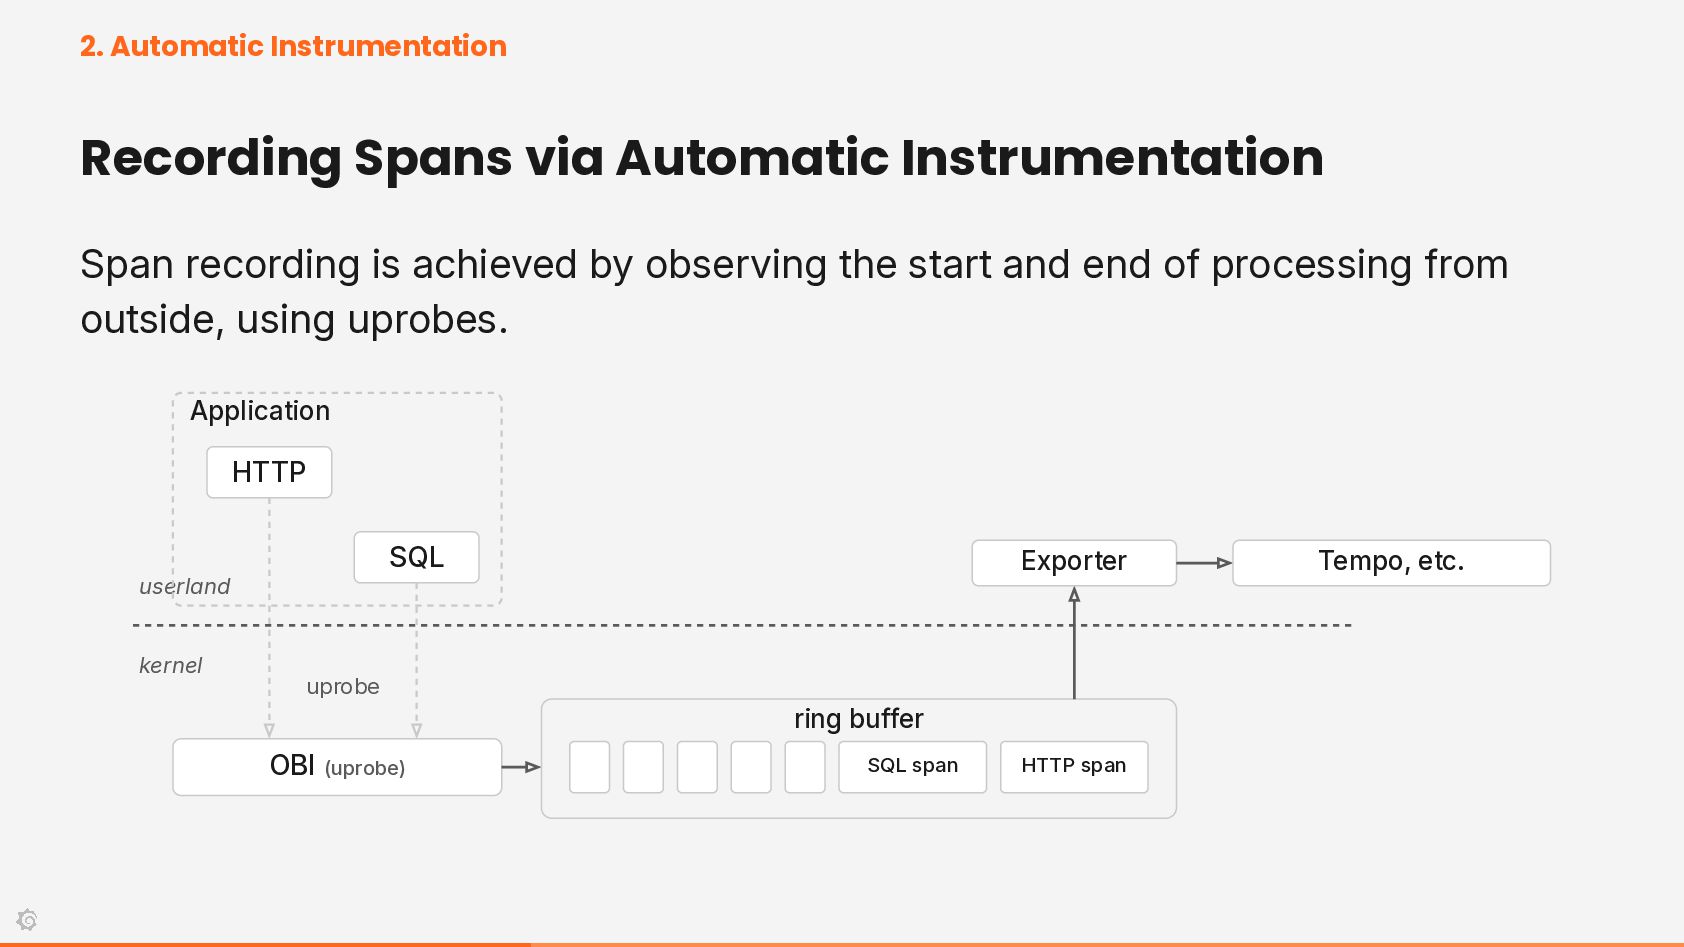
is achieved by observing the start and end of processing from outside, using uprobes. Application HTTP SQL userland kernel Exporter uprobe ring buffer OBI (uprobe) SQL span HTTP span Tempo, etc.
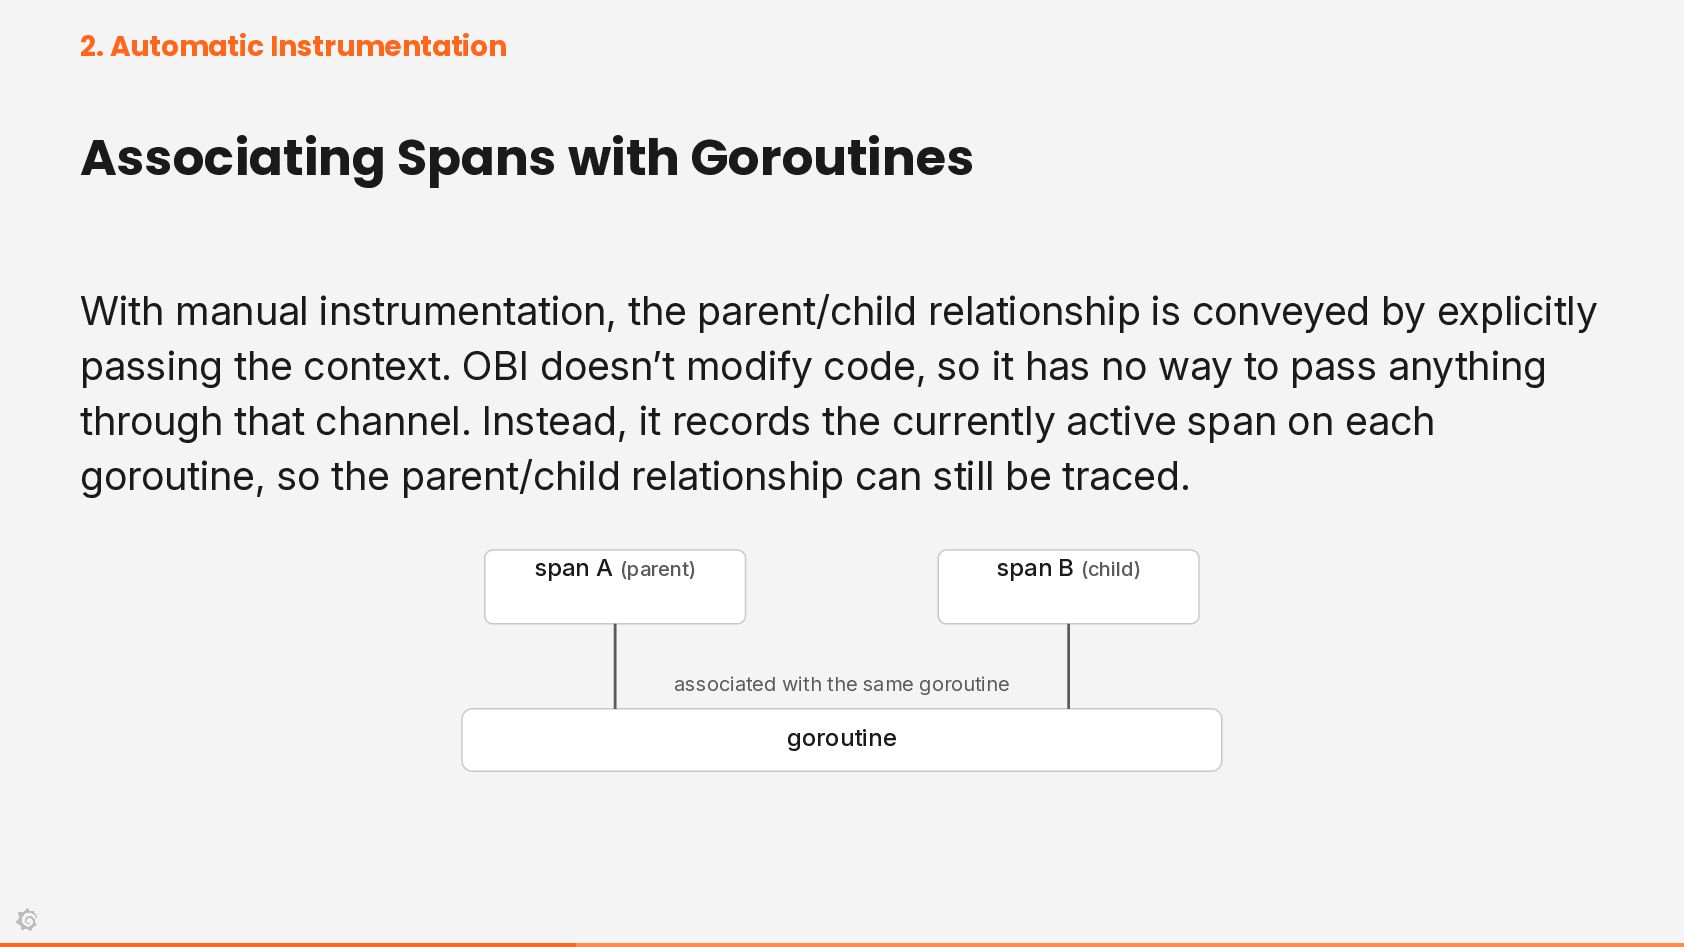
the parent/child relationship is conveyed by explicitly passing the context. OBI doesn’t modify code, so it has no way to pass anything through that channel. Instead, it records the currently active span on each goroutine, so the parent/child relationship can still be traced. span A (parent) span B (child) associated with the same goroutine goroutine
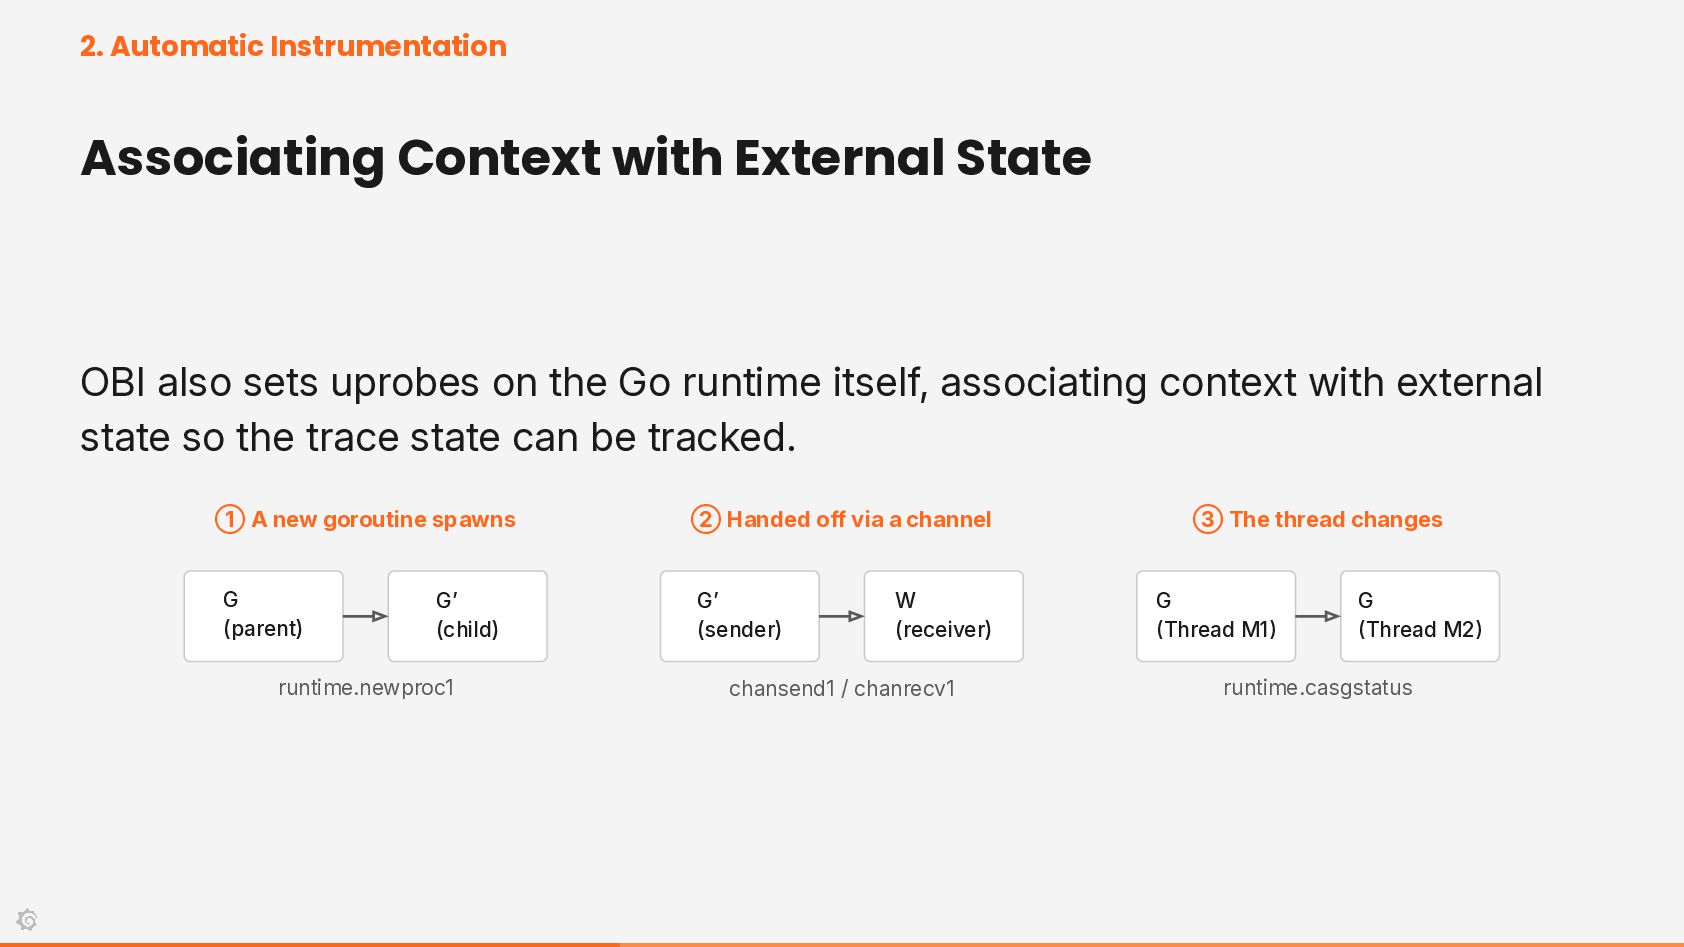
sets uprobes on the Go runtime itself, associating context with external state so the trace state can be tracked. ① A new goroutine spawns ② Handed off via a channel G (parent) G’ (sender) G’ (child) runtime.newproc1 W (receiver) chansend1 / chanrecv1 ③ The thread changes G (Thread M1) G (Thread M2) runtime.casgstatus
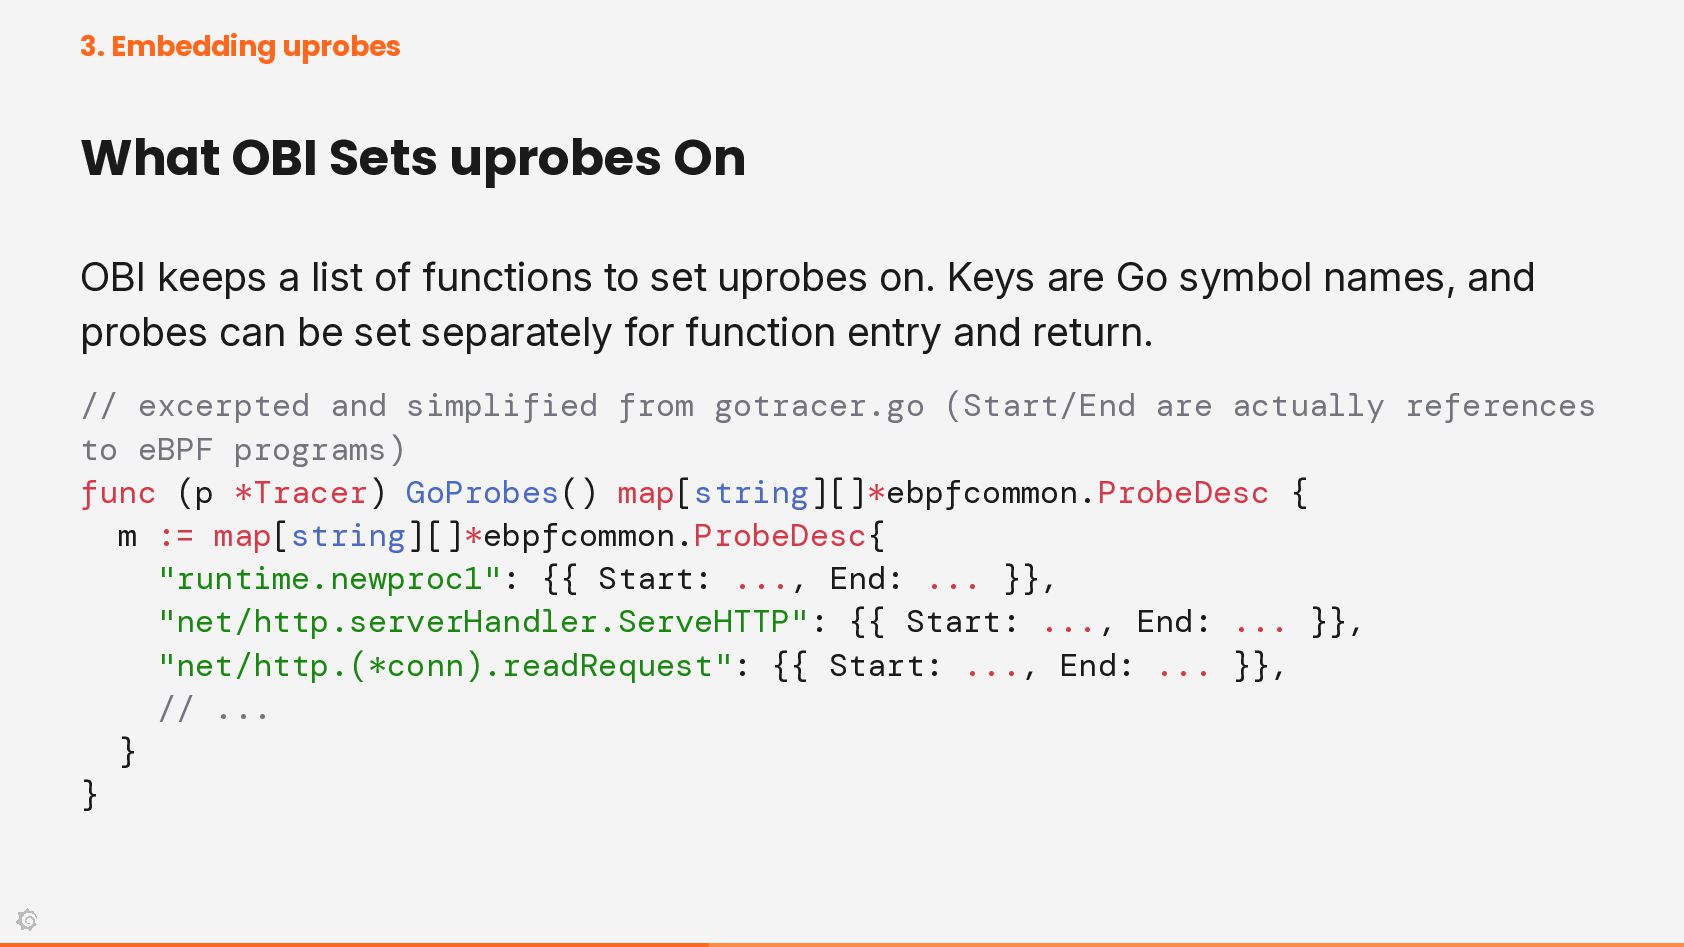
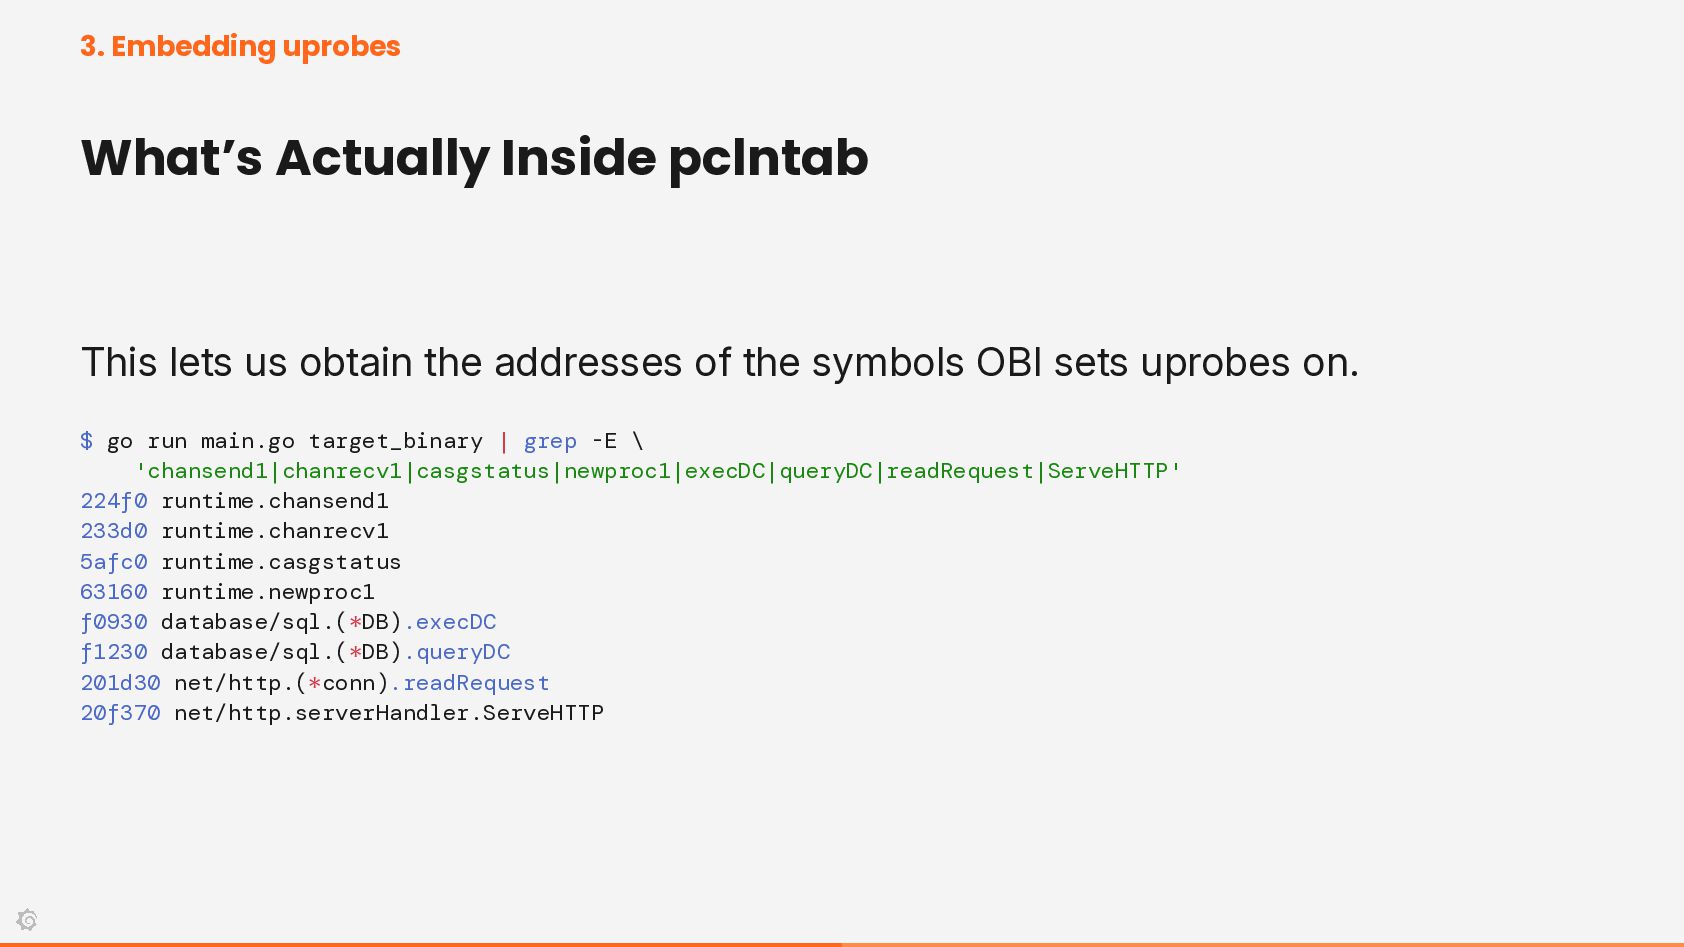
a list of functions to set uprobes on. Keys are Go symbol names, and probes can be set separately for function entry and return. // excerpted and simplified from gotracer.go (Start/End are actually references to eBPF programs) func (p *Tracer) GoProbes() map[string][]*ebpfcommon.ProbeDesc { m := map[string][]*ebpfcommon.ProbeDesc{ "runtime.newproc1": {{ Start: ..., End: ... }}, "net/http.serverHandler.ServeHTTP": {{ Start: ..., End: ... }}, "net/http.(*conn).readRequest": {{ Start: ..., End: ... }}, // ... } }
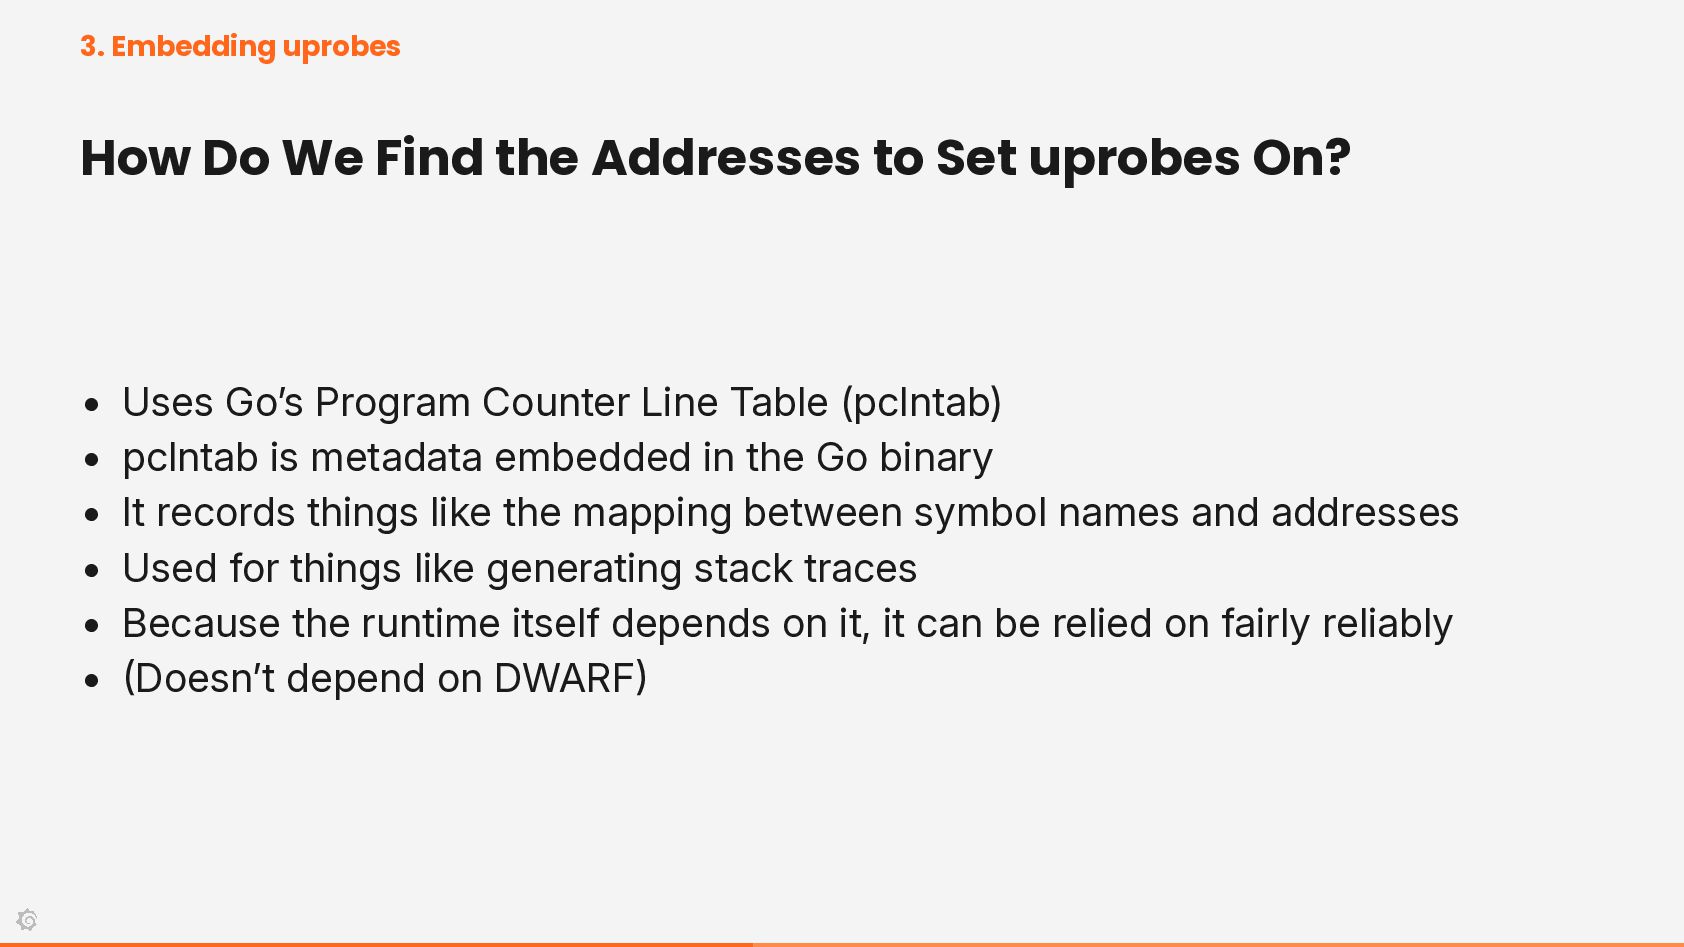
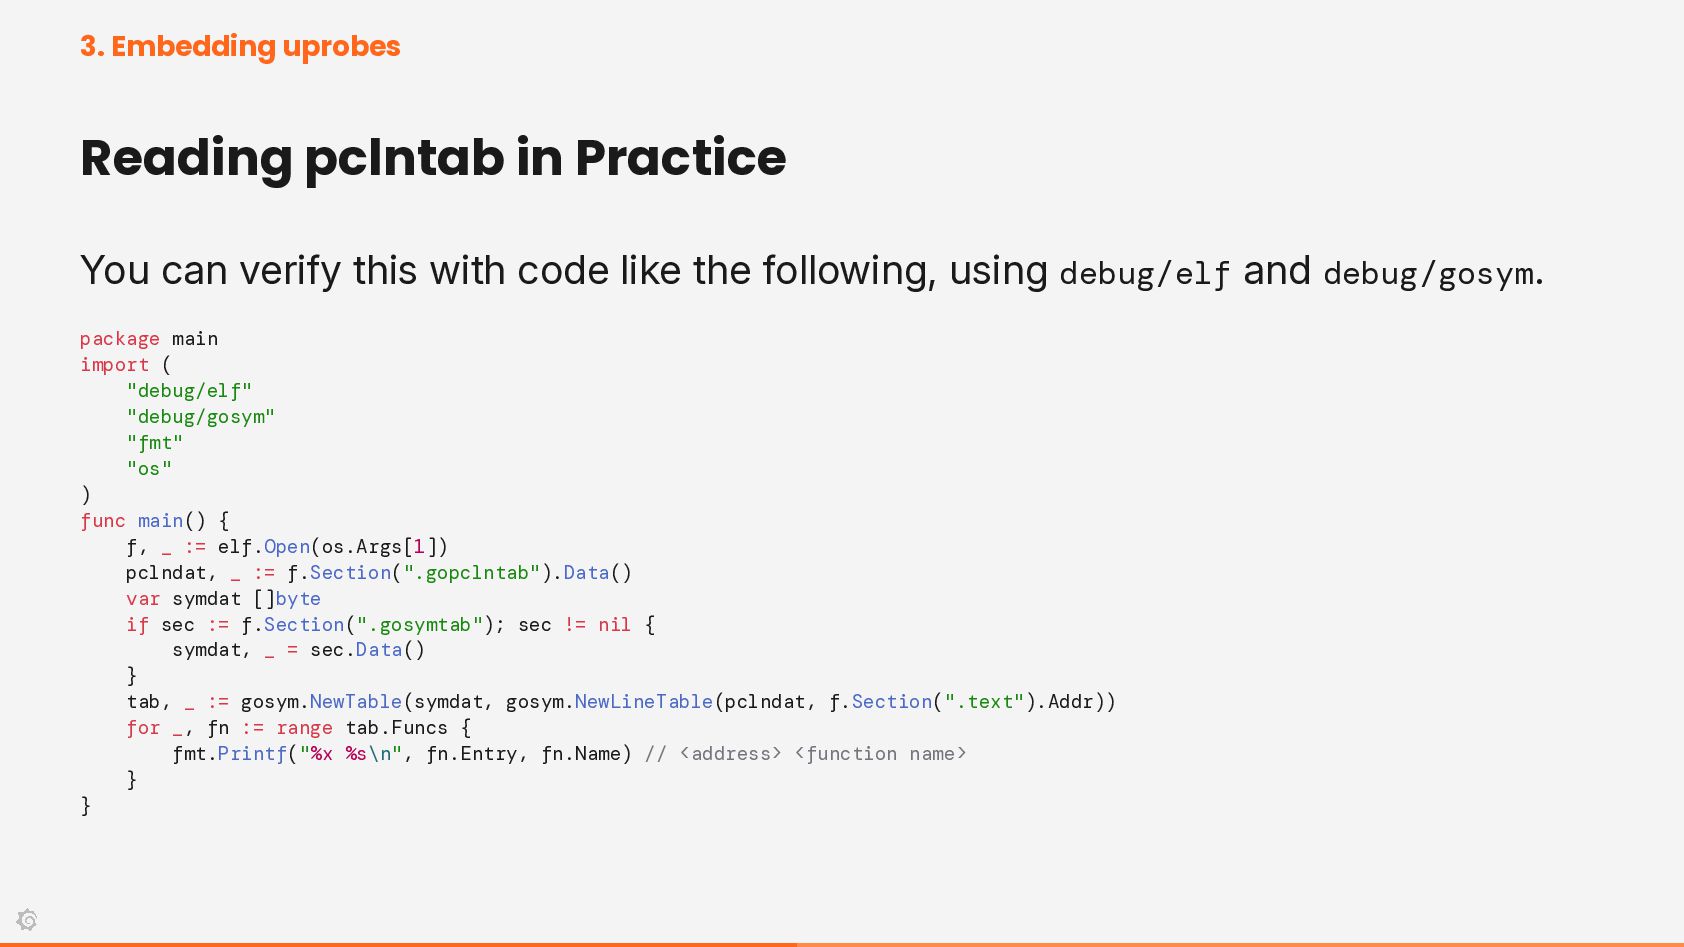
Set uprobes On? • Uses Go’s Program Counter Line Table (pclntab) • pclntab is metadata embedded in the Go binary • It records things like the mapping between symbol names and addresses • Used for things like generating stack traces • Because the runtime itself depends on it, it can be relied on fairly reliably • (Doesn’t depend on DWARF)
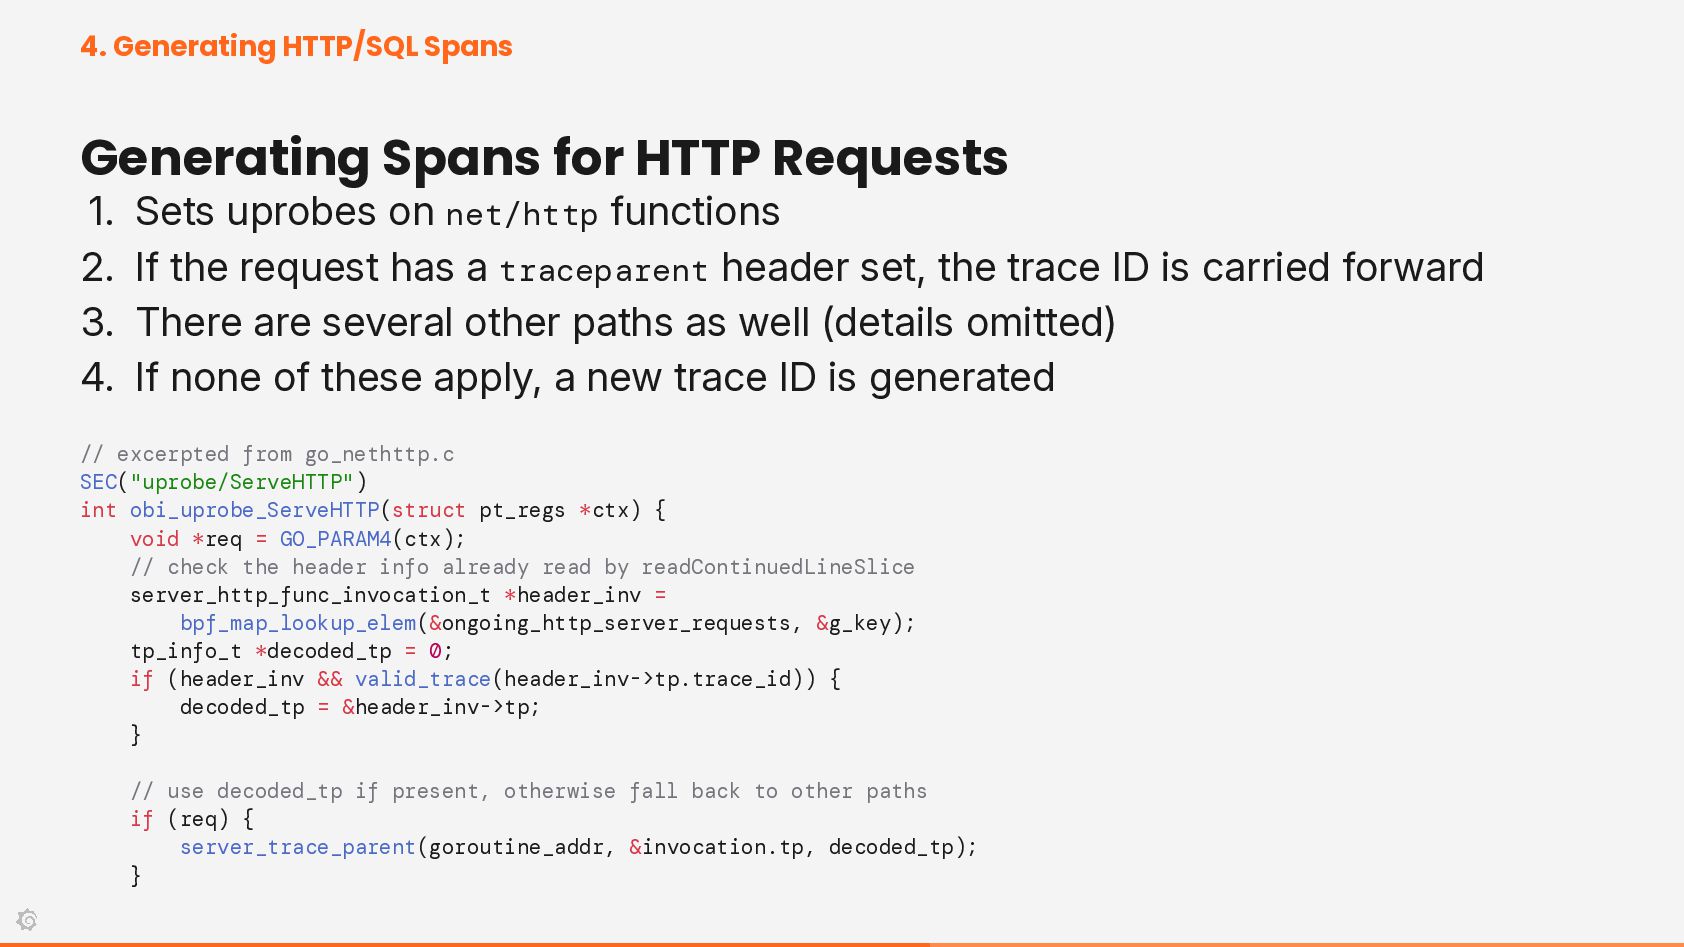
Sets uprobes on net/http functions 2. If the request has a traceparent header set, the trace ID is carried forward 3. There are several other paths as well (details omitted) 4. If none of these apply, a new trace ID is generated // excerpted from go_nethttp.c SEC("uprobe/ServeHTTP") int obi_uprobe_ServeHTTP(struct pt_regs *ctx) { void *req = GO_PARAM4(ctx); // check the header info already read by readContinuedLineSlice server_http_func_invocation_t *header_inv = bpf_map_lookup_elem(&ongoing_http_server_requests, &g_key); tp_info_t *decoded_tp = 0; if (header_inv && valid_trace(header_inv->tp.trace_id)) { decoded_tp = &header_inv->tp; } // use decoded_tp if present, otherwise fall back to other paths if (req) { server_trace_parent(goroutine_addr, &invocation.tp, decoded_tp); }
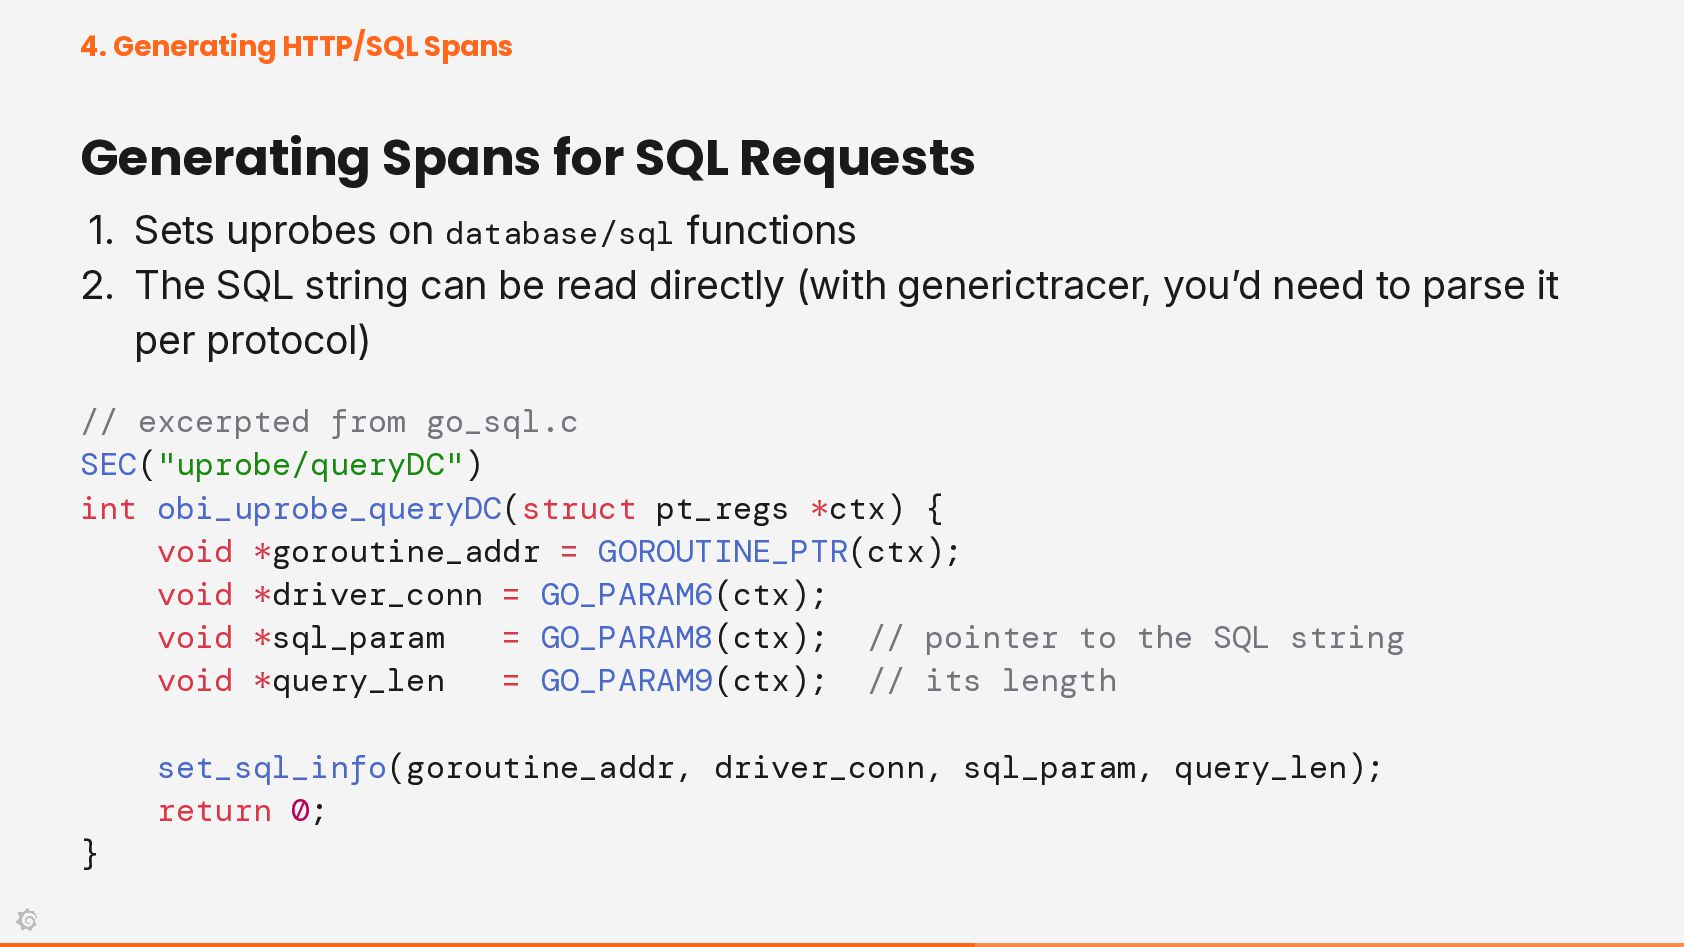
Sets uprobes on database/sql functions 2. The SQL string can be read directly (with generictracer, you’d need to parse it per protocol) // excerpted from go_sql.c SEC("uprobe/queryDC") int obi_uprobe_queryDC(struct pt_regs *ctx) { void *goroutine_addr = GOROUTINE_PTR(ctx); void *driver_conn = GO_PARAM6(ctx); void *sql_param = GO_PARAM8(ctx); // pointer to the SQL string void *query_len = GO_PARAM9(ctx); // its length set_sql_info(goroutine_addr, driver_conn, sql_param, query_len); return 0; }
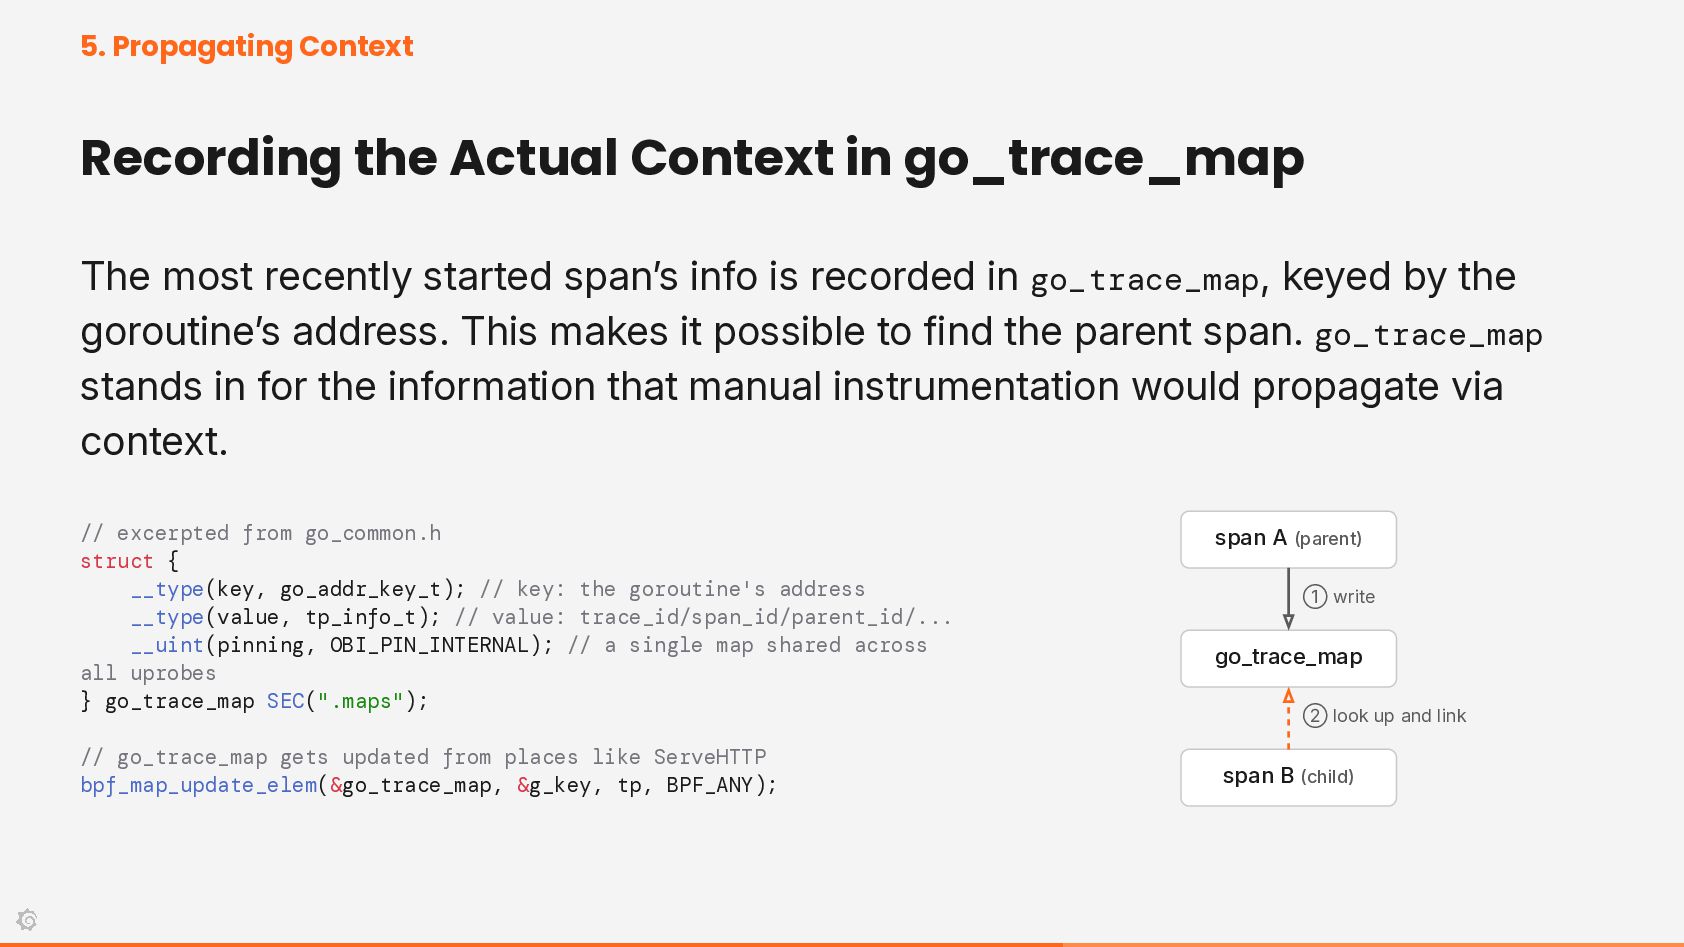
most recently started span’s info is recorded in go_trace_map, keyed by the goroutine’s address. This makes it possible to find the parent span. go_trace_map stands in for the information that manual instrumentation would propagate via context. // excerpted from go_common.h struct { __type(key, go_addr_key_t); // key: the goroutine's address __type(value, tp_info_t); // value: trace_id/span_id/parent_id/... __uint(pinning, OBI_PIN_INTERNAL); // a single map shared across all uprobes } go_trace_map SEC(".maps"); // go_trace_map gets updated from places like ServeHTTP bpf_map_update_elem(&go_trace_map, &g_key, tp, BPF_ANY); span A (parent) ① write go_trace_map ② look up and link span B (child)
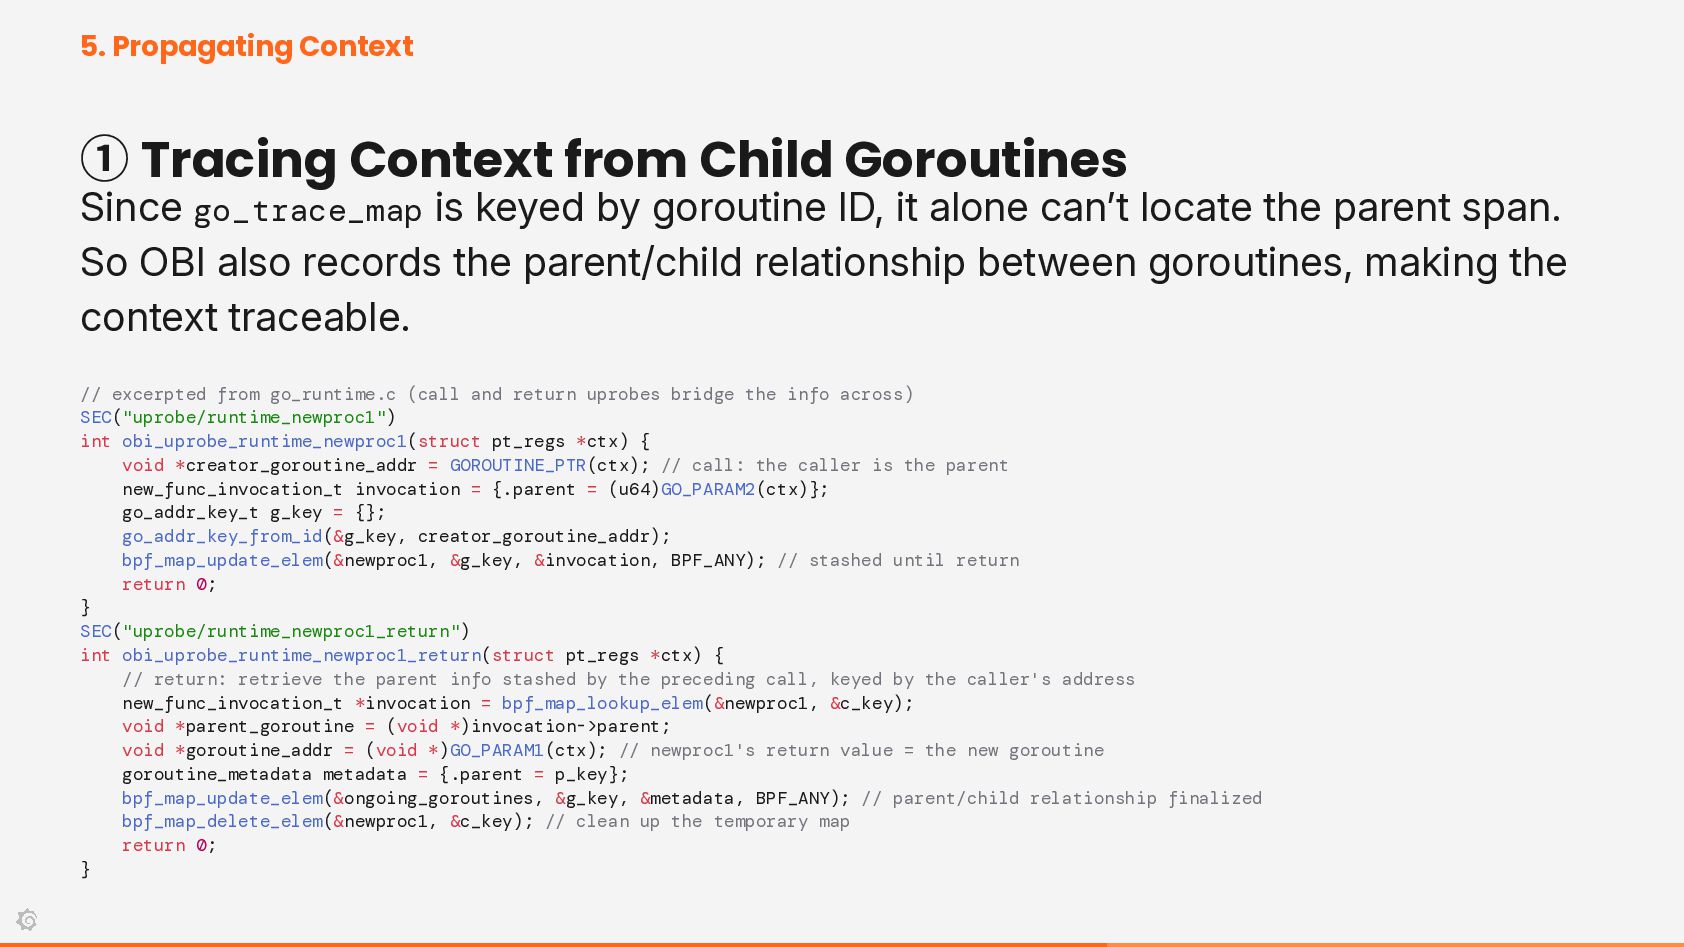
go_trace_map is keyed by goroutine ID, it alone can’t locate the parent span. So OBI also records the parent/child relationship between goroutines, making the context traceable. // excerpted from go_runtime.c (call and return uprobes bridge the info across) SEC("uprobe/runtime_newproc1") int obi_uprobe_runtime_newproc1(struct pt_regs *ctx) { void *creator_goroutine_addr = GOROUTINE_PTR(ctx); // call: the caller is the parent new_func_invocation_t invocation = {.parent = (u64)GO_PARAM2(ctx)}; go_addr_key_t g_key = {}; go_addr_key_from_id(&g_key, creator_goroutine_addr); bpf_map_update_elem(&newproc1, &g_key, &invocation, BPF_ANY); // stashed until return return 0; } SEC("uprobe/runtime_newproc1_return") int obi_uprobe_runtime_newproc1_return(struct pt_regs *ctx) { // return: retrieve the parent info stashed by the preceding call, keyed by the caller's address new_func_invocation_t *invocation = bpf_map_lookup_elem(&newproc1, &c_key); void *parent_goroutine = (void *)invocation->parent; void *goroutine_addr = (void *)GO_PARAM1(ctx); // newproc1's return value = the new goroutine goroutine_metadata metadata = {.parent = p_key}; bpf_map_update_elem(&ongoing_goroutines, &g_key, &metadata, BPF_ANY); // parent/child relationship finalized bpf_map_delete_elem(&newproc1, &c_key); // clean up the temporary map return 0; }
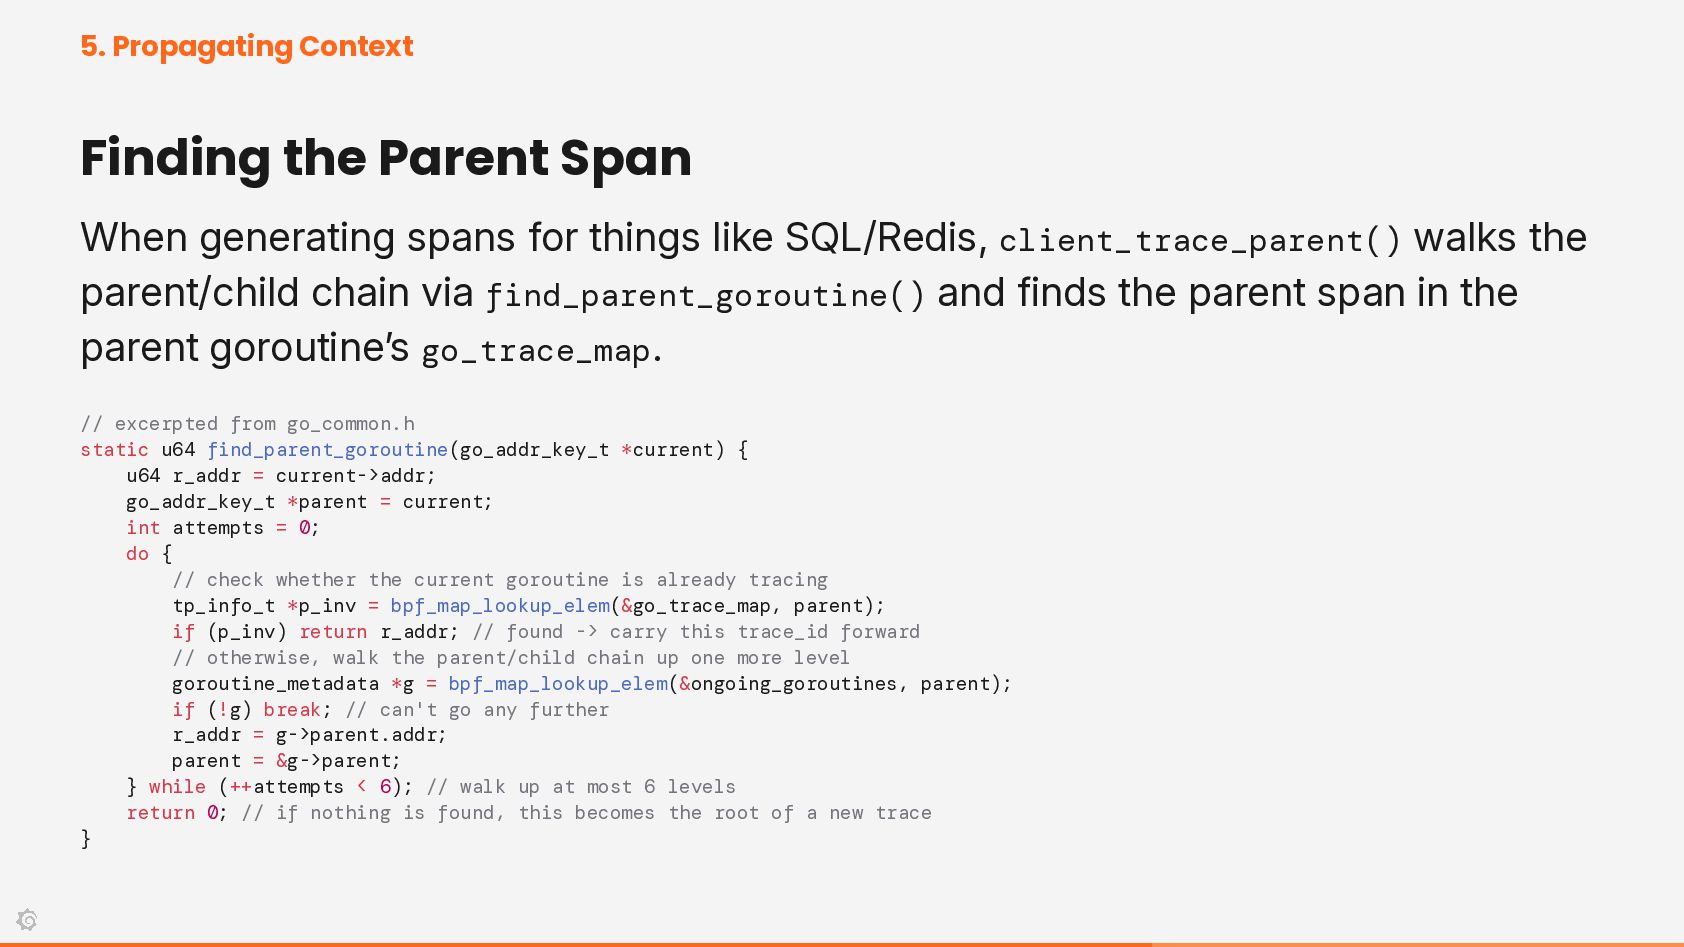
for things like SQL/Redis, client_trace_parent() walks the parent/child chain via find_parent_goroutine() and finds the parent span in the parent goroutine’s go_trace_map. // excerpted from go_common.h static u64 find_parent_goroutine(go_addr_key_t *current) { u64 r_addr = current->addr; go_addr_key_t *parent = current; int attempts = 0; do { // check whether the current goroutine is already tracing tp_info_t *p_inv = bpf_map_lookup_elem(&go_trace_map, parent); if (p_inv) return r_addr; // found -> carry this trace_id forward // otherwise, walk the parent/child chain up one more level goroutine_metadata *g = bpf_map_lookup_elem(&ongoing_goroutines, parent); if (!g) break; // can't go any further r_addr = g->parent.addr; parent = &g->parent; } while (++attempts < 6); // walk up at most 6 levels return 0; // if nothing is found, this becomes the root of a new trace }
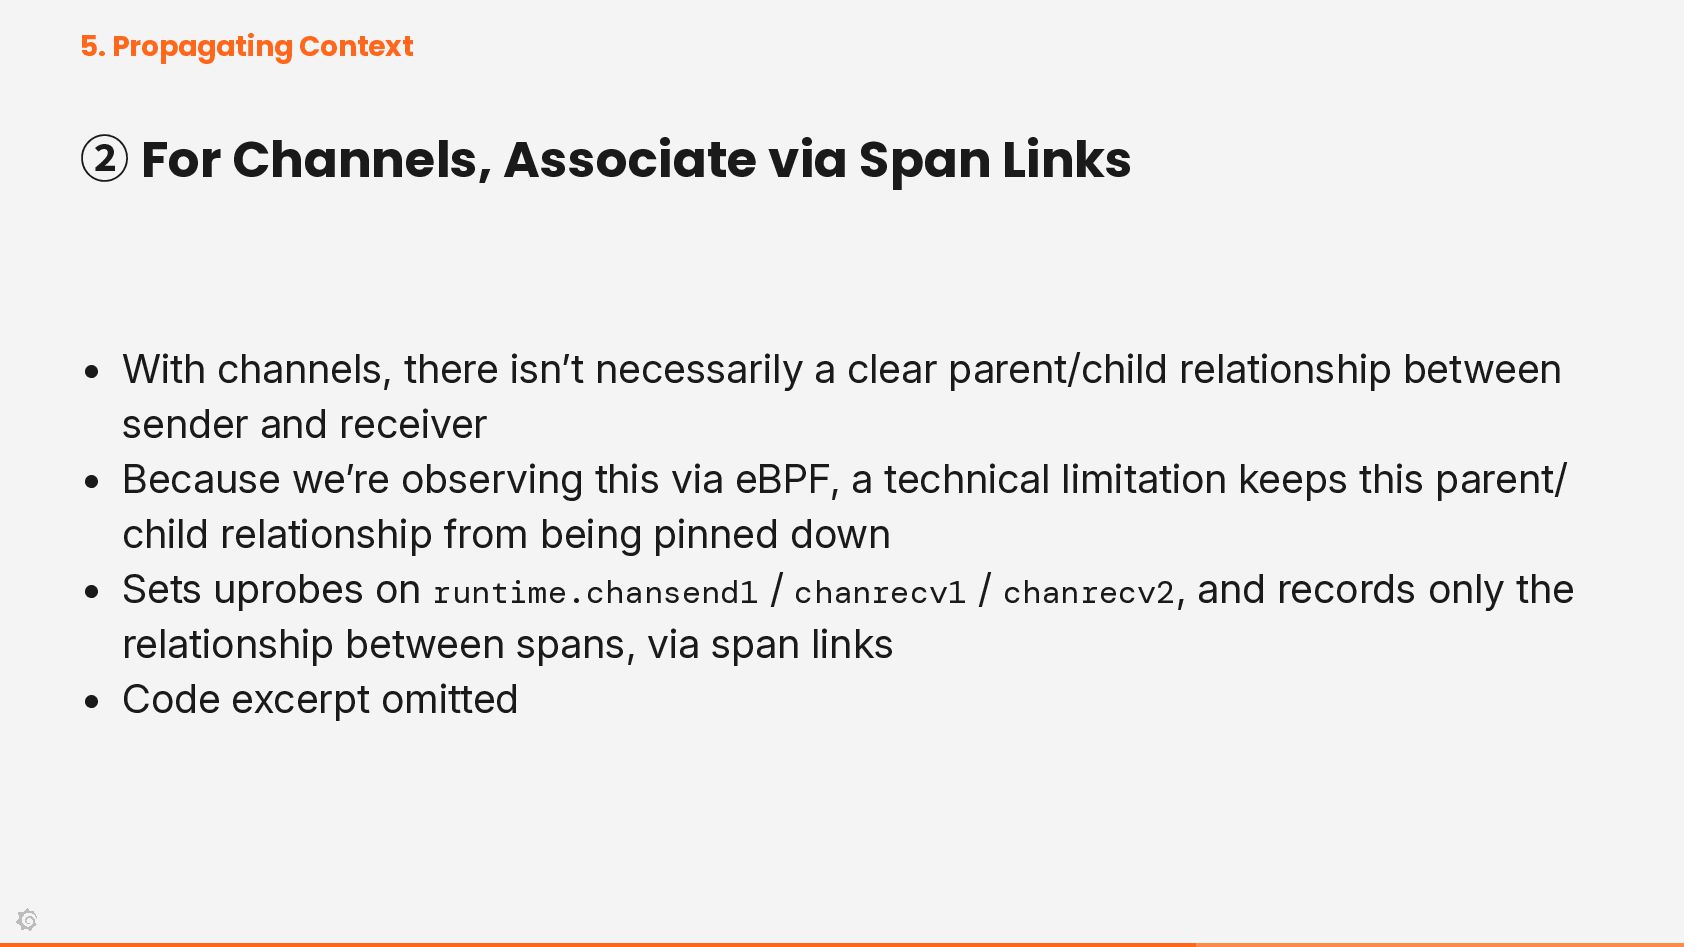
• With channels, there isn’t necessarily a clear parent/child relationship between sender and receiver • Because we’re observing this via eBPF, a technical limitation keeps this parent/ child relationship from being pinned down • Sets uprobes on runtime.chansend1 / chanrecv1 / chanrecv2, and records only the relationship between spans, via span links • Code excerpt omitted
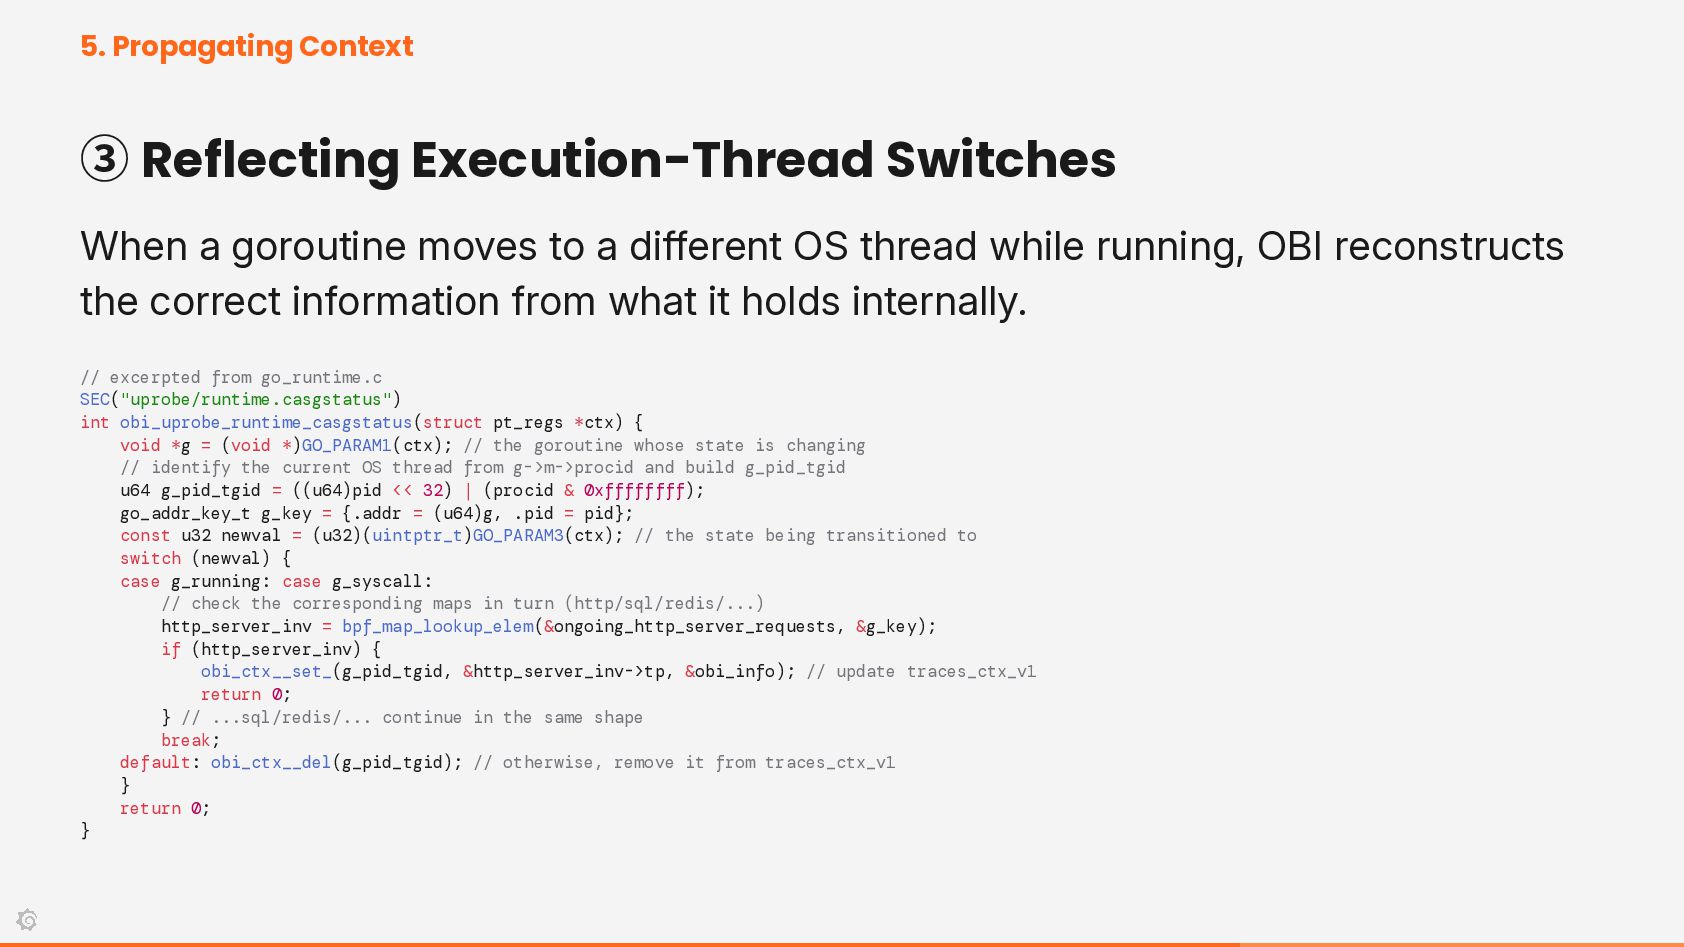
moves to a different OS thread while running, OBI reconstructs the correct information from what it holds internally. // excerpted from go_runtime.c SEC("uprobe/runtime.casgstatus") int obi_uprobe_runtime_casgstatus(struct pt_regs *ctx) { void *g = (void *)GO_PARAM1(ctx); // the goroutine whose state is changing // identify the current OS thread from g->m->procid and build g_pid_tgid u64 g_pid_tgid = ((u64)pid << 32) | (procid & 0xffffffff); go_addr_key_t g_key = {.addr = (u64)g, .pid = pid}; const u32 newval = (u32)(uintptr_t)GO_PARAM3(ctx); // the state being transitioned to switch (newval) { case g_running: case g_syscall: // check the corresponding maps in turn (http/sql/redis/...) http_server_inv = bpf_map_lookup_elem(&ongoing_http_server_requests, &g_key); if (http_server_inv) { obi_ctx__set_(g_pid_tgid, &http_server_inv->tp, &obi_info); // update traces_ctx_v1 return 0; } // ...sql/redis/... continue in the same shape break; default: obi_ctx__del(g_pid_tgid); // otherwise, remove it from traces_ctx_v1 } return 0; }
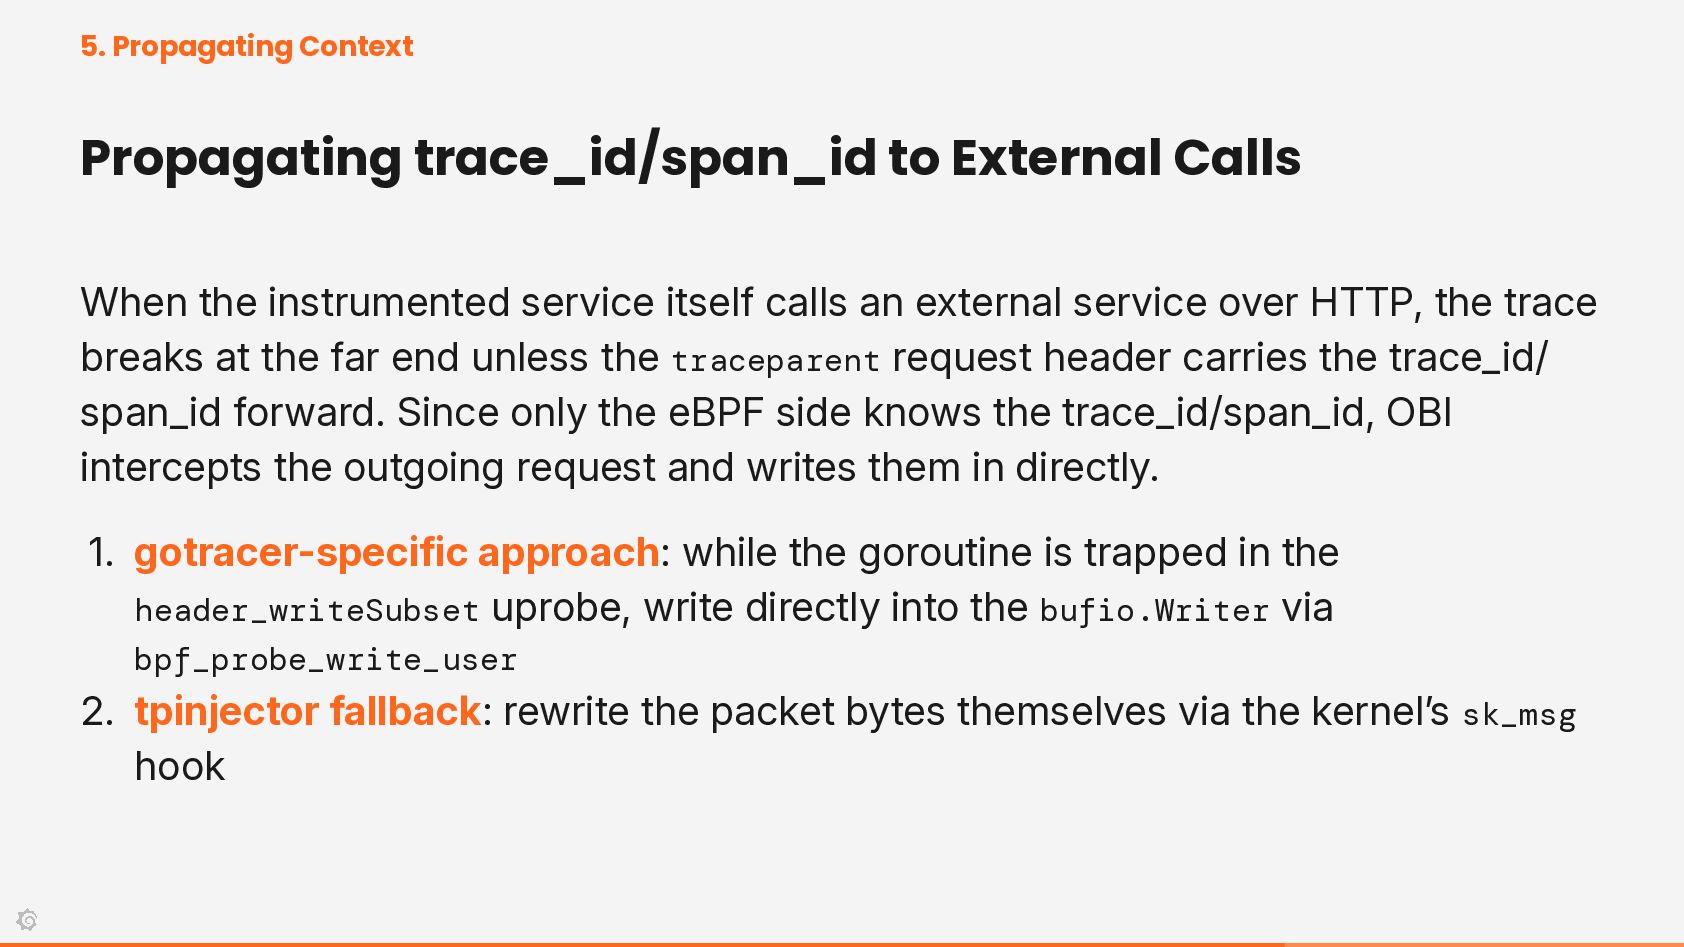
instrumented service itself calls an external service over HTTP, the trace breaks at the far end unless the traceparent request header carries the trace_id/ span_id forward. Since only the eBPF side knows the trace_id/span_id, OBI intercepts the outgoing request and writes them in directly. 1. gotracer-specific approach: while the goroutine is trapped in the header_writeSubset uprobe, write directly into the bufio.Writer via bpf_probe_write_user 2. tpinjector fallback: rewrite the packet bytes themselves via the kernel’s sk_msg hook
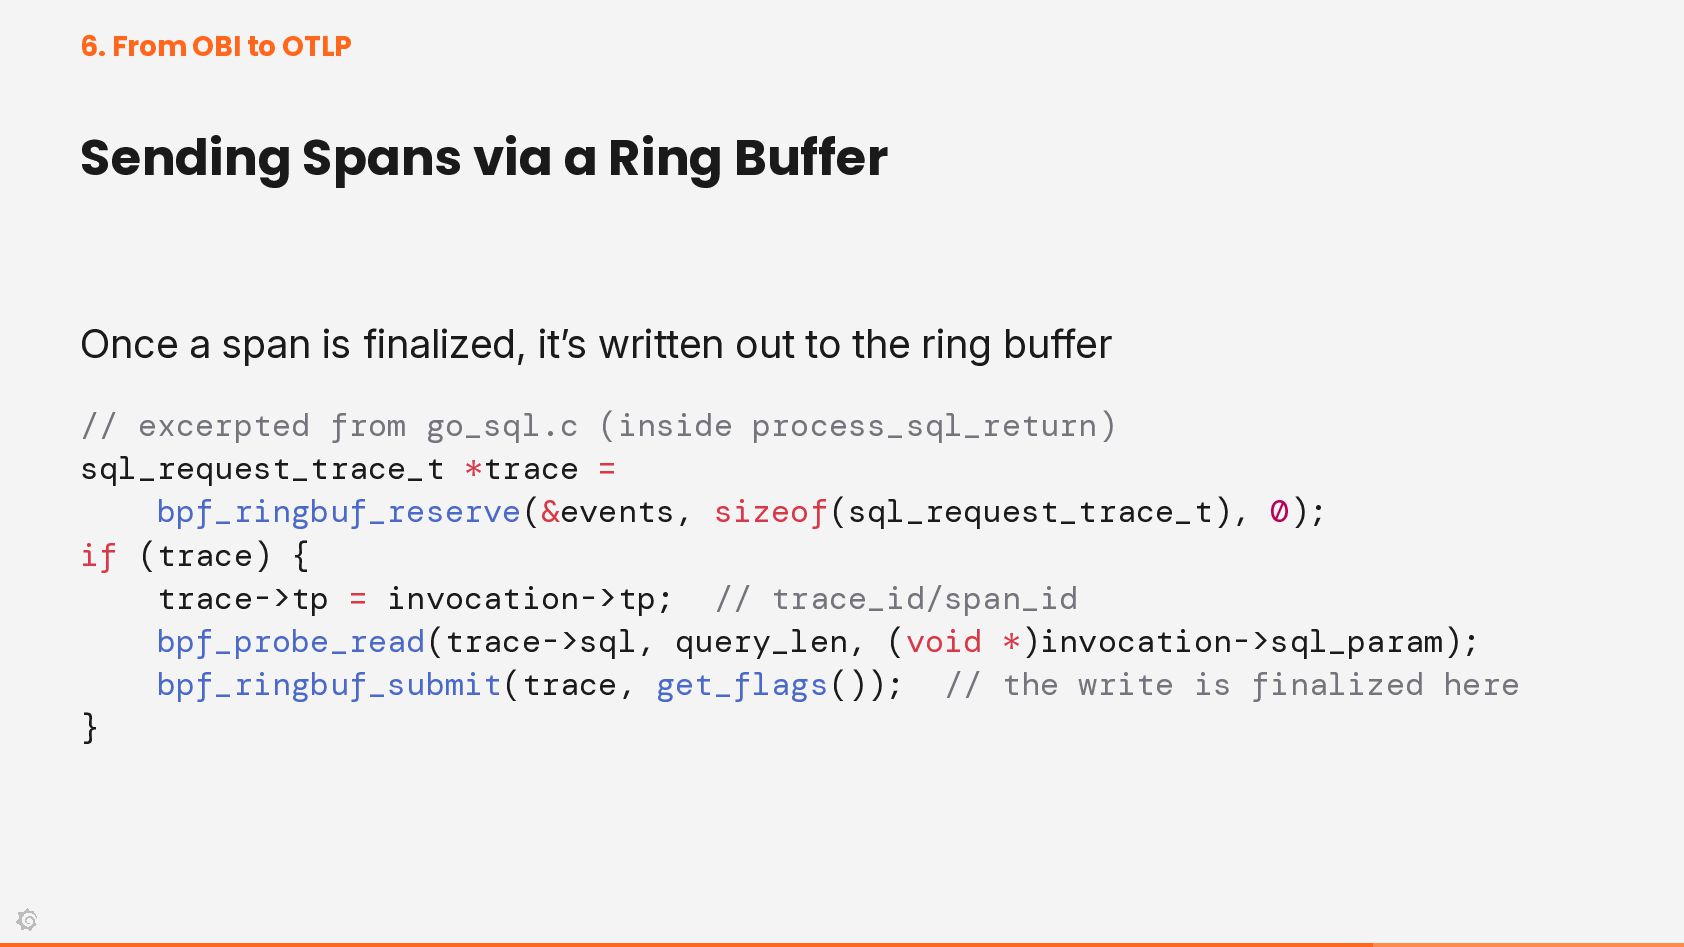
Buffer Once a span is finalized, it’s written out to the ring buffer // excerpted from go_sql.c (inside process_sql_return) sql_request_trace_t *trace = bpf_ringbuf_reserve(&events, sizeof(sql_request_trace_t), 0); if (trace) { trace->tp = invocation->tp; // trace_id/span_id bpf_probe_read(trace->sql, query_len, (void *)invocation->sql_param); bpf_ringbuf_submit(trace, get_flags()); // the write is finalized here }
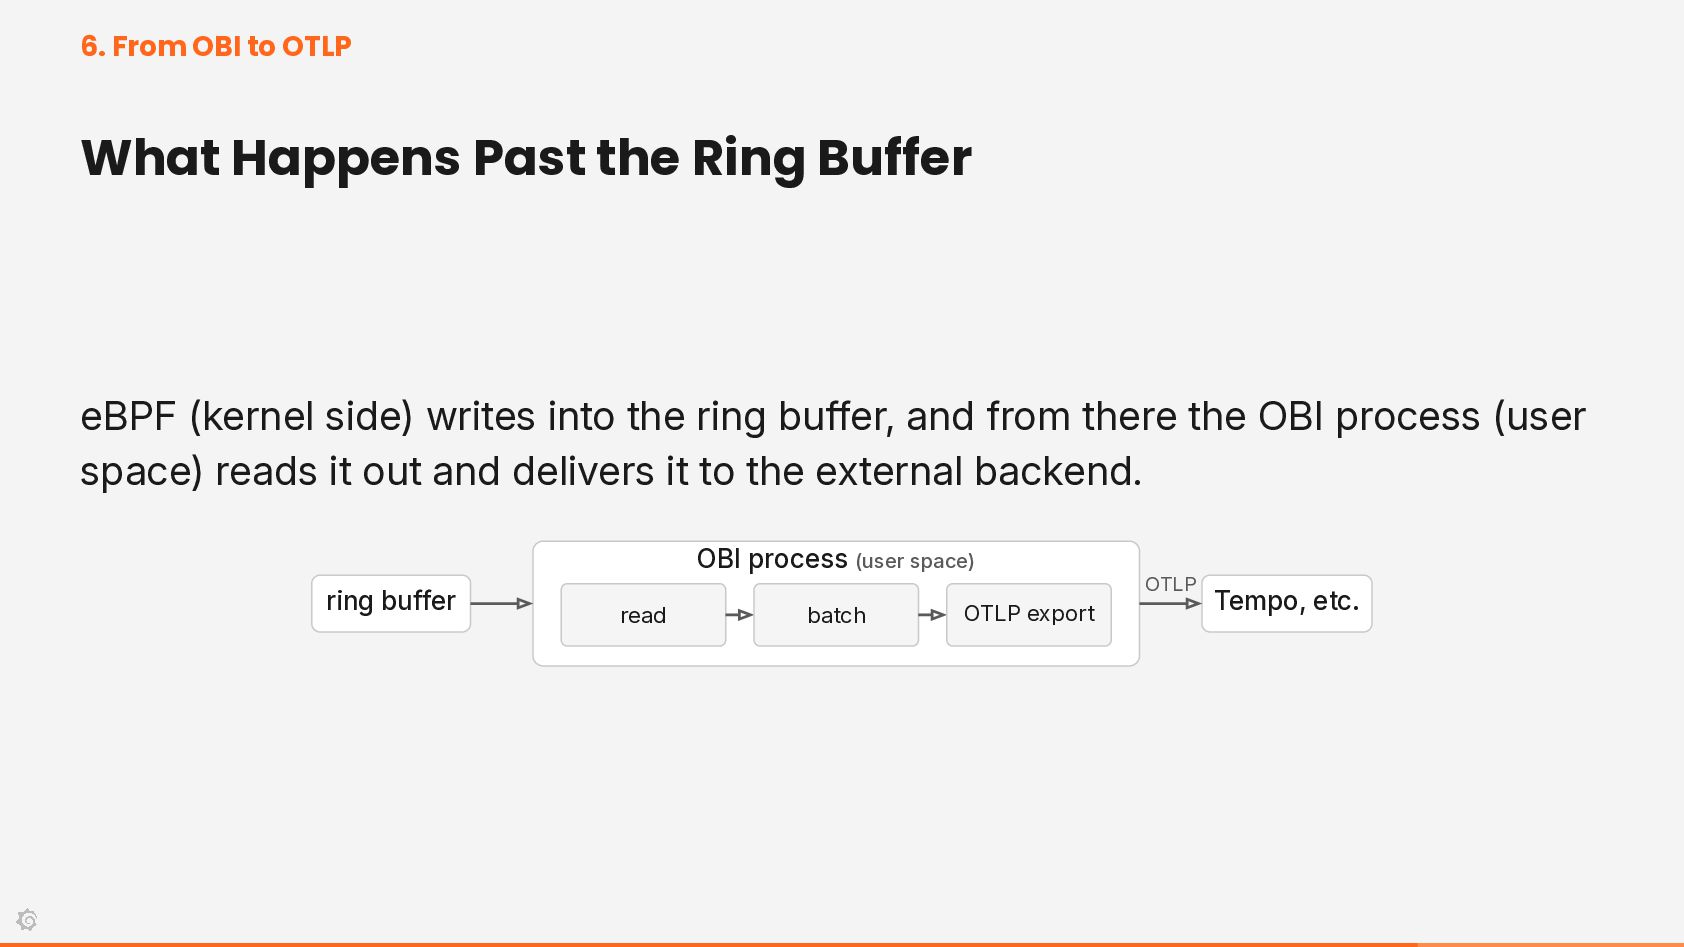
Buffer eBPF (kernel side) writes into the ring buffer, and from there the OBI process (user space) reads it out and delivers it to the external backend. OBI process (user space) ring buffer read batch OTLP export OTLP Tempo, etc.
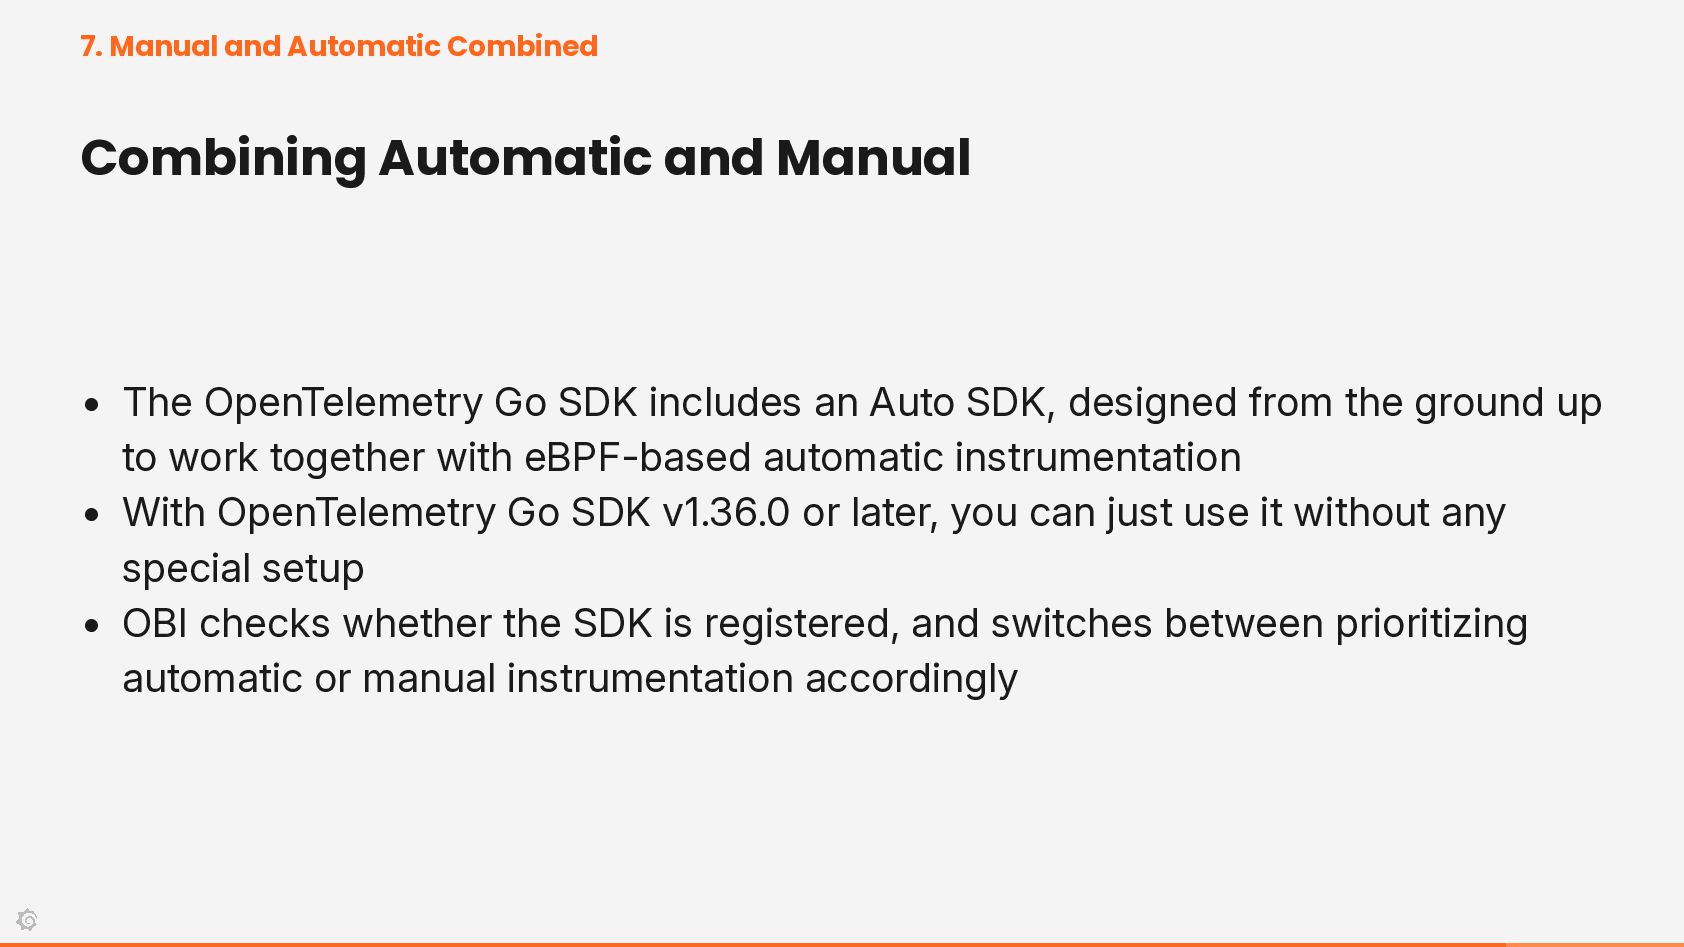
The OpenTelemetry Go SDK includes an Auto SDK, designed from the ground up to work together with eBPF-based automatic instrumentation • With OpenTelemetry Go SDK v1.36.0 or later, you can just use it without any special setup • OBI checks whether the SDK is registered, and switches between prioritizing automatic or manual instrumentation accordingly
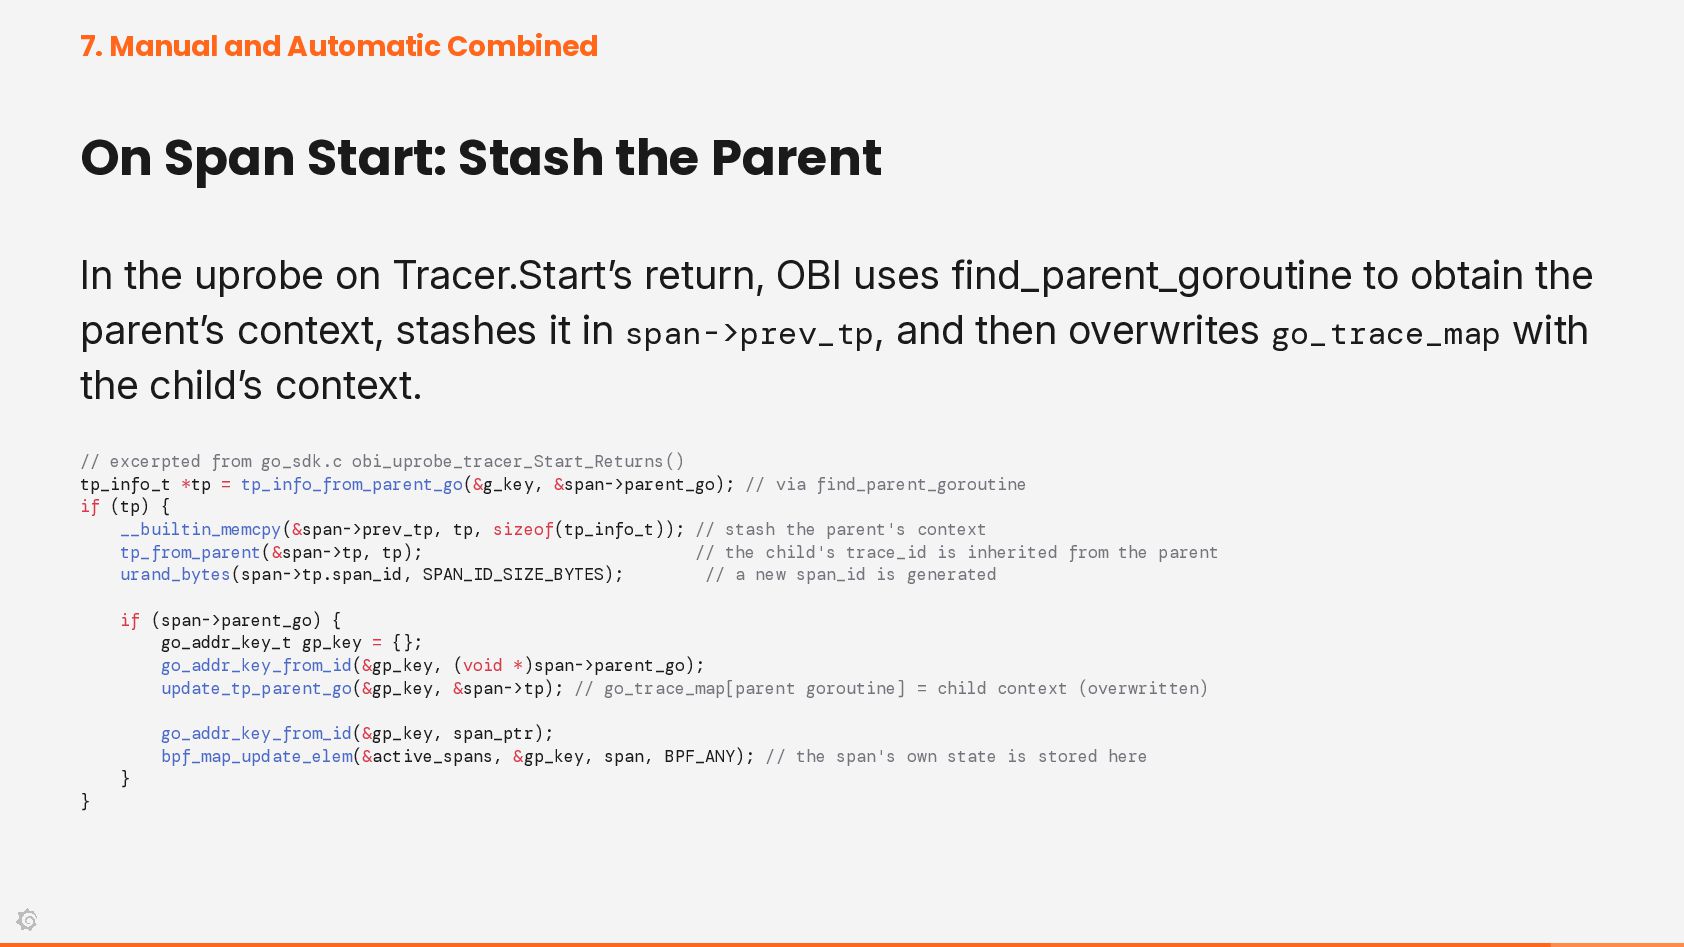
Parent In the uprobe on Tracer.Start’s return, OBI uses find_parent_goroutine to obtain the parent’s context, stashes it in span->prev_tp, and then overwrites go_trace_map with the child’s context. // excerpted from go_sdk.c obi_uprobe_tracer_Start_Returns() tp_info_t *tp = tp_info_from_parent_go(&g_key, &span->parent_go); // via find_parent_goroutine if (tp) { __builtin_memcpy(&span->prev_tp, tp, sizeof(tp_info_t)); // stash the parent's context tp_from_parent(&span->tp, tp); // the child's trace_id is inherited from the parent urand_bytes(span->tp.span_id, SPAN_ID_SIZE_BYTES); // a new span_id is generated if (span->parent_go) { go_addr_key_t gp_key = {}; go_addr_key_from_id(&gp_key, (void *)span->parent_go); update_tp_parent_go(&gp_key, &span->tp); // go_trace_map[parent goroutine] = child context (overwritten) go_addr_key_from_id(&gp_key, span_ptr); bpf_map_update_elem(&active_spans, &gp_key, span, BPF_ANY); // the span's own state is stored here } }
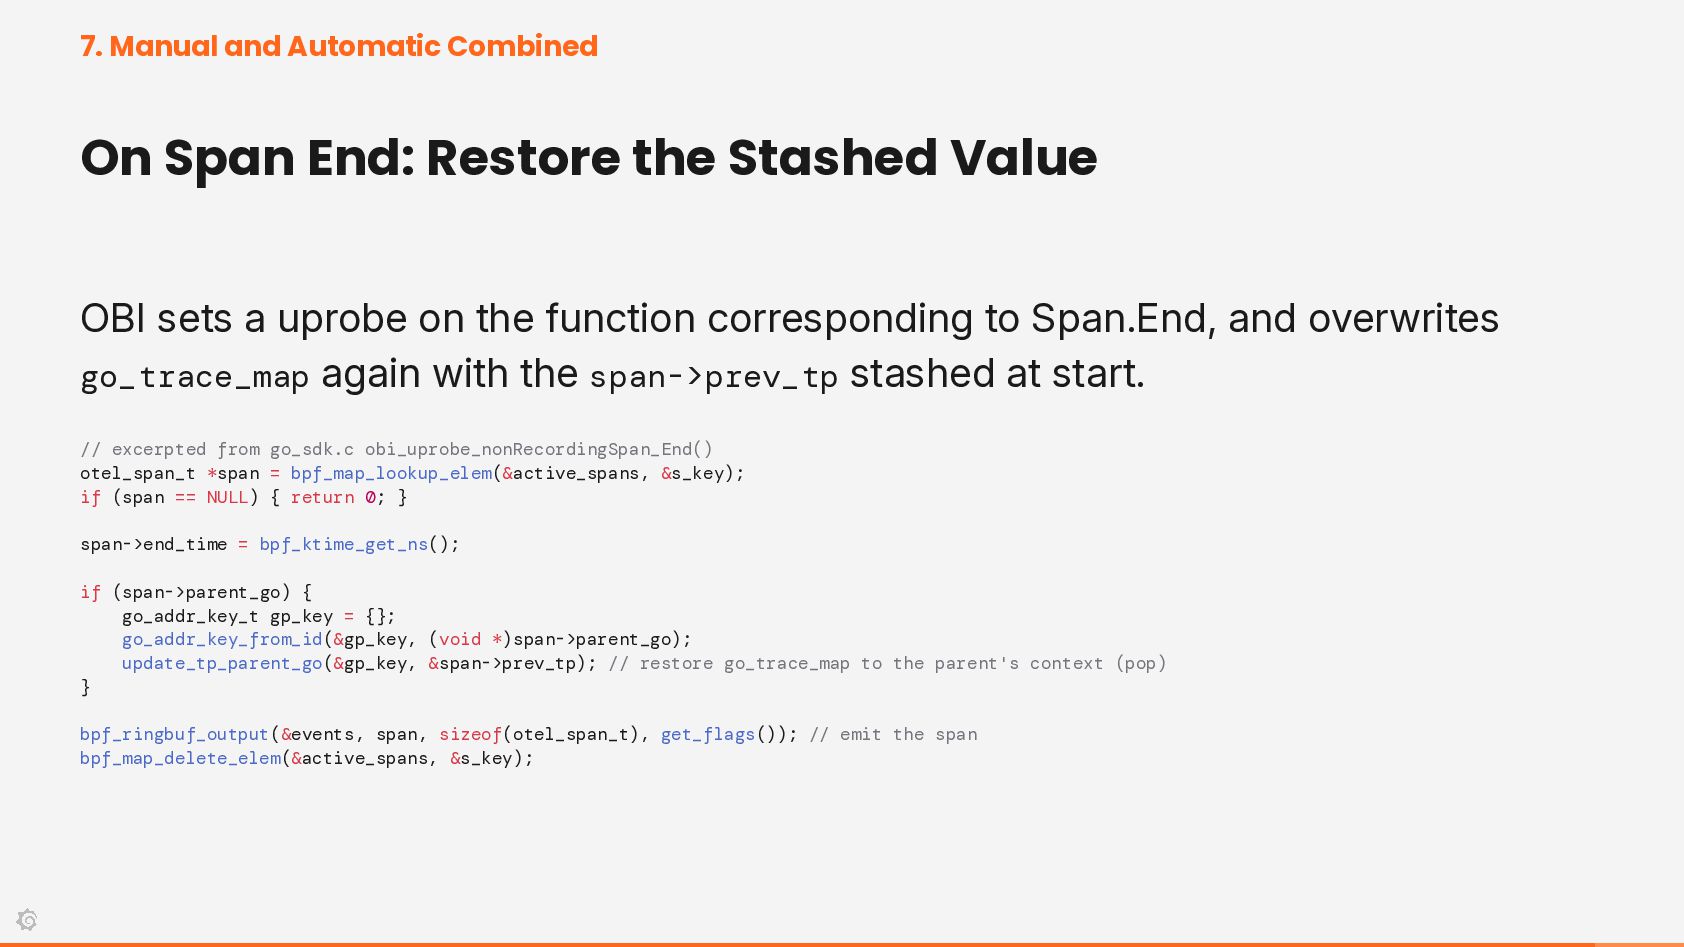
Stashed Value OBI sets a uprobe on the function corresponding to Span.End, and overwrites go_trace_map again with the span->prev_tp stashed at start. // excerpted from go_sdk.c obi_uprobe_nonRecordingSpan_End() otel_span_t *span = bpf_map_lookup_elem(&active_spans, &s_key); if (span == NULL) { return 0; } span->end_time = bpf_ktime_get_ns(); if (span->parent_go) { go_addr_key_t gp_key = {}; go_addr_key_from_id(&gp_key, (void *)span->parent_go); update_tp_parent_go(&gp_key, &span->prev_tp); // restore go_trace_map to the parent's context (pop) } bpf_ringbuf_output(&events, span, sizeof(otel_span_t), get_flags()); // emit the span bpf_map_delete_elem(&active_spans, &s_key);
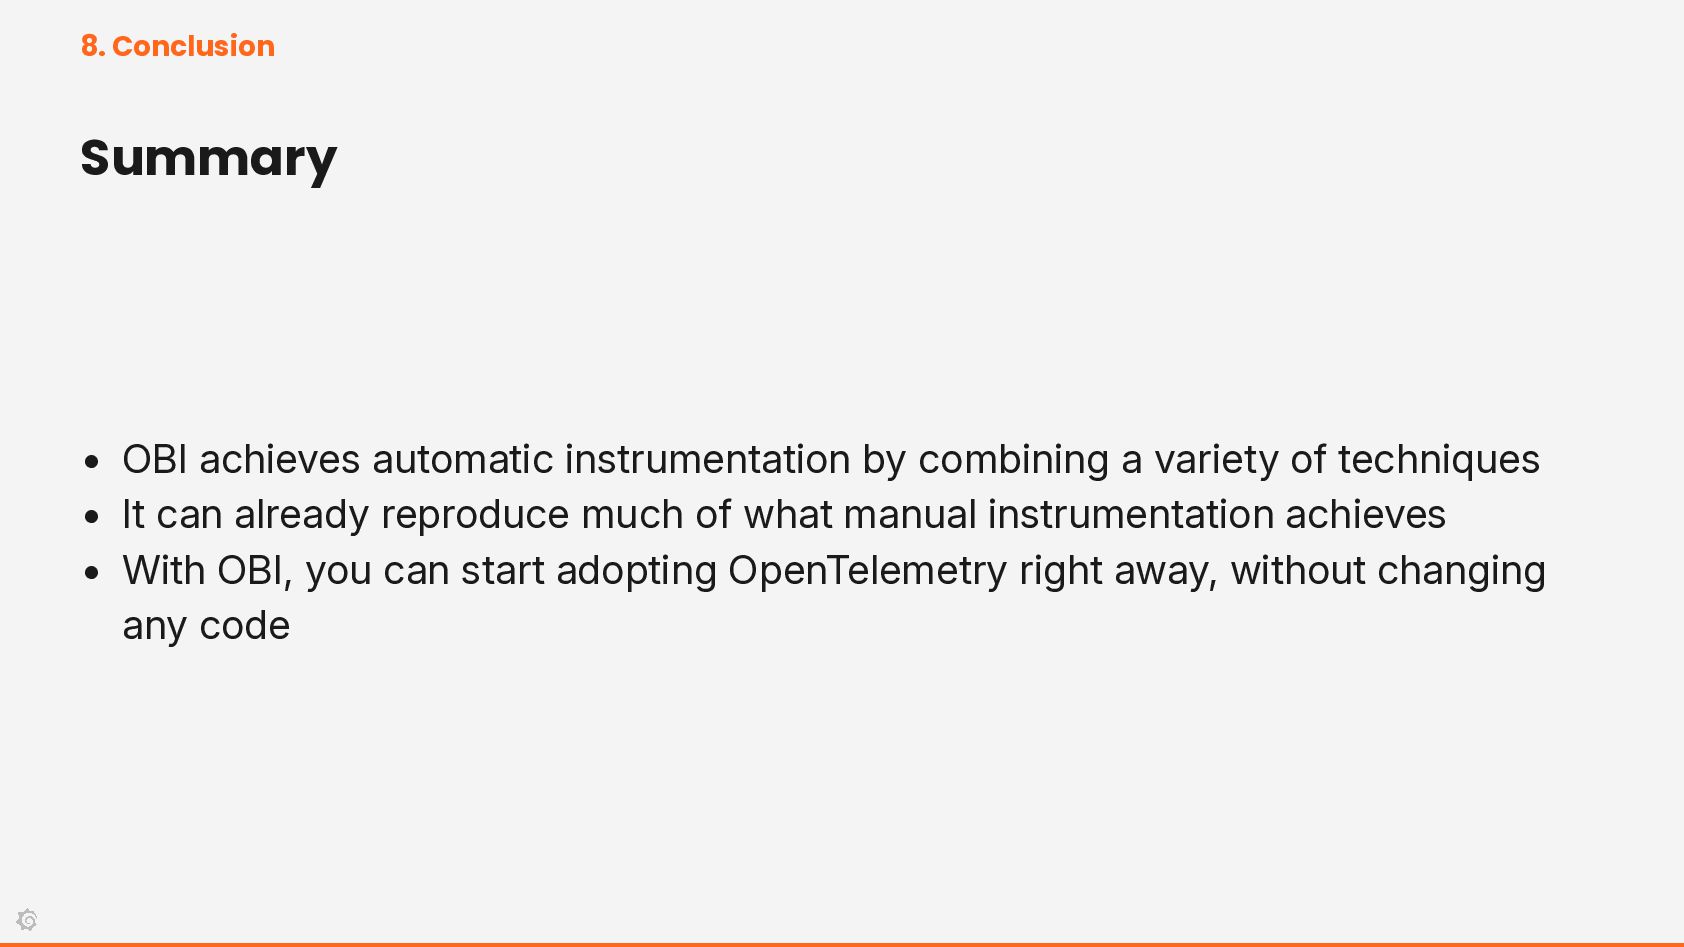
a variety of techniques • It can already reproduce much of what manual instrumentation achieves • With OBI, you can start adopting OpenTelemetry right away, without changing any code


 mtanda
 geshan
 oripsolob
 tammyeverts
 popppiees
 akademiya2063
 sergeychernyshev
 lynnandtonic
 bermonpainter
 rabernat
 gurzu
gurzu
 baasie