from a variety of sources, including business transactions, social media and information from sensor or machine-to-machine data. In the past, storing it would’ve been a problem – but new technologies (such as Hadoop) have eased the burden. • Velocity: Data streams in at an unprecedented speed and must be dealt with in a timely manner. RFID tags, sensors and smart metering are driving the need to deal with torrents of data in near-real time. • Variety: Data comes in all types of formats – from structured, numeric data in traditional databases to unstructured text documents, email, video, audio, stock ticker data and financial transactions.
may be analysed computationally to reveal patterns, trends, and associations, especially relating to human behaviour and interactions • Which data is “BIG”? • Google Services • Social Media • E-Commerce • Geo-location and many more…
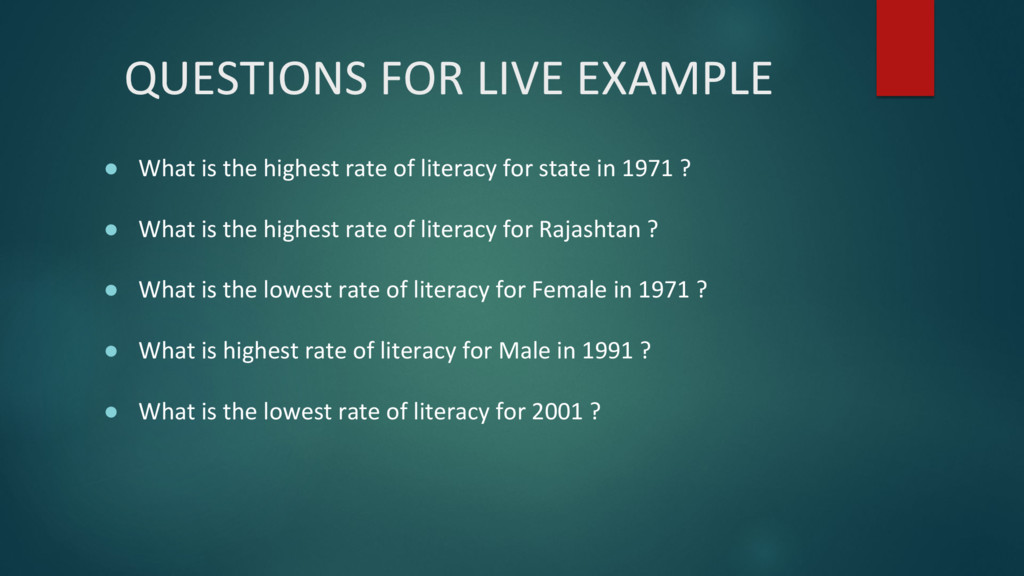
of literacy for state in 1971 ? • What is the highest rate of literacy for Rajashtan ? • What is the lowest rate of literacy for Female in 1971 ? • What is highest rate of literacy for Male in 1991 ? • What is the lowest rate of literacy for 2001 ?
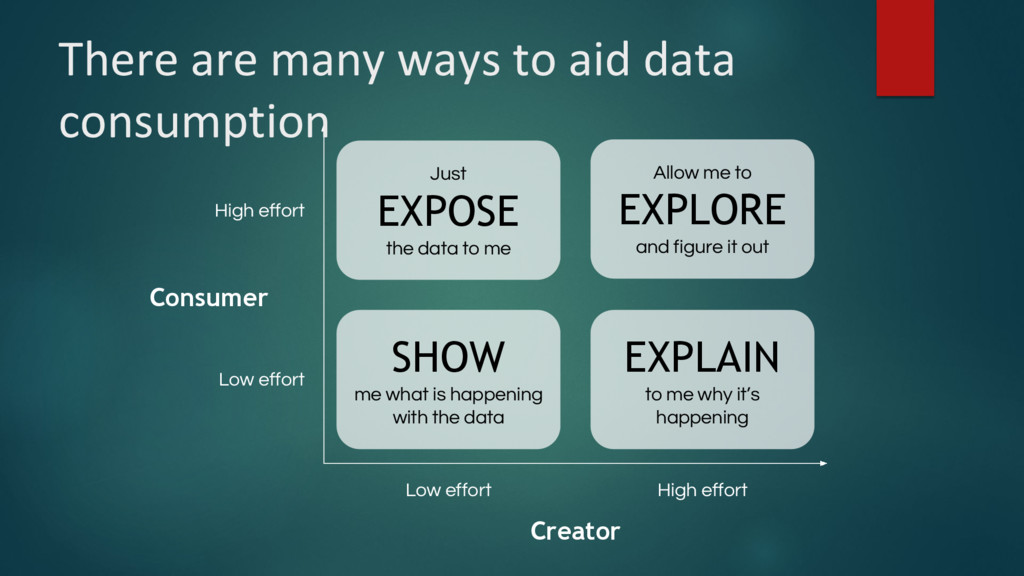
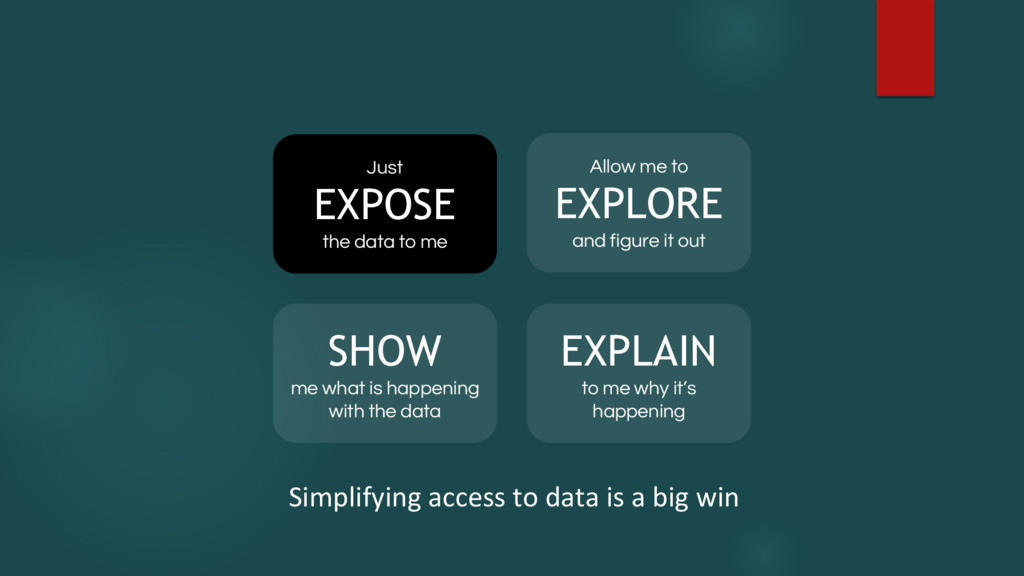
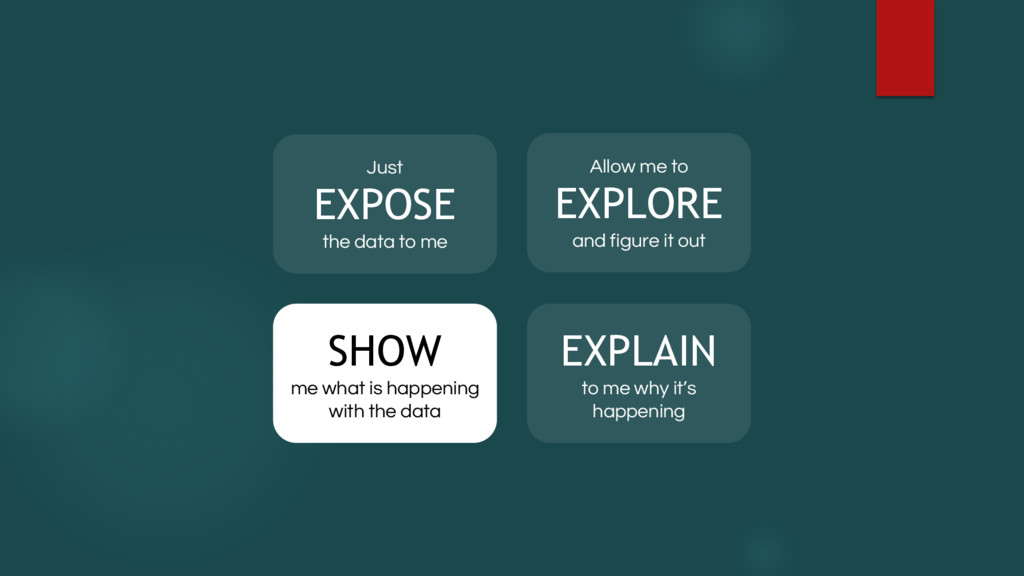
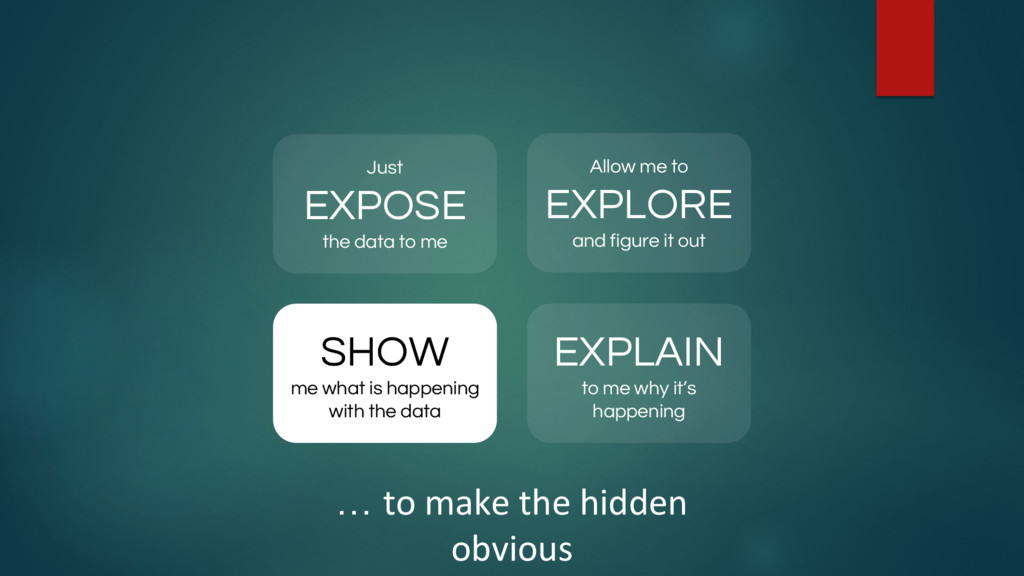
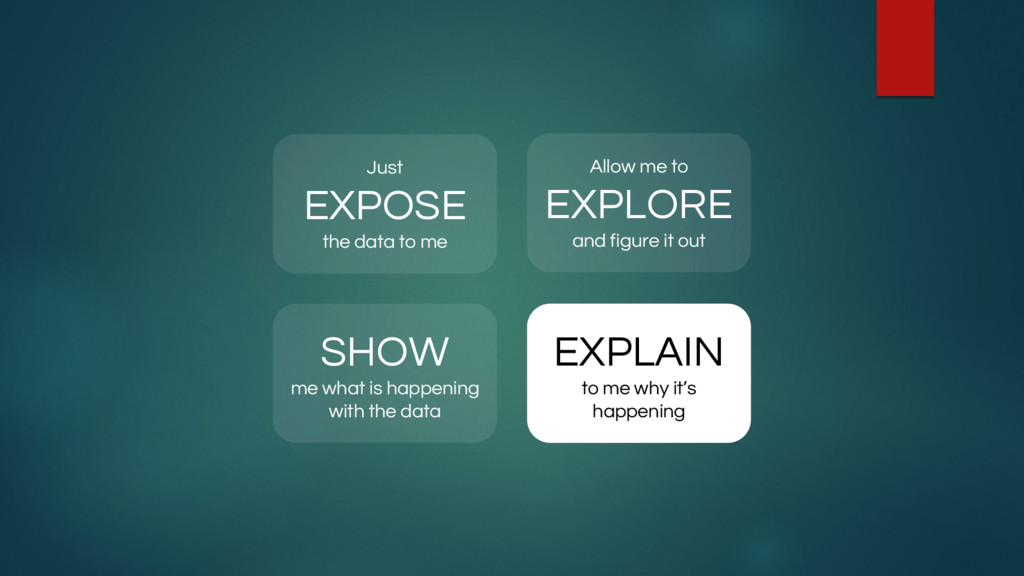
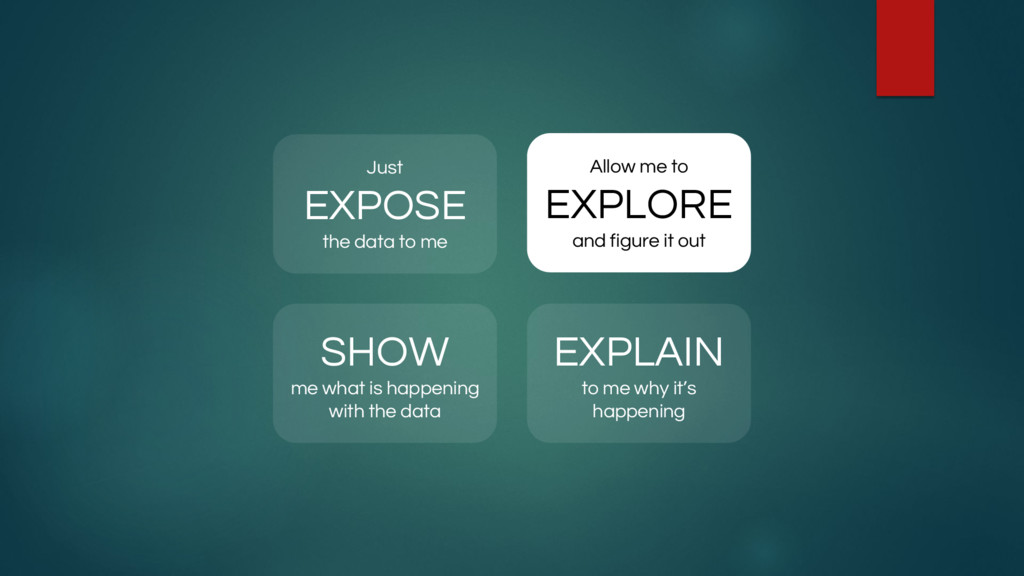
me why it’s happening Allow me to EXPLORE and figure it out Just EXPOSE the data to me Low effort High effort High effort Low effort Creator Consumer There are many ways to aid data consumption
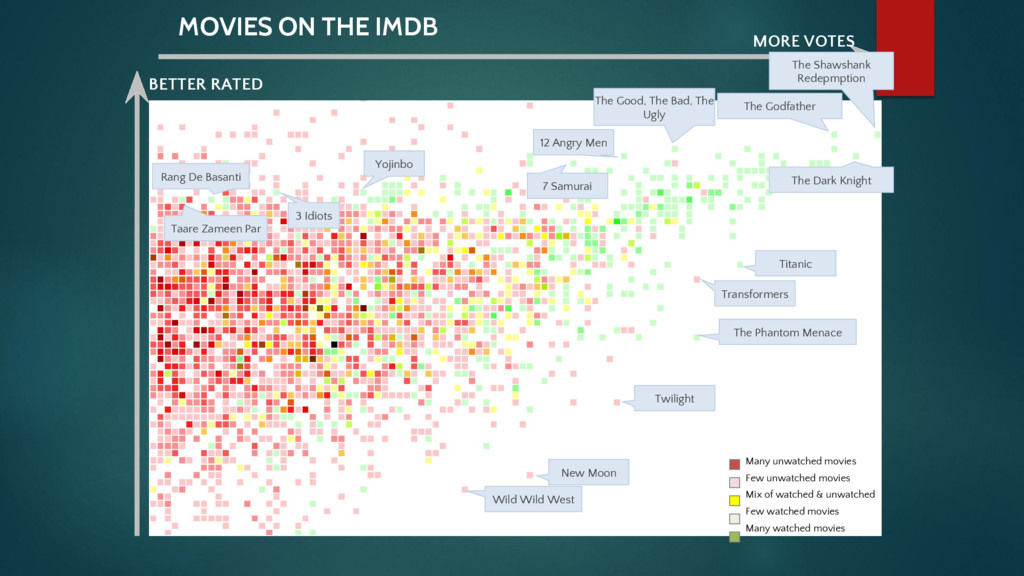
Phantom Menace Twilight New Moon Wild Wild West Transformers The Good, The Bad, The Ugly 12 Angry Men 7 Samurai Taare Zameen Par Rang De Basanti Yojinbo MORE VOTES BETTER RATED Many unwatched movies Few unwatched movies Mix of watched & unwatched Few watched movies Many watched movies MOVIES ON THE IMDB 3 Idiots
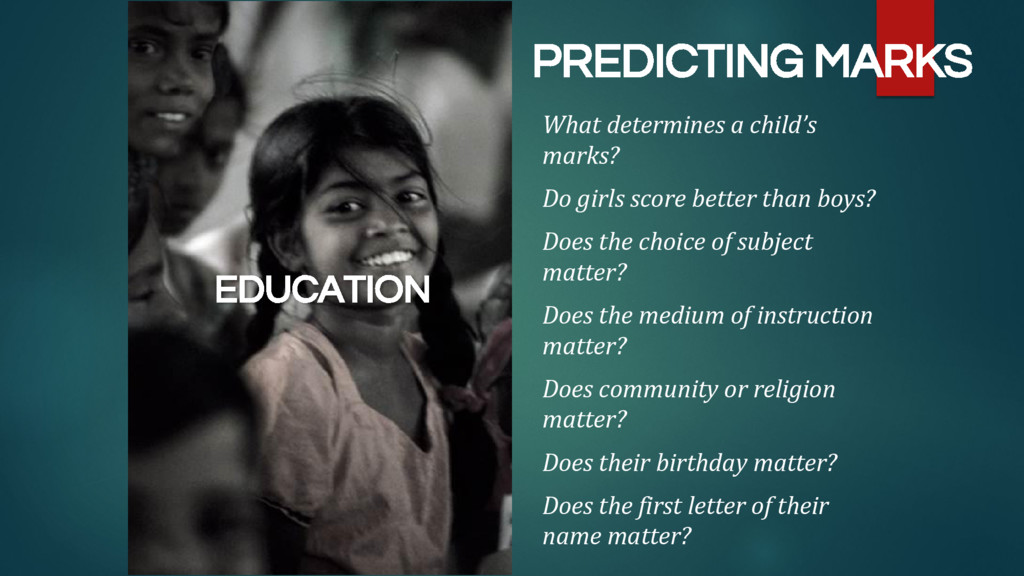
score better than boys? Does the choice of subject matter? Does the medium of instruction matter? Does community or religion matter? Does their birthday matter? Does the first letter of their name matter?
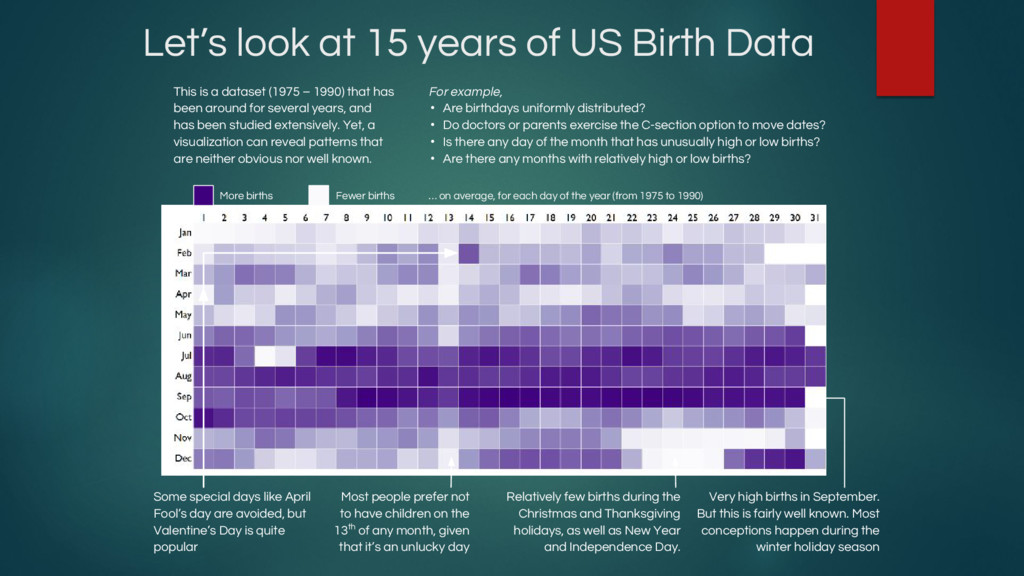
is a dataset (1975 – 1990) that has been around for several years, and has been studied extensively. Yet, a visualization can reveal patterns that are neither obvious nor well known. For example, • Are birthdays uniformly distributed? • Do doctors or parents exercise the C-section option to move dates? • Is there any day of the month that has unusually high or low births? • Are there any months with relatively high or low births? Very high births in September. But this is fairly well known. Most conceptions happen during the winter holiday season Relatively few births during the Christmas and Thanksgiving holidays, as well as New Year and Independence Day. Most people prefer not to have children on the 13th of any month, given that it’s an unlucky day Some special days like April Fool’s day are avoided, but Valentine’s Day is quite popular More births Fewer births … on average, for each day of the year (from 1975 to 1990)
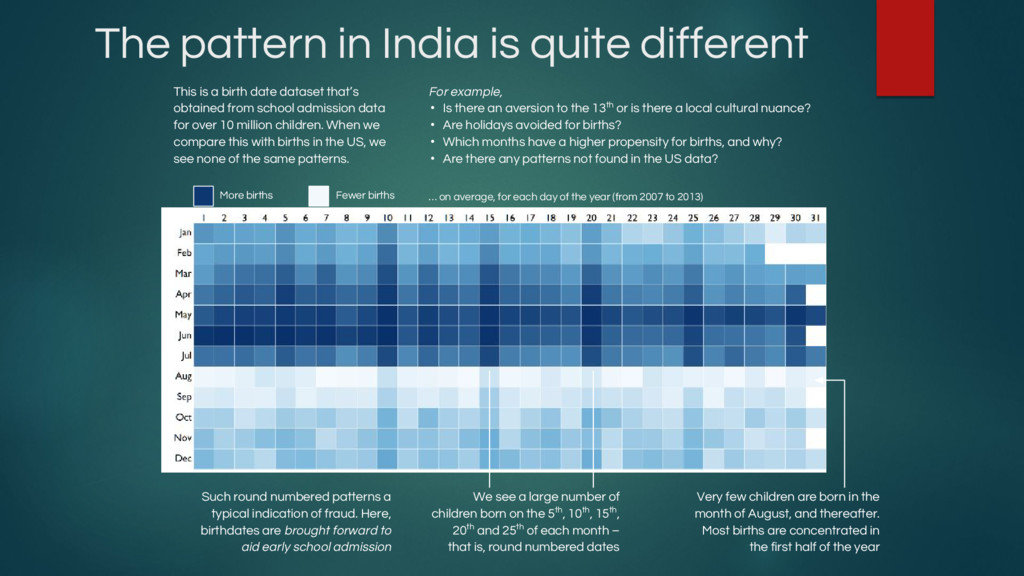
birth date dataset that’s obtained from school admission data for over 10 million children. When we compare this with births in the US, we see none of the same patterns. For example, • Is there an aversion to the 13th or is there a local cultural nuance? • Are holidays avoided for births? • Which months have a higher propensity for births, and why? • Are there any patterns not found in the US data? Very few children are born in the month of August, and thereafter. Most births are concentrated in the first half of the year We see a large number of children born on the 5th, 10th, 15th, 20th and 25th of each month – that is, round numbered dates Such round numbered patterns a typical indication of fraud. Here, birthdates are brought forward to aid early school admission More births Fewer births … on average, for each day of the year (from 2007 to 2013)
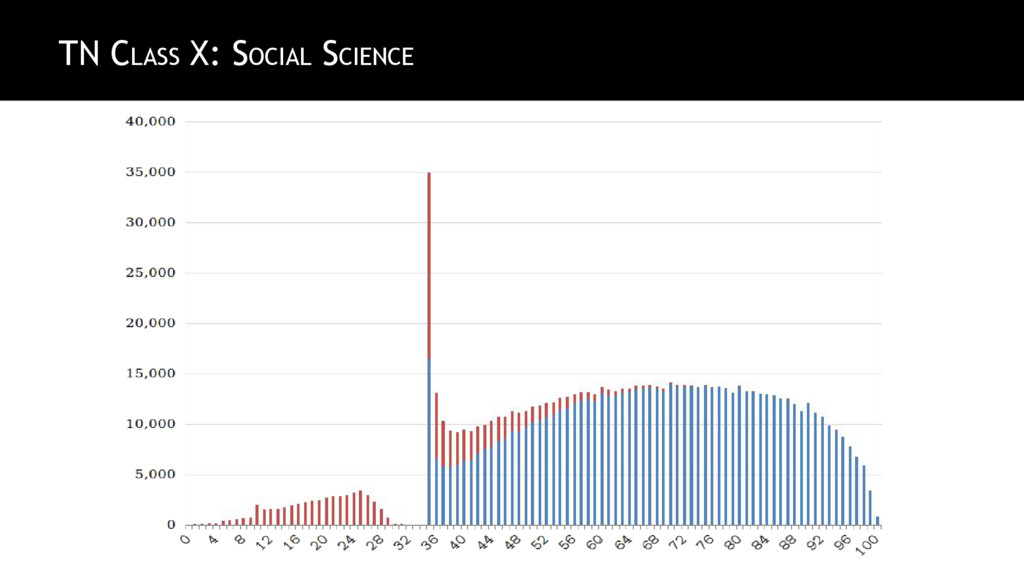
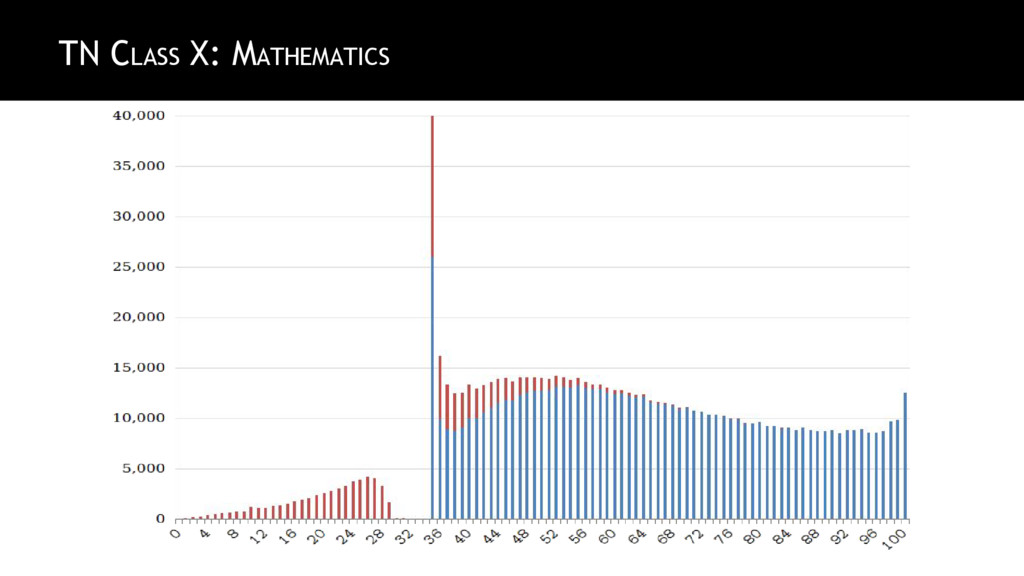
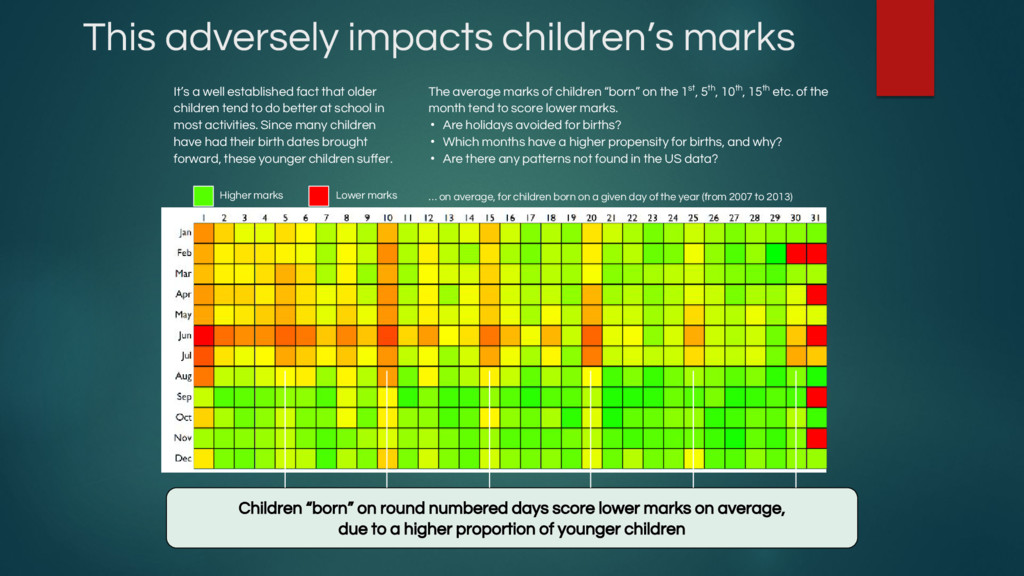
that older children tend to do better at school in most activities. Since many children have had their birth dates brought forward, these younger children suffer. The average marks of children “born” on the 1st, 5th, 10th, 15th etc. of the month tend to score lower marks. • Are holidays avoided for births? • Which months have a higher propensity for births, and why? • Are there any patterns not found in the US data? Higher marks Lower marks … on average, for children born on a given day of the year (from 2007 to 2013) Children “born” on round numbered days score lower marks on average, due to a higher proportion of younger children