Upgrade to Pro — share decks privately, control downloads, hide ads and more …

Alex Petrov - Eventoverse: near-realtime metric collection and processing

Alex Petrov - Eventoverse: near-realtime metric collection and processing

MunichDataGeeks

August 20, 2013
Tweet

More Decks by MunichDataGeeks

Other Decks in Technology

Transcript

  1. The situation has provided a cue; this cue has given

    the expert access to information stored in memory, and the information provides the answer. Intuition is nothing more and nothing less than recognition Friday, August 23, 13
  2. Valid intuitions develop when experts have learned to recognize familiar

    elements in a new situation and to act in a manner that is appropriate to it. Good intuitive judgments come to mind with the same immediacy as “doggie!” Friday, August 23, 13
  3. When faced with a difficult question, we often answer an

    easier one instead, usually without noticing the substitution. Seeing an easy pattern gives us an easy decision about more complex problems, intuitively. Friday, August 23, 13
  4. We easily think associatively, we think metaphorically, we think causally,

    but statistics requires thinking about many things at once, which is something that intuition is not designed to do Friday, August 23, 13
  5. • Easy to configure (ad-hoc vs post-hoc) • Very fast

    and easy access to recent events • Near real-time analytics and report generation • Easy to go back in time • Application growth doesn’t impact monitoring performance Expectations Friday, August 23, 13
  6. • Pipelining, an ability to inject additional processing unit •

    Arbitrary data format (use what you want) • Dumb client, implementable in minutes • Wide choice of transports • Direct access to the data • Data persistency Expectations Friday, August 23, 13
  7. • Backend is provided, front-end is customizable • Data format

    intended for graph visualization • Websockets, get stuff pushed out • Re-broadcast configuration • Moving parts, implementable interfaces for everything Expectations Friday, August 23, 13
  8. • Extensible alerting • Alerting channels (jabber, IRC, email) •

    Alerting rules • Persistency to the database of your choice • Pluggable processing backends • Self-declaring services (IService with start/stop/pause) Expectations Friday, August 23, 13
  9. reporter Processing unit Persistent Store State Machine Alerts Reduce Engine

    (ad-hoc queries and analytics) History Graphs Table Data Real-time graphs Real-time table data Latest Events (capped in-memory store) reporter reporter reporter reporter UDP, TCP, AMQP Console (nrepl, custom consumers, real-time analysis) Collector Collector Friday, August 23, 13
  10. • I like JSON, you like JSON • That guy

    likes Protocol Buffers • Another guy likes Thrift What do we do here? Collector Friday, August 23, 13
  11. • Collector listens to incoming connections • De-serializes them and

    pushes to downstream • Write your own collector, implement your own client and off you go • Choose transport of your preference, tune transport reliability • Leave space for backpressure (given your protocol is reliable) to have some flow control Collector Friday, August 23, 13
  12. • Thought experiment: pipelining vs black-box • Black box computes

    everything itself and returns an output • Pipelining uses several interchangeable processing units • 1 person for black-box • 3 people for pipelining Processing Unit Friday, August 23, 13
  13. • Black-box guy gets payload, holds 2 accumulators: count and

    sum of factorials of even and odd numbers separately • For pipeline • 1 person is a splitter • 2 people compute factorials • 2 people compute sums Processing Unit Friday, August 23, 13
  14. • Now, imagine we’re getting thousand requests per second •

    How to reuse black box code? It’s not pluggable • How to scale black box? Processing Unit Friday, August 23, 13
  15. • Define `emitter` • Emitter has many selectors, when selector

    matches, custom function is triggered Processing Unit Friday, August 23, 13
  16. • Filter - rebroadcasts ones for which `filter-fn` returns true

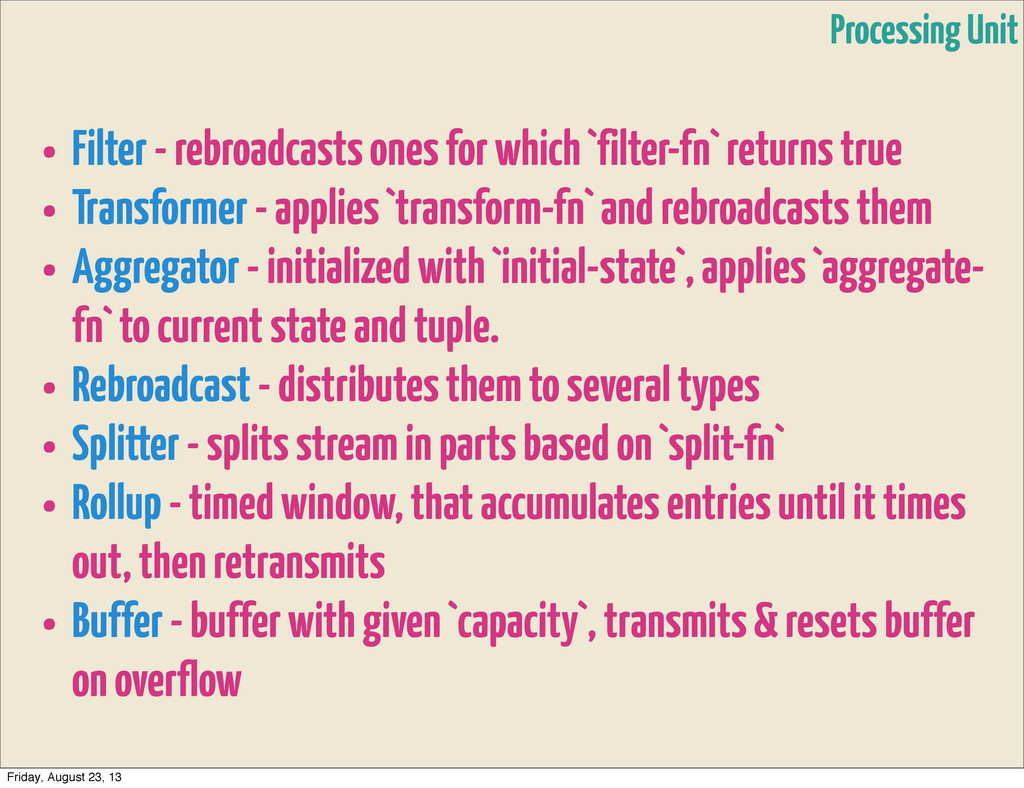
    • Transformer - applies `transform-fn` and rebroadcasts them • Aggregator - initialized with `initial-state`, applies `aggregate- fn` to current state and tuple. • Rebroadcast - distributes them to several types • Splitter - splits stream in parts based on `split-fn` • Rollup - timed window, that accumulates entries until it times out, then retransmits • Buffer - buffer with given `capacity`, transmits & resets buffer on overflow Processing Unit Friday, August 23, 13
  17. • Actually, all of them fit into two groups: •

    Stateful • Stateless • And have one of properties: • Get from one - dispatch to many • Get from many - dispatch to one • Predicate-based dispatch • No further dispatch Processing Unit Friday, August 23, 13
  18. • However smart and complex your data is, it narrows

    down to just 4 values (sometimes only one of them actually matters) • Event-type, key, value and timestamp • Event type is used for high-level partitioning • Key is used for visual and logical grouping • Value is used in all possible aggregates • Value may be simple or composite • Timestamp is used to figure out when the heck that thing actually happened Processing Unit Friday, August 23, 13
  19. Simple idea • Everything that’s coming in is an event

    • Events are split by triplet (application/env/event type) • Every event can have multiple metrics • Metric has a key and value • And filter • And several rollups • Rollup has an aggregate function triggered on overflow • And ring-buffer storing last N values • And visualization (area, line, barchart) attached Processing Unit Friday, August 23, 13
  20. • key is status_code, value is execution time, aggregate median

    execution time • key is user agent, value doesn’t matter, aggregate count Processing Unit Friday, August 23, 13
  21. • key is status_code, value doesn’t matter, aggregate count •

    key is status_code, value is execution_time, aggregate max Processing Unit Friday, August 23, 13
  22. • Once again, ad-hoc vs post-hoc processing • You can

    yield 10 different metrics from single payload, why split them to 10 different metrics on a client? • Moving responsibility from client to server makes everything way more flexible. Processing Unit Friday, August 23, 13
  23. • What to do when a single processing unit is

    not enough? • Scale at any preferred point • Add more collectors, make each collector listen to certain event type • If collection is not a bottleneck, use downstreams • Having a processing pipeline allows you to scatter at any point in time Processing Unit Friday, August 23, 13
  24. reporter Processing unit Persistent Store State Machine Alerts Reduce Engine

    (ad-hoc queries and analytics) History Graphs Table Data Real-time graphs Real-time table data Latest Events (capped in-memory store) reporter reporter reporter reporter UDP, TCP, AMQP Console (nrepl, custom consumers, real-time analysis) Collector Collector Friday, August 23, 13
  25. Everything you see here can be a single box, or

    even many boxes Friday, August 23, 13
  26. • Move persistent store to the separate box: configure downstream

    to pipe message through preferred client/ collector to the different machine • Really, anything can go to the separate machine • If it’s about processing part, you can split down even further Processing Unit Friday, August 23, 13
  27. • Use partition keys to keep metrics that should land

    on the same box to land on the same box • Partition key? Well, anything can be a partition key, in the end: part of the identification triplet, tag, or even metric value Processing Unit Friday, August 23, 13
  28. Searching for anomalies & statistics (let me guess, there’s no

    time for that one) Friday, August 23, 13
  29. • Given categorical entry, value and history, determining an anomaly

    is nothing complicated • Stateful stream processing opens up great ways to use • Local Outlier Factor algorithm • SVM (support vector machines) Anomalies Friday, August 23, 13
  30. • Majority of the widely-adopted tools do not support even

    basic statistical functions • Most of time, they provide an insight to most recent values, without giving you power to customize outputs • Go to Coursera, take a couple of Machine-Learning and Statstic courses • Discover that all that fancy math is actually easy to understand and provides amazing value Statistics Friday, August 23, 13
  31. • Use histograms and boxplots to make variances and distribution

    obvious • Detect trends in data, where are you going right now • Find correlations between different data points at same point in time Statistics Friday, August 23, 13
  32. Part 3: Alerting (let me guess, there’s no time for

    that one, either) Friday, August 23, 13
  33. • Most frustrating parts of most monitoring systems • Why

    can’t we figure out alerts? • Trends: something is changing • Ok, but we’ve seen that trend before • Silence the trend, increase threshold • Get false-negatives Alerting Friday, August 23, 13
  34. • Use more data • Remember previous alerts (silenced and

    true ones) • Don’t look for an out-of box solution, too many variables involved • Expect false-positives during system evolvement • Figure out what causes them • Don’t increase thresholds, introduce correlations instead • Time-based correlations • Variation and distribution • Correlation between seemingly independent values Alerting Friday, August 23, 13
  35. • Always show the data points graph was built from

    • When using interpolation, also use gap detection for sparse discrete data • Always put labels on axes • Always put horizontal and vertical rules along labels for recognition • Use box charts (also, stacked ones) when it’s important to visually compare quantities Visualization Friday, August 23, 13