Upgrade to Pro
— share decks privately, control downloads, hide ads and more …
Speaker Deck
Features
Speaker Deck
PRO
Sign in
Sign up for free
Search
Search
PowerQueryで統計表を使えるデータに!其の0
Search
NaoyaShimizu
June 04, 2021
Technology
0
93
PowerQueryで統計表を使えるデータに!其の0
データ利活用はまずExcel内で使えるデータにするところから
NaoyaShimizu
June 04, 2021
Tweet
Share
More Decks by NaoyaShimizu
See All by NaoyaShimizu
NYC Open Data for All 2020 Report ニューヨーク市オープンデータ レポート日本語訳
naoyashimizzz
0
910
Other Decks in Technology
See All in Technology
The essence of decision-making lies in primary data
kaminashi
0
110
FASTでAIエージェントを作りまくろう!
yukiogawa
4
110
Phase09_自動化_仕組み化
overflowinc
0
1.8k
Embeddings : Symfony AI en pratique
lyrixx
0
350
Phase06_ClaudeCode実践
overflowinc
0
2.2k
Amazon Qはアマコネで頑張っています〜 Amazon Q in Connectについて〜
yama3133
1
140
AI時代のIssue駆動開発のススメ
moongift
PRO
0
270
スピンアウト講座03_CLAUDE-MDとSKILL-MD
overflowinc
0
1.4k
FlutterでPiP再生を実装した話
s9a17
0
200
データマネジメント戦略Night - 4社のリアルを語る会
ktatsuya
1
380
韓非子に学ぶAI活用術
tomfook
3
1k
FastMCP OAuth Proxy with Cognito
hironobuiga
3
210
Featured
See All Featured
Claude Code どこまでも/ Claude Code Everywhere
nwiizo
64
54k
Ethics towards AI in product and experience design
skipperchong
2
240
Docker and Python
trallard
47
3.8k
How to build a perfect <img>
jonoalderson
1
5.3k
DBのスキルで生き残る技術 - AI時代におけるテーブル設計の勘所
soudai
PRO
64
52k
Raft: Consensus for Rubyists
vanstee
141
7.4k
Building an army of robots
kneath
306
46k
Understanding Cognitive Biases in Performance Measurement
bluesmoon
32
2.8k
Principles of Awesome APIs and How to Build Them.
keavy
128
17k
RailsConf & Balkan Ruby 2019: The Past, Present, and Future of Rails at GitHub
eileencodes
141
35k
30 Presentation Tips
portentint
PRO
1
260
Designing for humans not robots
tammielis
254
26k
Transcript
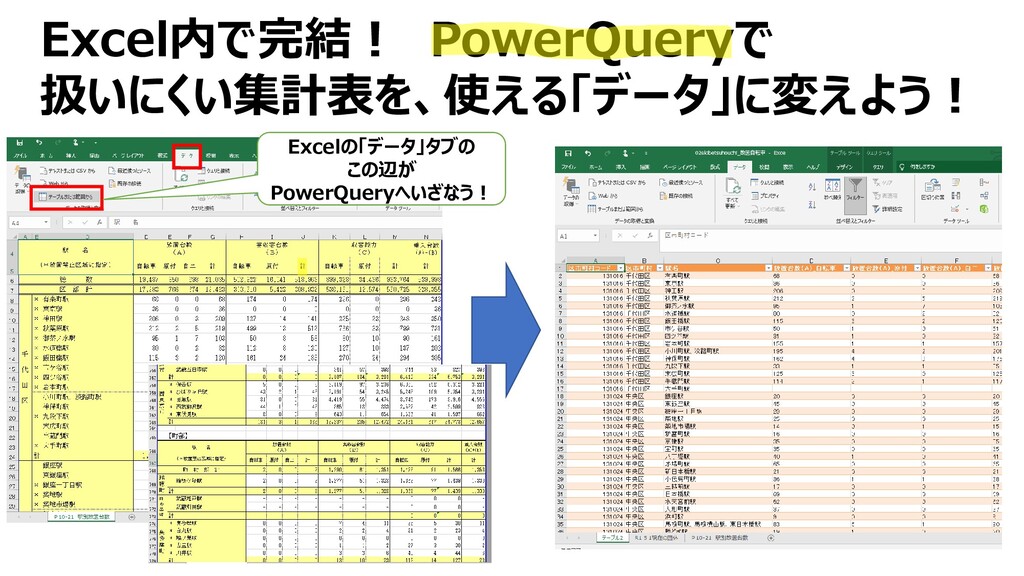
Excel内で完結! PowerQueryで 扱いにくい集計表を、使える「データ」に変えよう! Excelの「データ」タブの この辺が PowerQueryへいざなう!
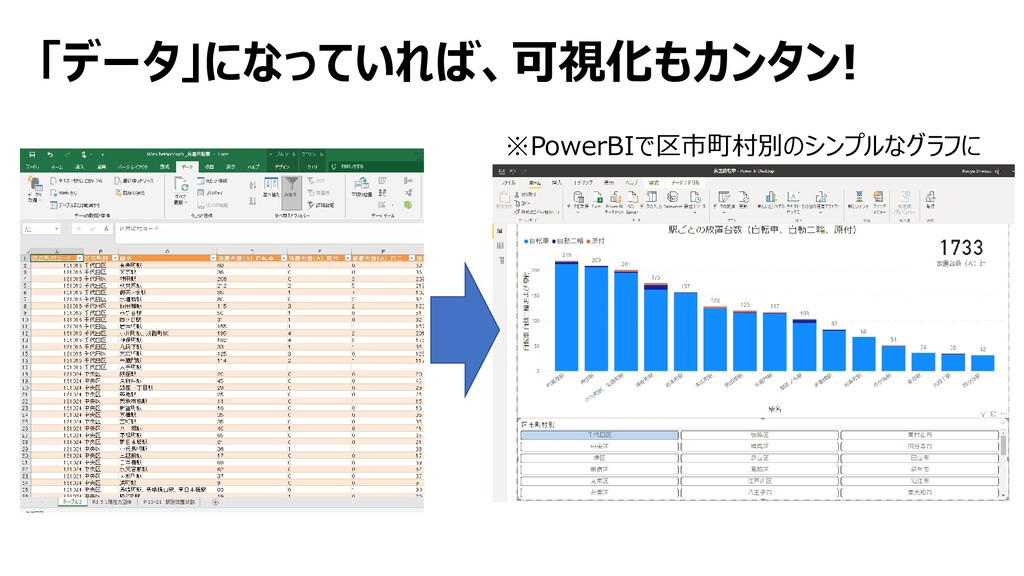
「データ」になっていれば、可視化もカンタン! ※PowerBIで区市町村別のシンプルなグラフに