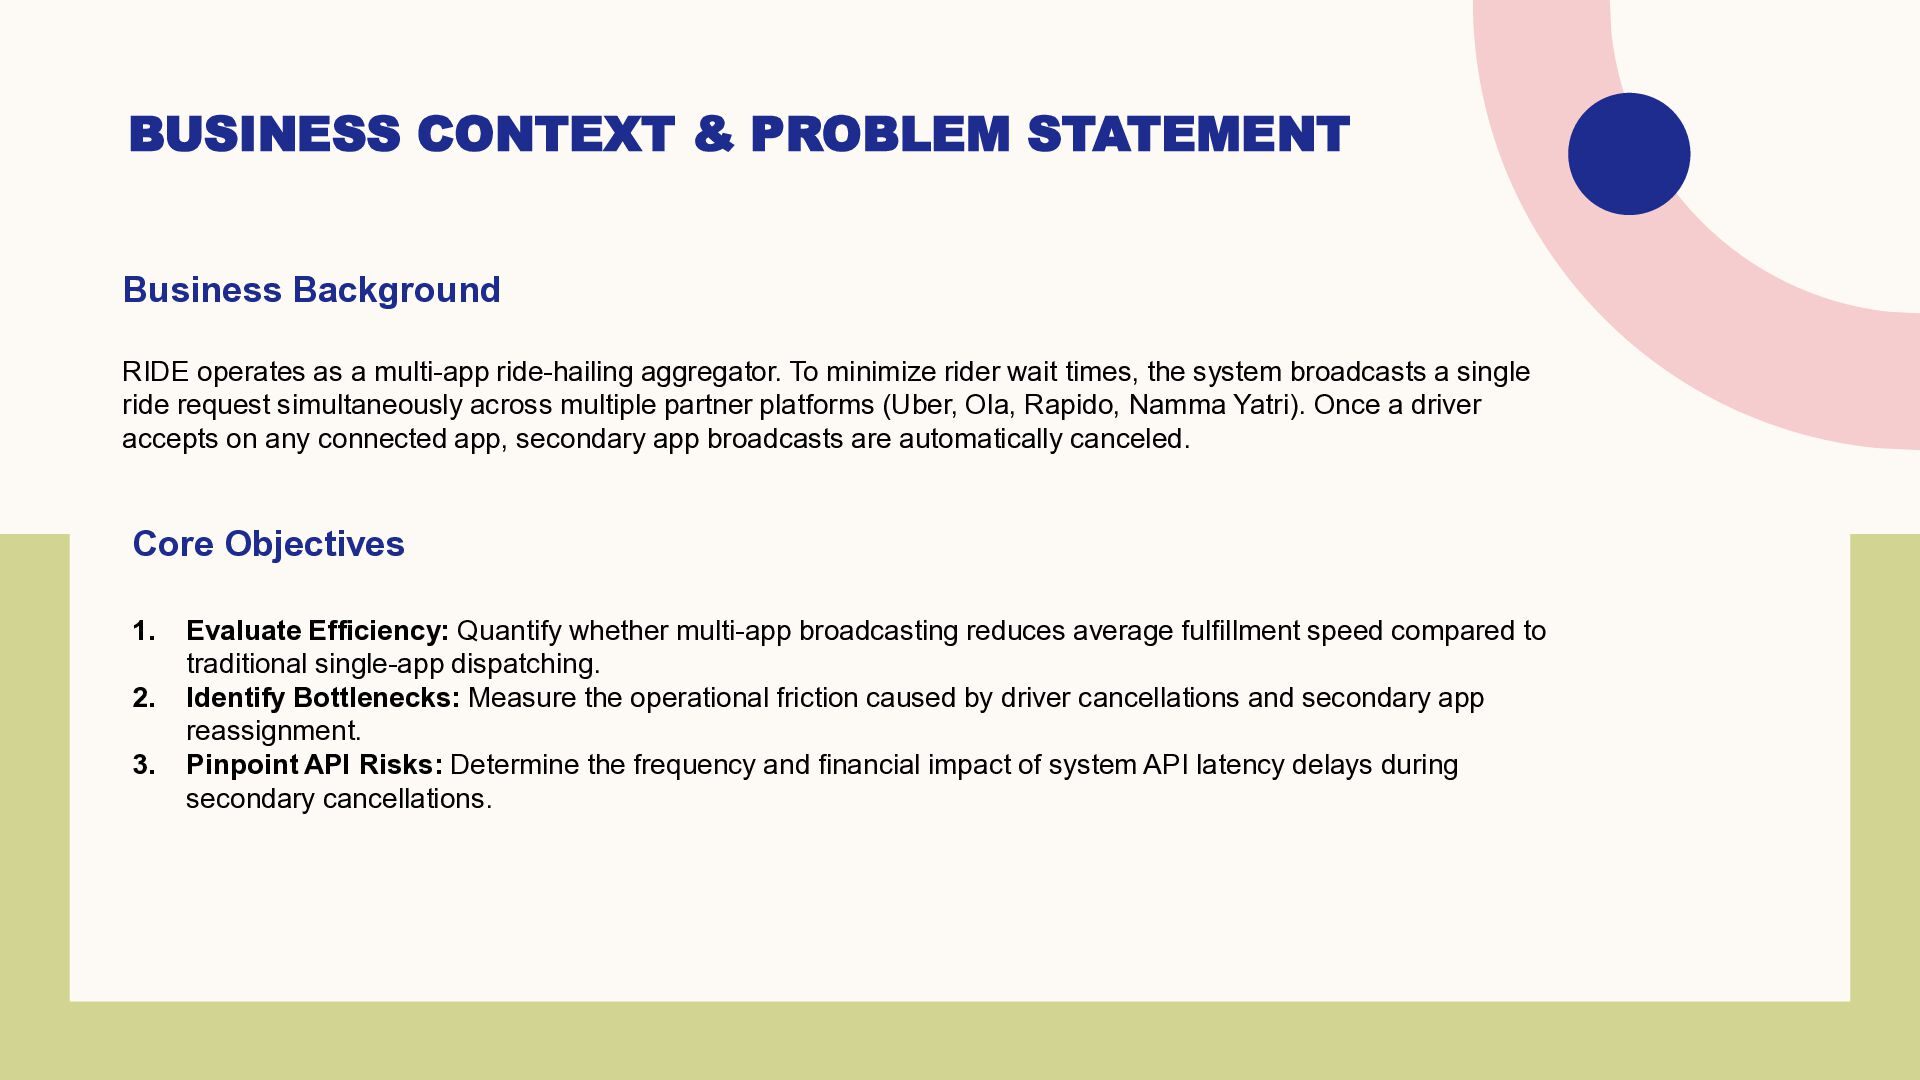
a multi-app ride-hailing aggregator. To minimize rider wait times, the system broadcasts a single ride request simultaneously across multiple partner platforms (Uber, Ola, Rapido, Namma Yatri). Once a driver accepts on any connected app, secondary app broadcasts are automatically canceled. Core Objectives 1. 2. 3. Evaluate Efficiency: Quantify whether multi-app broadcasting reduces average fulfillment speed compared to traditional single-app dispatching. Identify Bottlenecks: Measure the operational friction caused by driver cancellations and secondary app reassignment. Pinpoint API Risks: Determine the frequency and financial impact of system API latency delays during secondary cancellations.
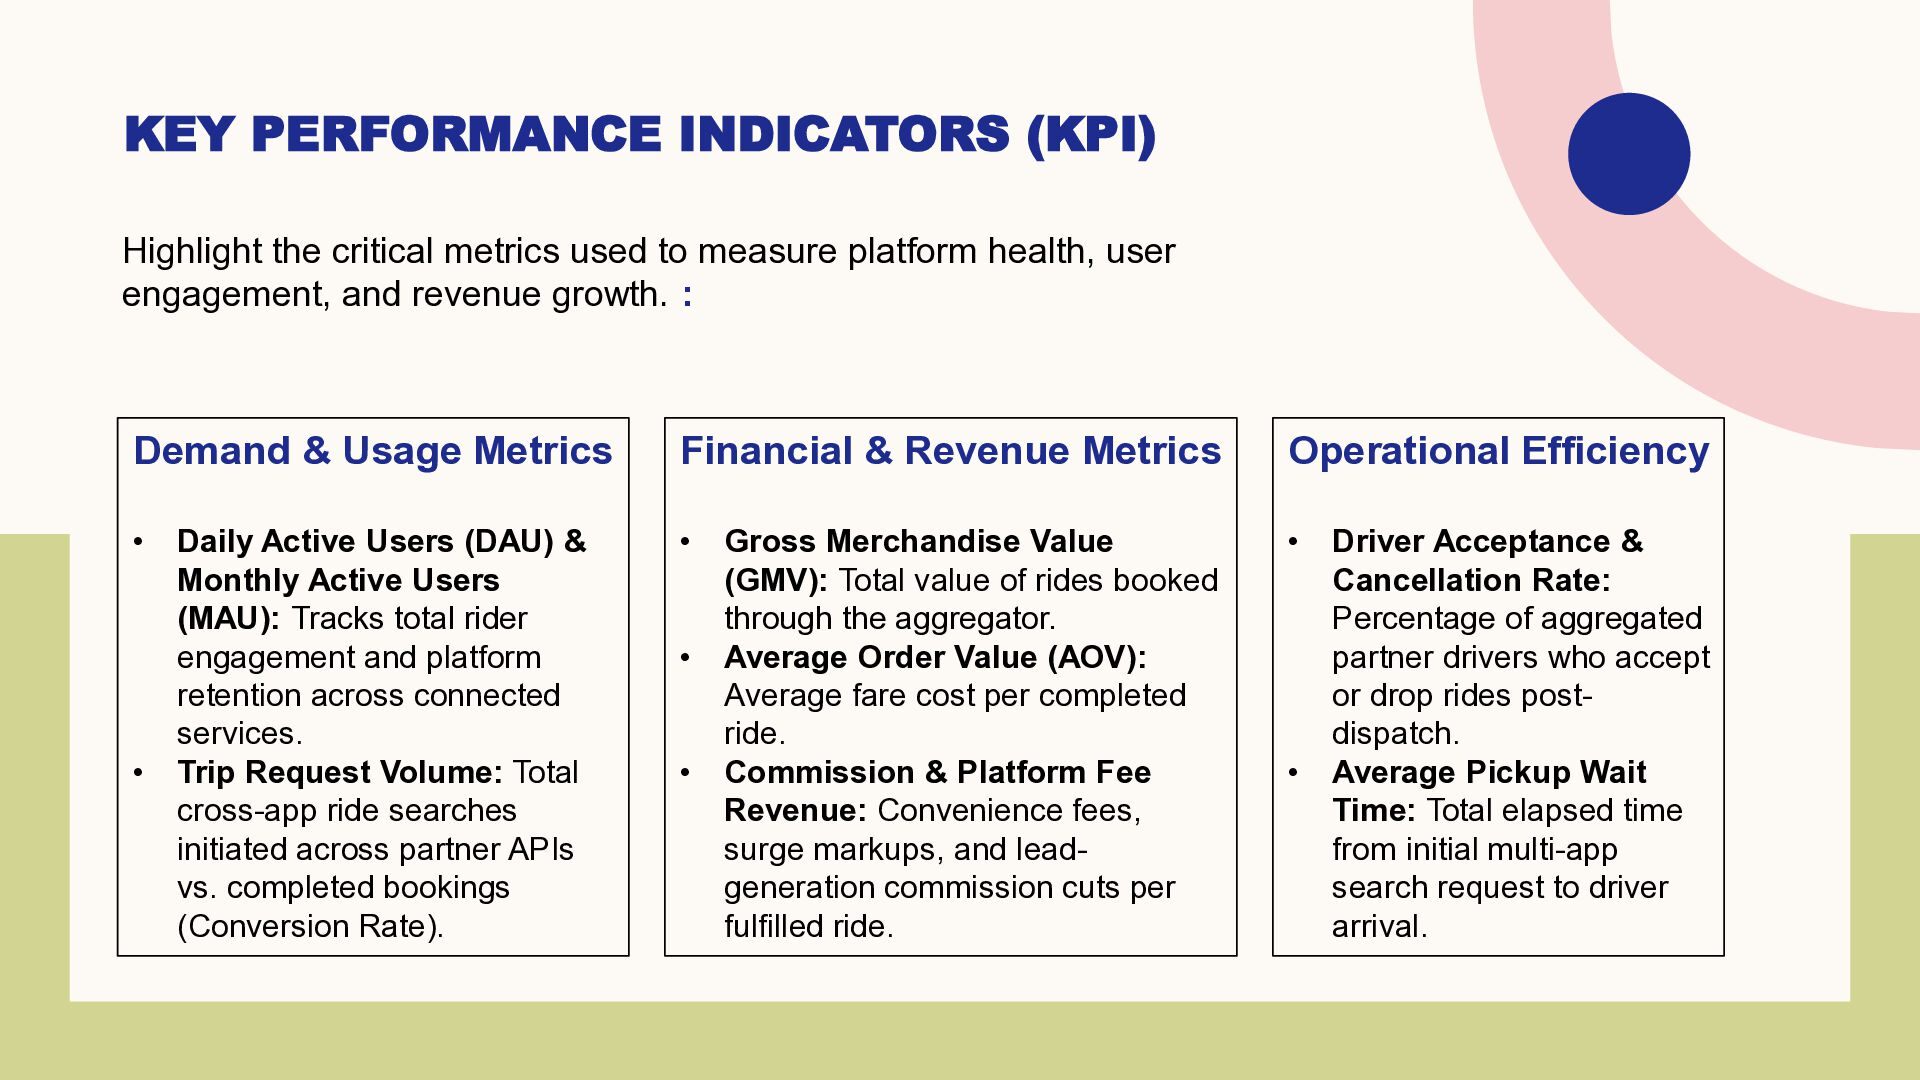
measure platform health, user engagement, and revenue growth. : Demand & Usage Metrics Financial & Revenue Metrics Operational Efficiency • • • • Daily Active Users (DAU) & Monthly Active Users (MAU): Tracks total rider engagement and platform retention across connected services. Trip Request Volume: Total cross-app ride searches initiated across partner APIs vs. completed bookings (Conversion Rate). • • Gross Merchandise Value (GMV): Total value of rides booked through the aggregator. Average Order Value (AOV): Average fare cost per completed ride. Commission & Platform Fee Revenue: Convenience fees, surge markups, and leadgeneration commission cuts per fulfilled ride. • Driver Acceptance & Cancellation Rate: Percentage of aggregated partner drivers who accept or drop rides postdispatch. Average Pickup Wait Time: Total elapsed time from initial multi-app search request to driver arrival.
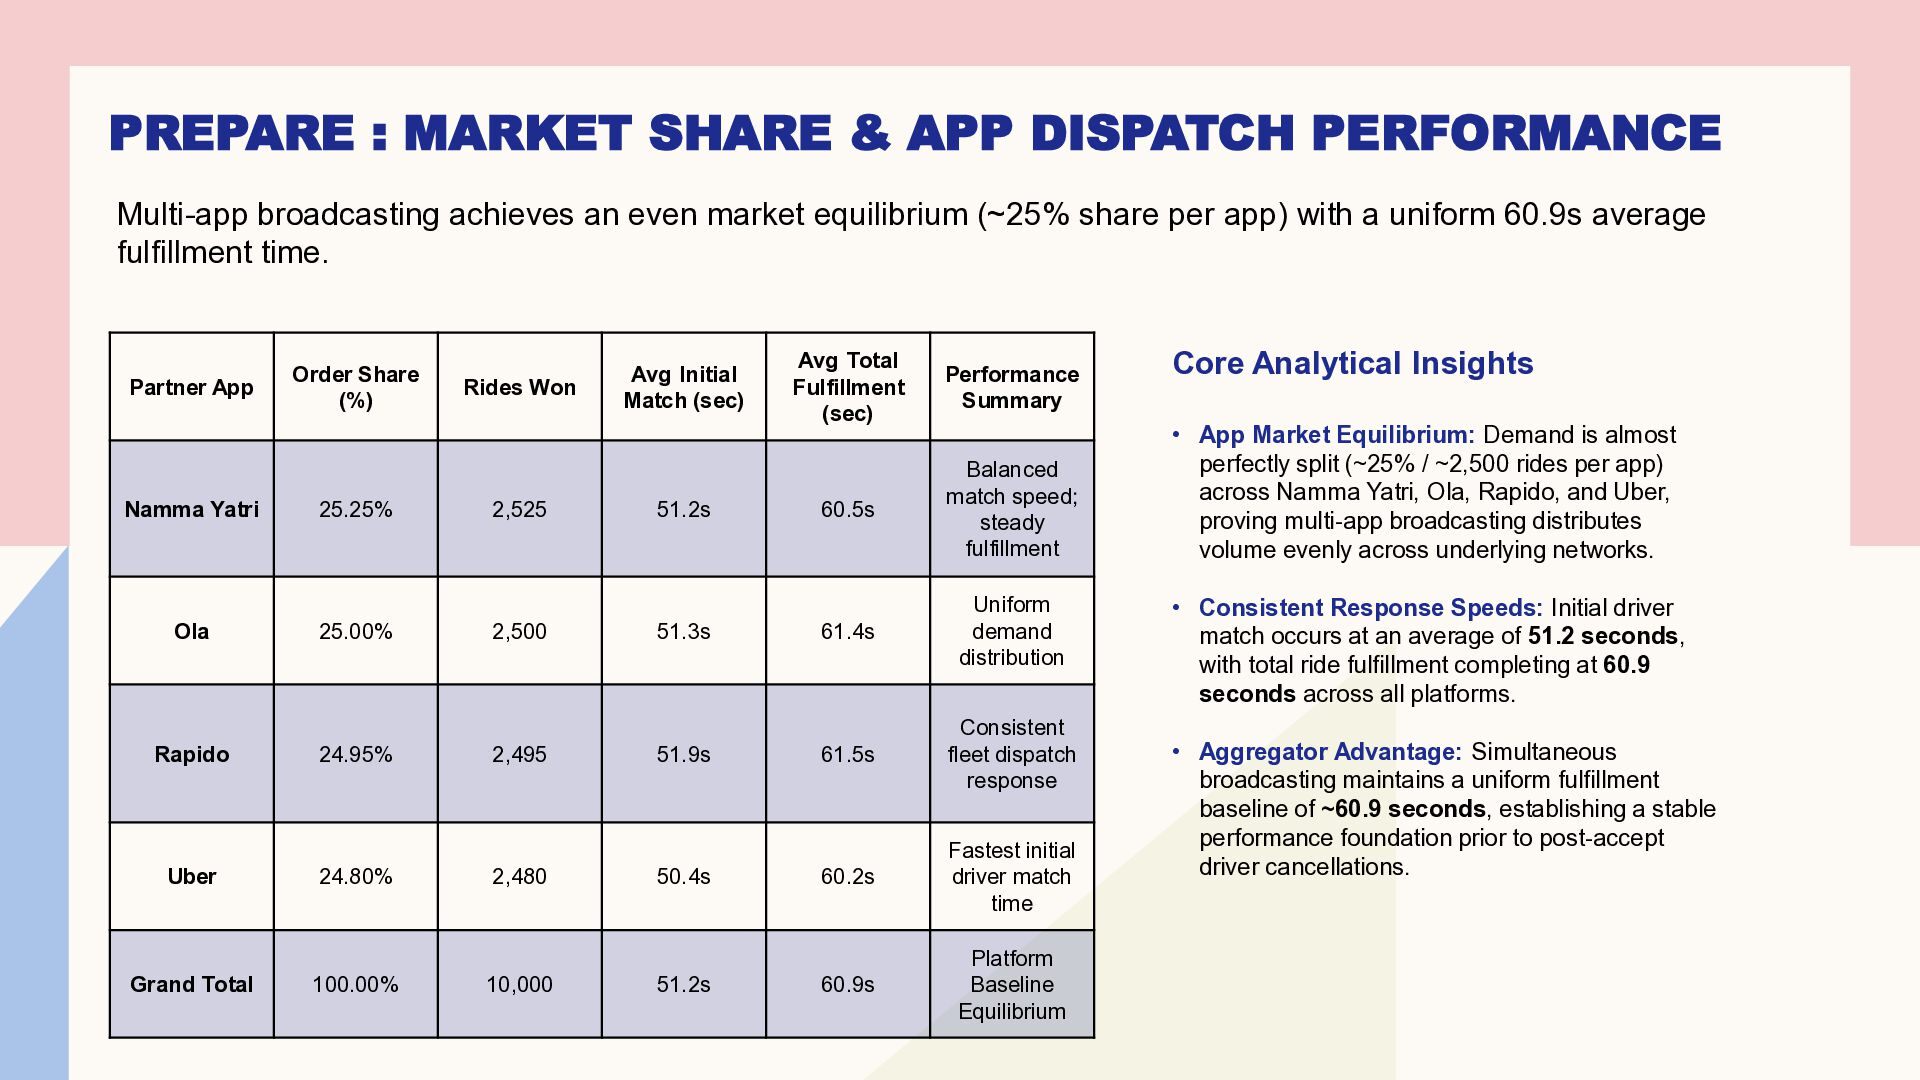
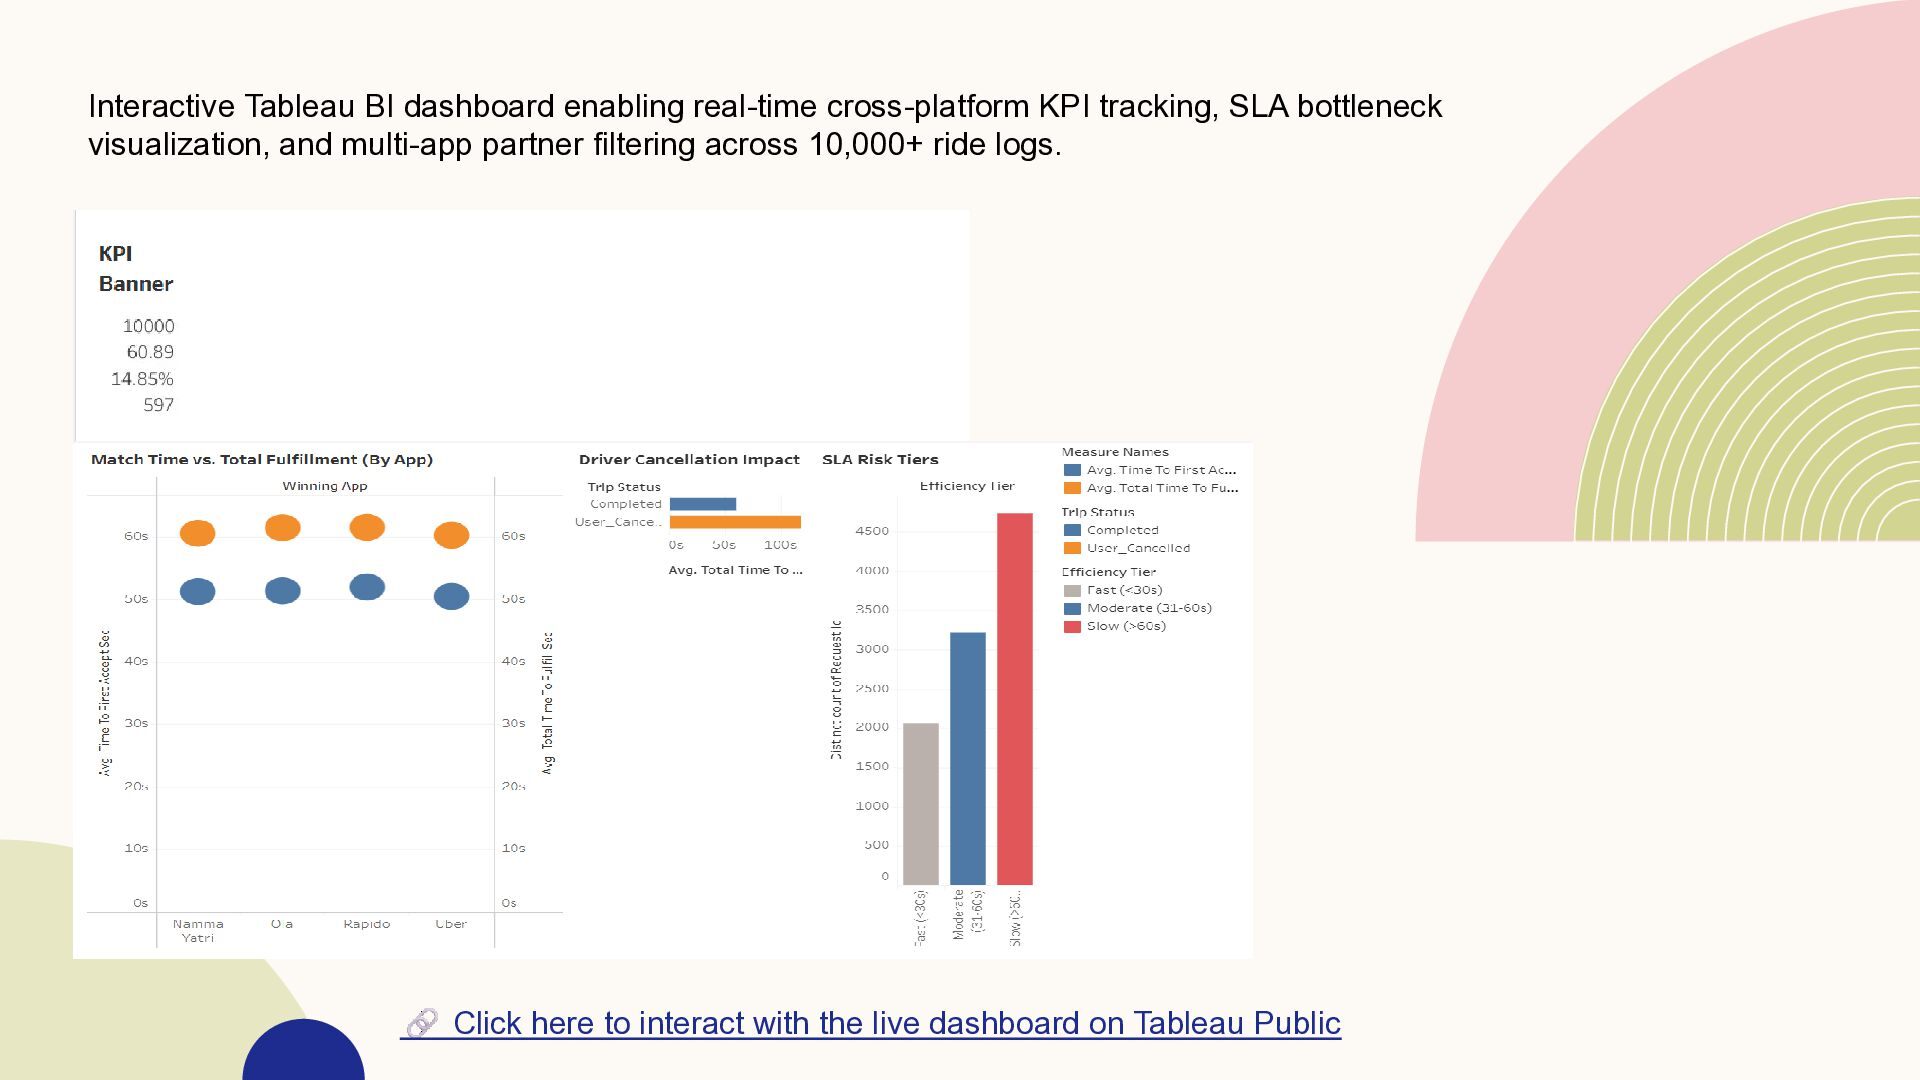
achieves an even market equilibrium (~25% share per app) with a uniform 60.9s average fulfillment time. Partner App Order Share (%) Rides Won Avg Initial Match (sec) Avg Total Fulfillment (sec) Performance Summary Namma Yatri 25.25% 2,525 51.2s 60.5s Balanced match speed; steady fulfillment Ola 25.00% 2,500 51.3s 61.4s Uniform demand distribution Rapido 24.95% 2,495 51.9s 61.5s Consistent fleet dispatch response Uber 24.80% 2,480 50.4s 60.2s Fastest initial driver match time 60.9s Platform Baseline Equilibrium Grand Total 100.00% 10,000 51.2s Core Analytical Insights • App Market Equilibrium: Demand is almost perfectly split (~25% / ~2,500 rides per app) across Namma Yatri, Ola, Rapido, and Uber, proving multi-app broadcasting distributes volume evenly across underlying networks. • Consistent Response Speeds: Initial driver match occurs at an average of 51.2 seconds, with total ride fulfillment completing at 60.9 seconds across all platforms. • Aggregator Advantage: Simultaneous broadcasting maintains a uniform fulfillment baseline of ~60.9 seconds, establishing a stable performance foundation prior to post-accept driver cancellations.
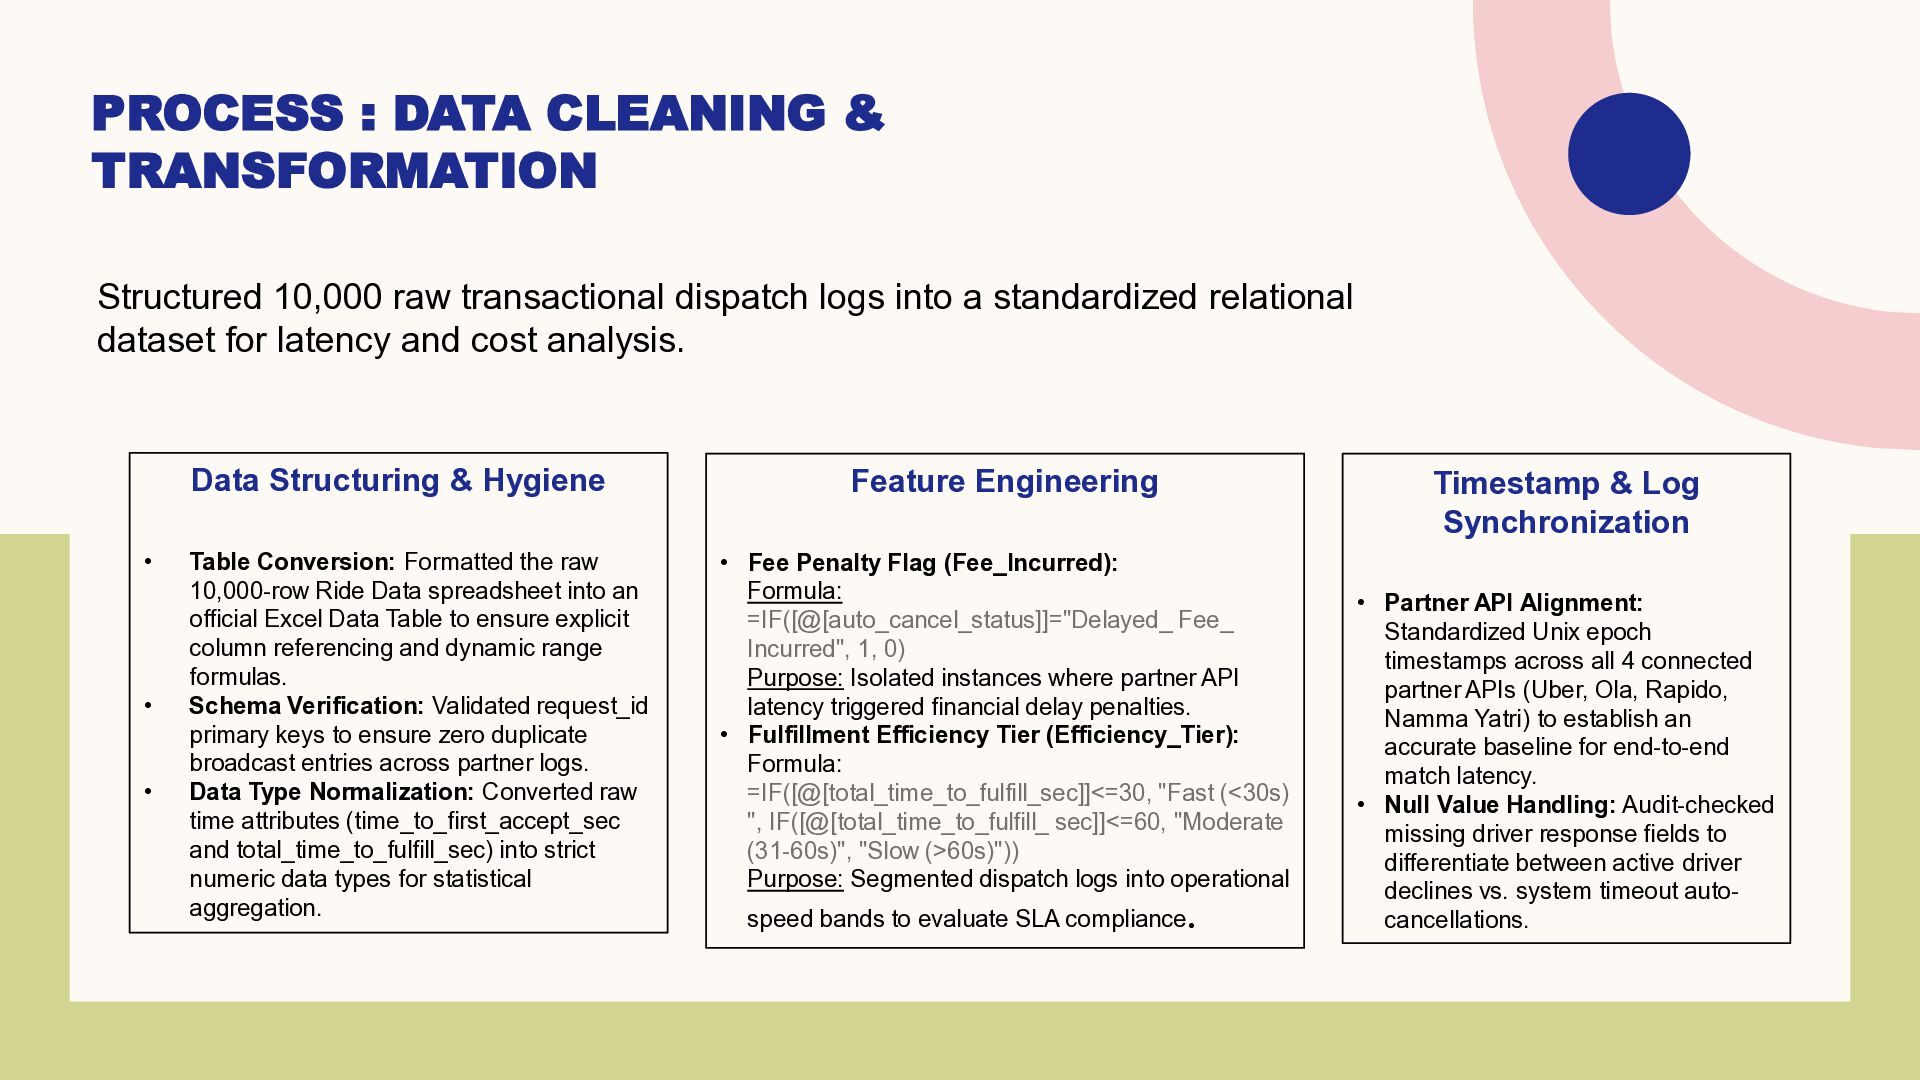
dispatch logs into a standardized relational dataset for latency and cost analysis. Data Structuring & Hygiene • • • Table Conversion: Formatted the raw 10,000-row Ride Data spreadsheet into an official Excel Data Table to ensure explicit column referencing and dynamic range formulas. Schema Verification: Validated request_id primary keys to ensure zero duplicate broadcast entries across partner logs. Data Type Normalization: Converted raw time attributes (time_to_first_accept_sec and total_time_to_fulfill_sec) into strict numeric data types for statistical aggregation. Feature Engineering • Fee Penalty Flag (Fee_Incurred): Formula: =IF([@[auto_cancel_status]]="Delayed_ Fee_ Incurred", 1, 0) Purpose: Isolated instances where partner API latency triggered financial delay penalties. • Fulfillment Efficiency Tier (Efficiency_Tier): Formula: =IF([@[total_time_to_fulfill_sec]]<=30, "Fast (<30s) ", IF([@[total_time_to_fulfill_ sec]]<=60, "Moderate (31-60s)", "Slow (>60s)")) Purpose: Segmented dispatch logs into operational speed bands to evaluate SLA compliance. Timestamp & Log Synchronization • Partner API Alignment: Standardized Unix epoch timestamps across all 4 connected partner APIs (Uber, Ola, Rapido, Namma Yatri) to establish an accurate baseline for end-to-end match latency. • Null Value Handling: Audit-checked missing driver response fields to differentiate between active driver declines vs. system timeout autocancellations.
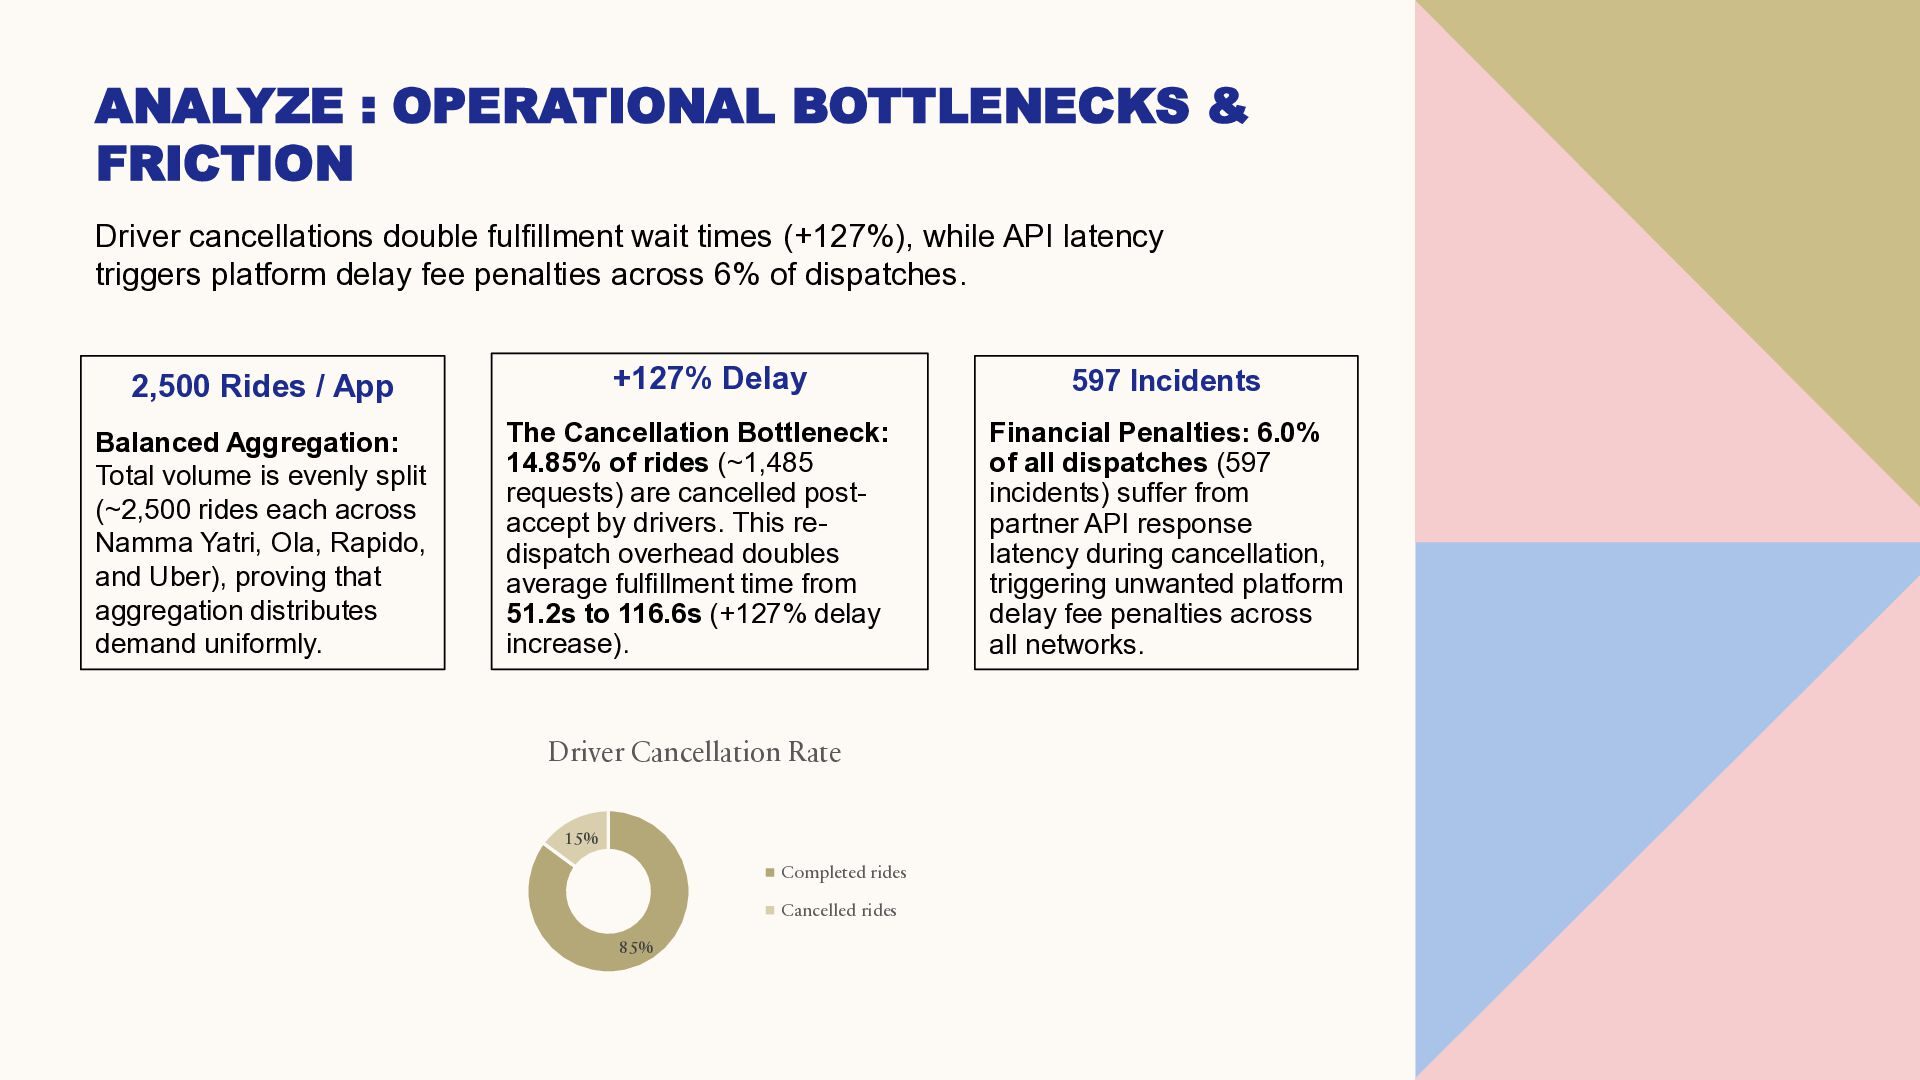
wait times (+127%), while API latency triggers platform delay fee penalties across 6% of dispatches. 2,500 Rides / App +127% Delay 597 Incidents Balanced Aggregation: Total volume is evenly split (~2,500 rides each across Namma Yatri, Ola, Rapido, and Uber), proving that aggregation distributes demand uniformly. The Cancellation Bottleneck: 14.85% of rides (~1,485 requests) are cancelled postaccept by drivers. This redispatch overhead doubles average fulfillment time from 51.2s to 116.6s (+127% delay increase). Financial Penalties: 6.0% of all dispatches (597 incidents) suffer from partner API response latency during cancellation, triggering unwanted platform delay fee penalties across all networks. Driver Cancellation Rate 15% Completed rides Cancelled rides 85%
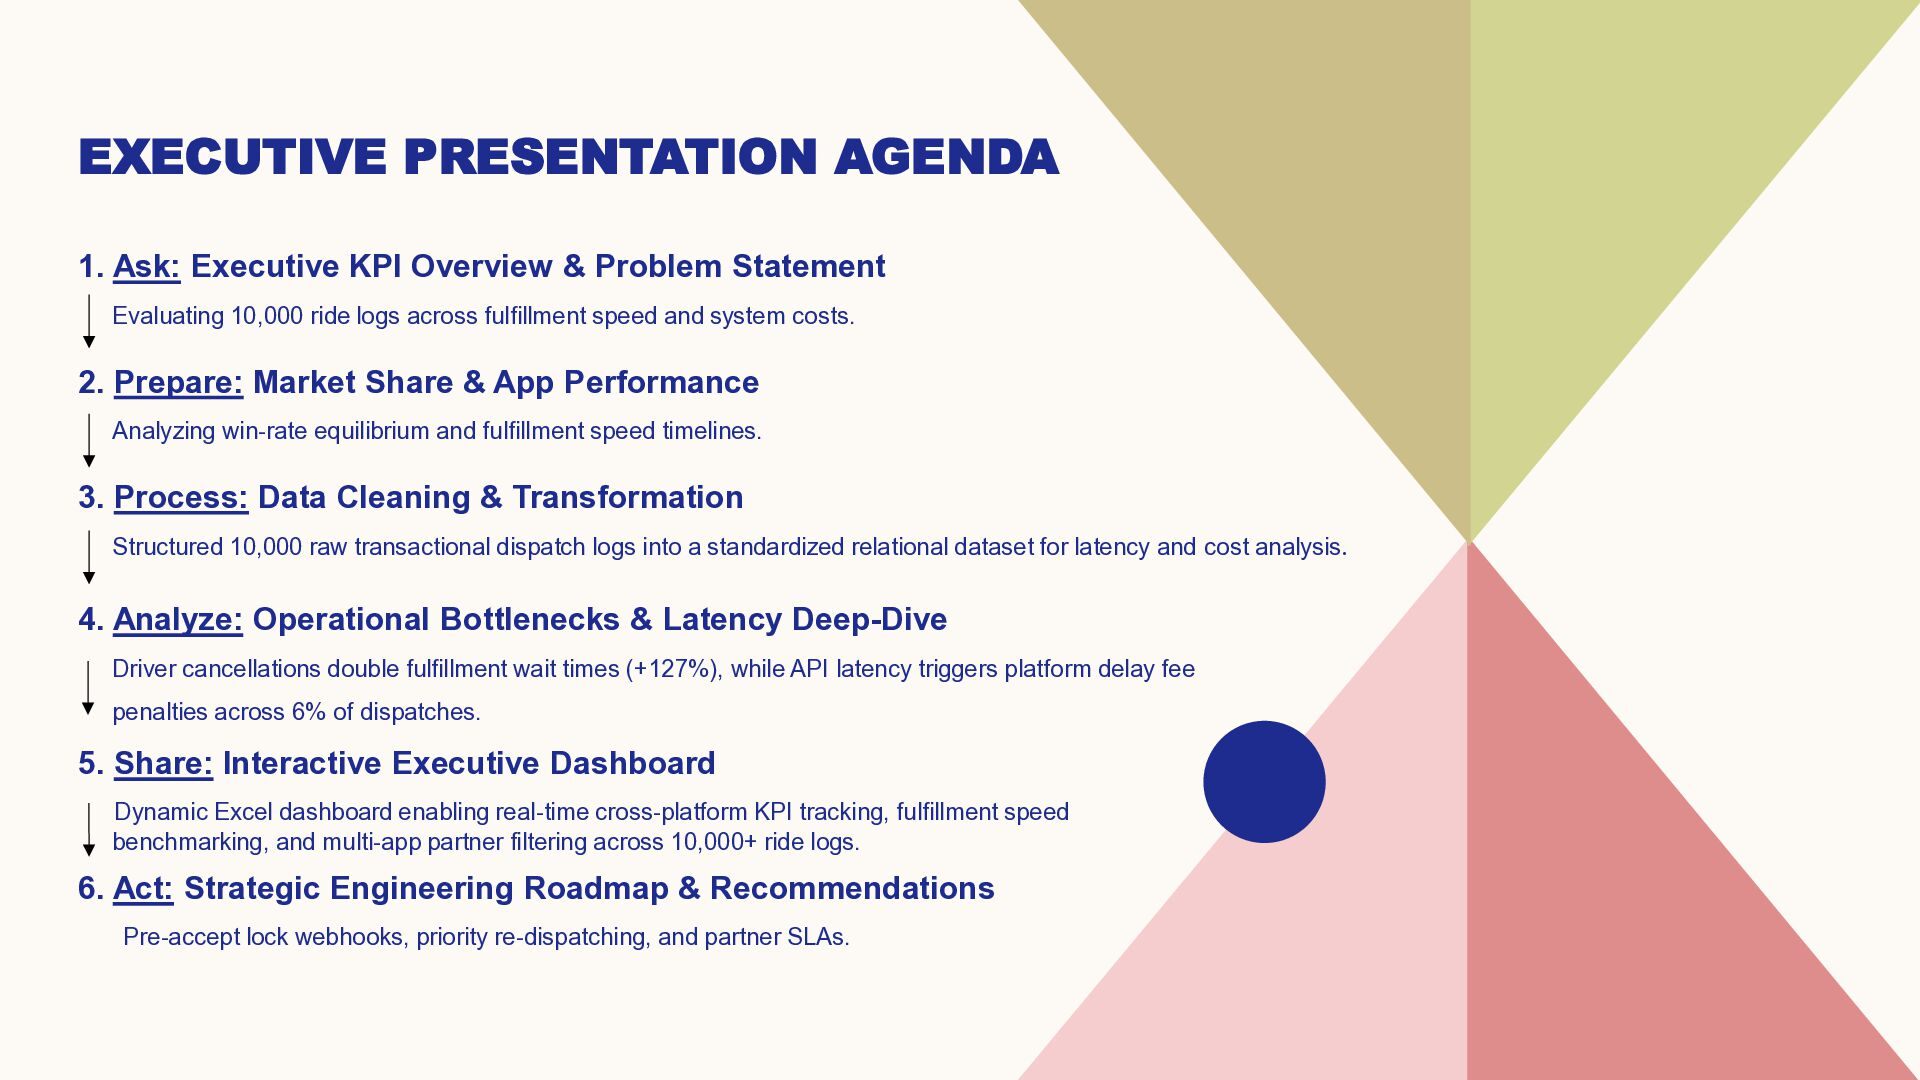
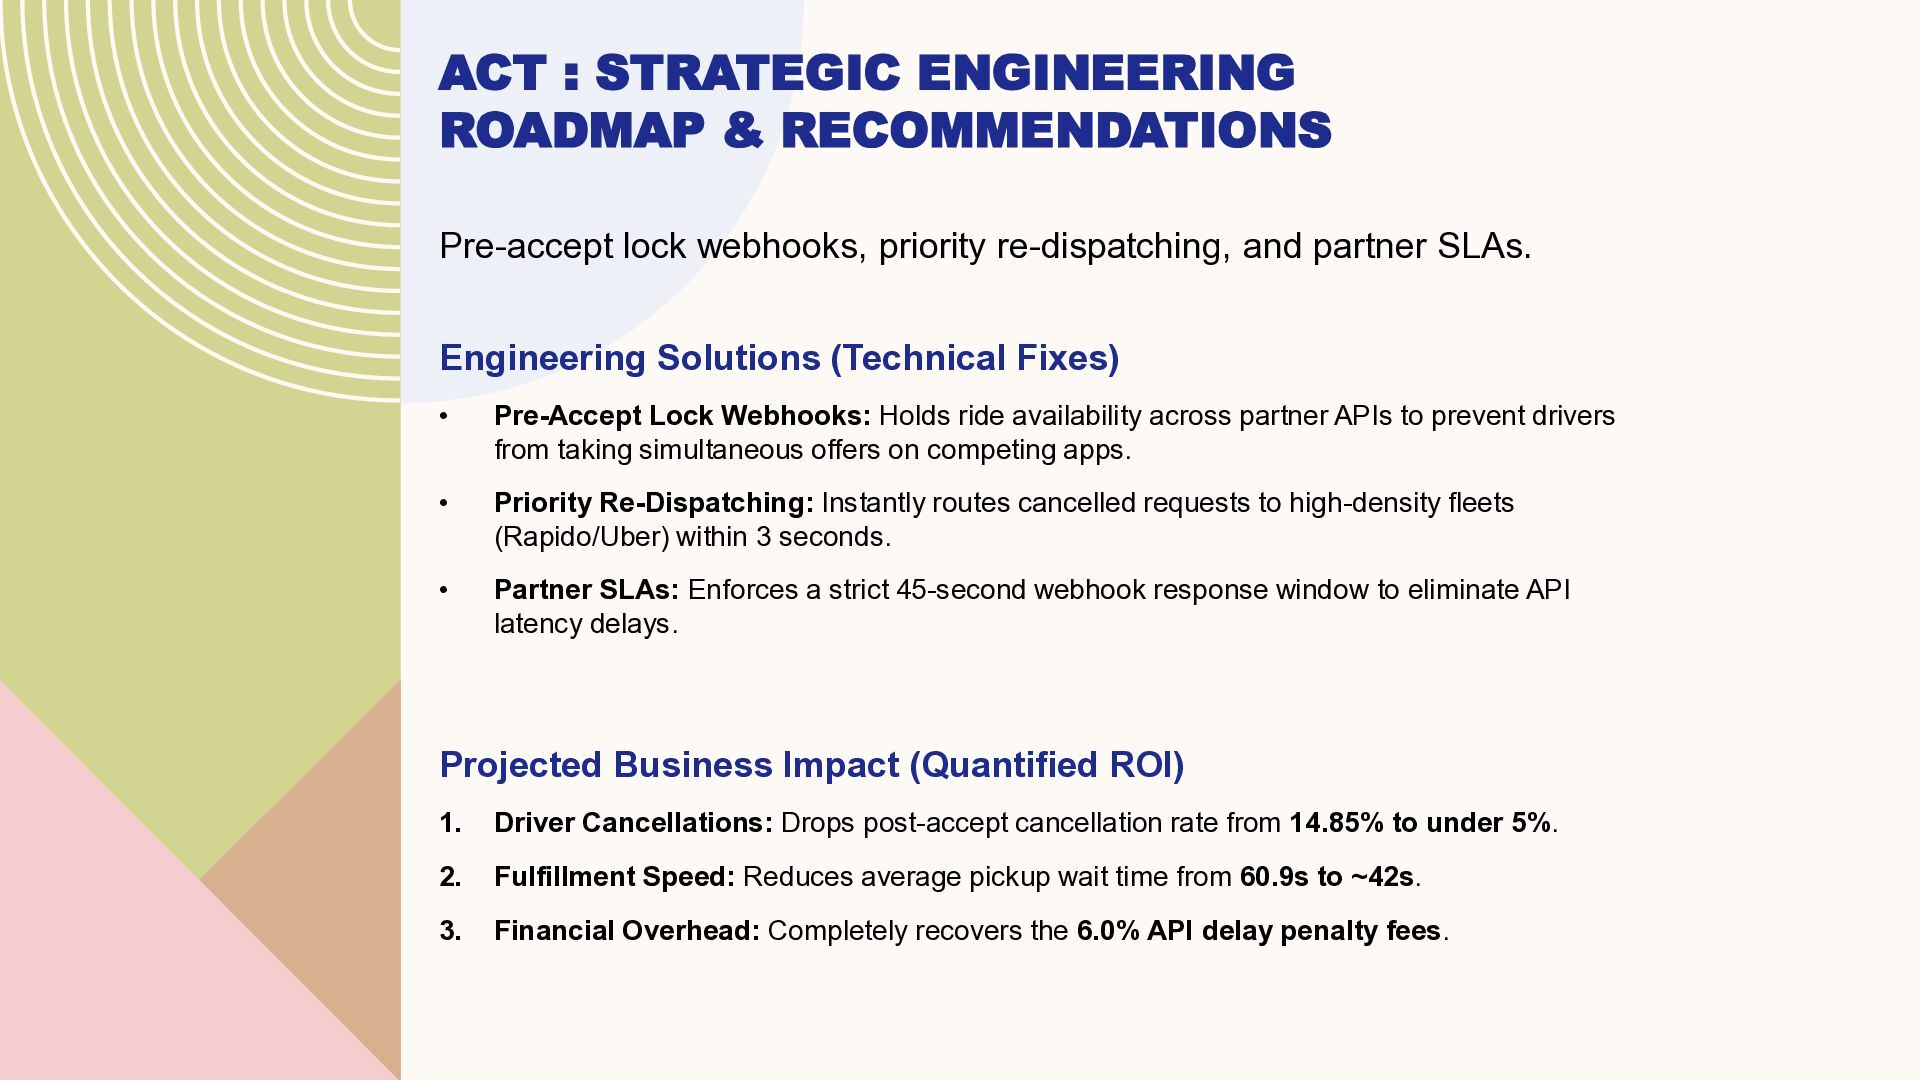
priority re-dispatching, and partner SLAs. Engineering Solutions (Technical Fixes) • Pre-Accept Lock Webhooks: Holds ride availability across partner APIs to prevent drivers from taking simultaneous offers on competing apps. • Priority Re-Dispatching: Instantly routes cancelled requests to high-density fleets (Rapido/Uber) within 3 seconds. • Partner SLAs: Enforces a strict 45-second webhook response window to eliminate API latency delays. Projected Business Impact (Quantified ROI) 1. Driver Cancellations: Drops post-accept cancellation rate from 14.85% to under 5%. 2. Fulfillment Speed: Reduces average pickup wait time from 60.9s to ~42s. 3. Financial Overhead: Completely recovers the 6.0% API delay penalty fees.

 Your Podcast. Everywhere. Effortlessly.


 yumulab
 datascientistsociety
 institutdelelevage
 naok615
 hf149
 ept
 imai448
 satai
 pedronauck
 tamaranovitovic
 cassininazir
 csswizardry
 nikkihalliwell
 mkilby
 sabderemane
 panda_program
 sstephenson
 tonyrice
 sergeychernyshev
 ipullrank