views with respect to certain future events and potential financial performance. Although Nordea believes that the expectations reflected in such forward-looking statements are reasonable, no assurance can be given that such expectations will prove to have been correct. Accordingly, results could differ materially from those set out in the forward-looking statements as a result of various factors. Important factors that may cause such a difference for Nordea include, but are not limited to: (i) the macroeconomic development, (ii) change in the competitive climate, (iii) change in the regulatory environment and other government actions and (iv) change in interest rate and foreign exchange rate levels. This presentation does not imply that Nordea has undertaken to revise these forward-looking statements, beyond what is required by applicable law or applicable stock exchange regulations if and when circumstances arise that will lead to changes compared to the date when these statements were provided.
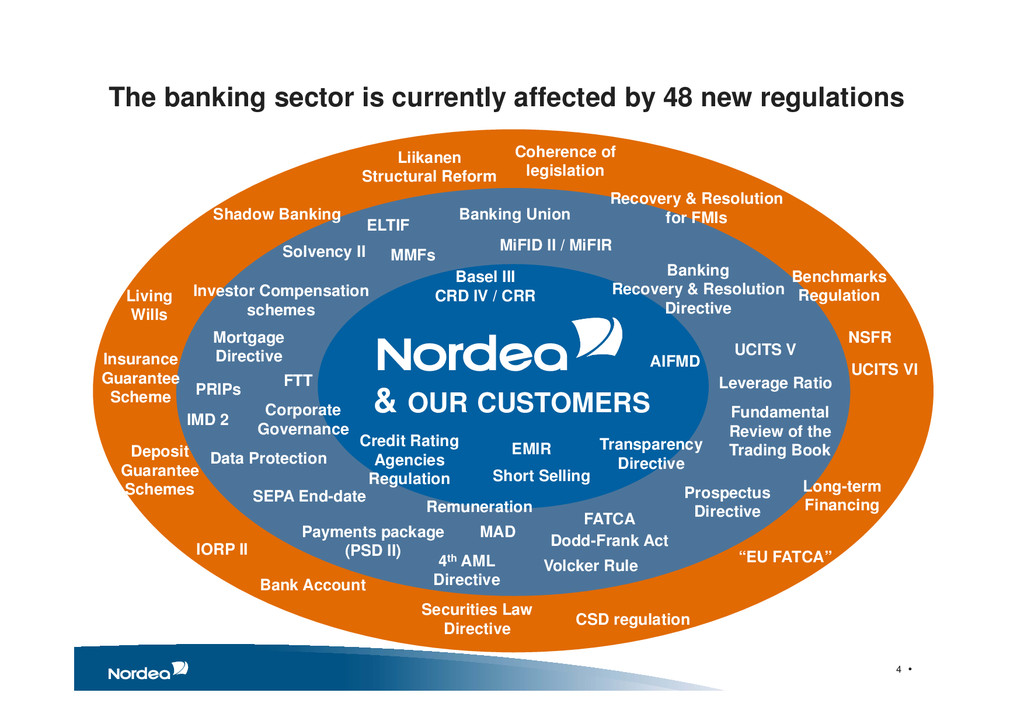
Resolution for FMIs Liikanen Structural Reform Shadow Banking MiFID II / MiFIR EMIR Short Selling CSD regulation PRIPs Investor Compensation schemes Dodd-Frank Act Living Wills Banking Union Basel III CRD IV / CRR Leverage Ratio AIFMD UCITS V Fundamental Review of the Trading Book Banking Recovery & Resolution Directive Long-term Financing Transparency Directive NSFR Corporate Governance Data Protection Deposit Guarantee Schemes Payments package (PSD II) Volcker Rule FATCA Prospectus Directive Coherence of legislation “EU FATCA” Solvency II 4th AML Directive Bank Account Mortgage Directive Remuneration MAD & OUR CUSTOMERS ELTIF MMFs Benchmarks Regulation IMD 2 IORP II Credit Rating Agencies Regulation Insurance Guarantee Scheme UCITS VI The banking sector is currently affected by 48 new regulations
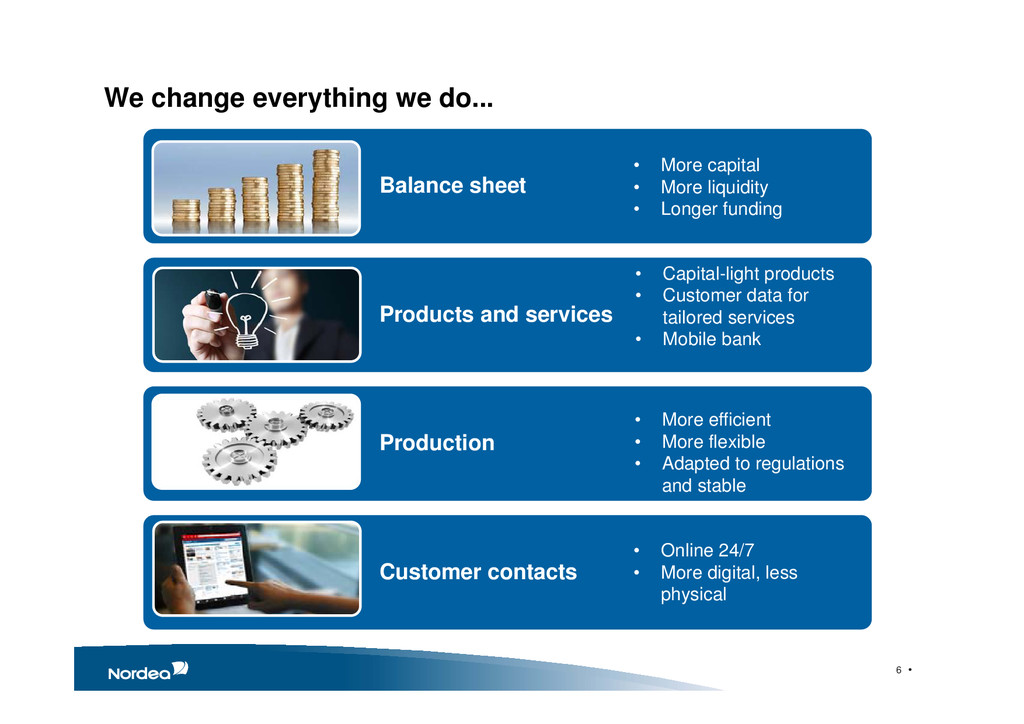
and services Production Customer contacts • More capital • More liquidity • Longer funding • Online 24/7 • More digital, less physical • Capital-light products • Customer data for tailored services • Mobile bank • More efficient • More flexible • Adapted to regulations and stable
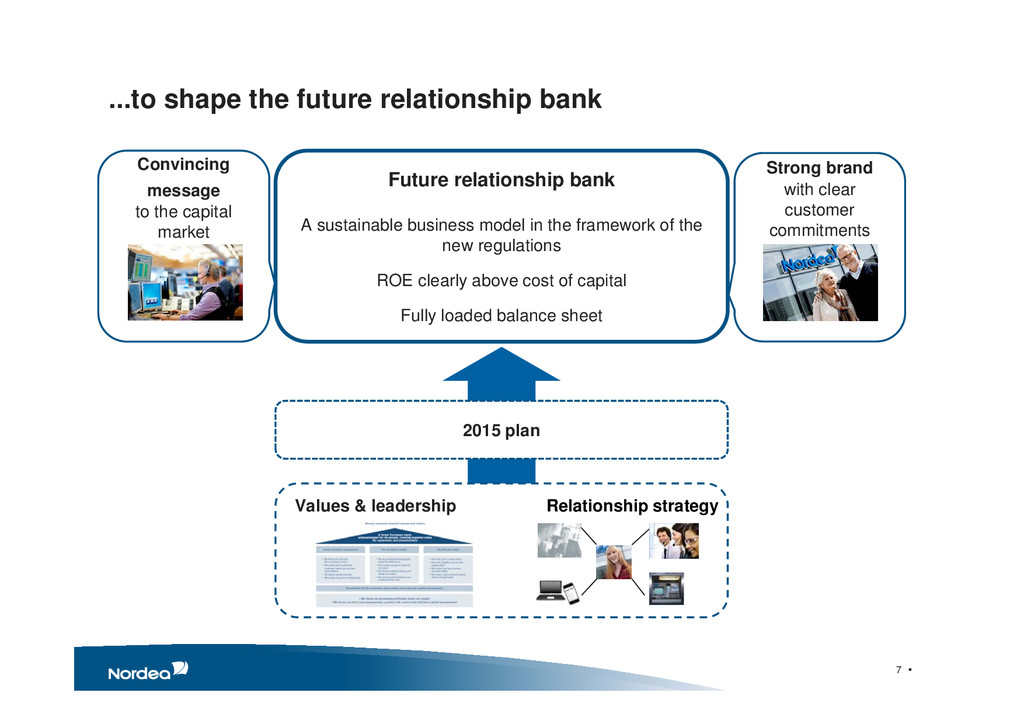
bank A sustainable business model in the framework of the new regulations ROE clearly above cost of capital Fully loaded balance sheet 2015 plan Relationship strategy Values & leadership Convincing message to the capital market Strong brand with clear customer commitments
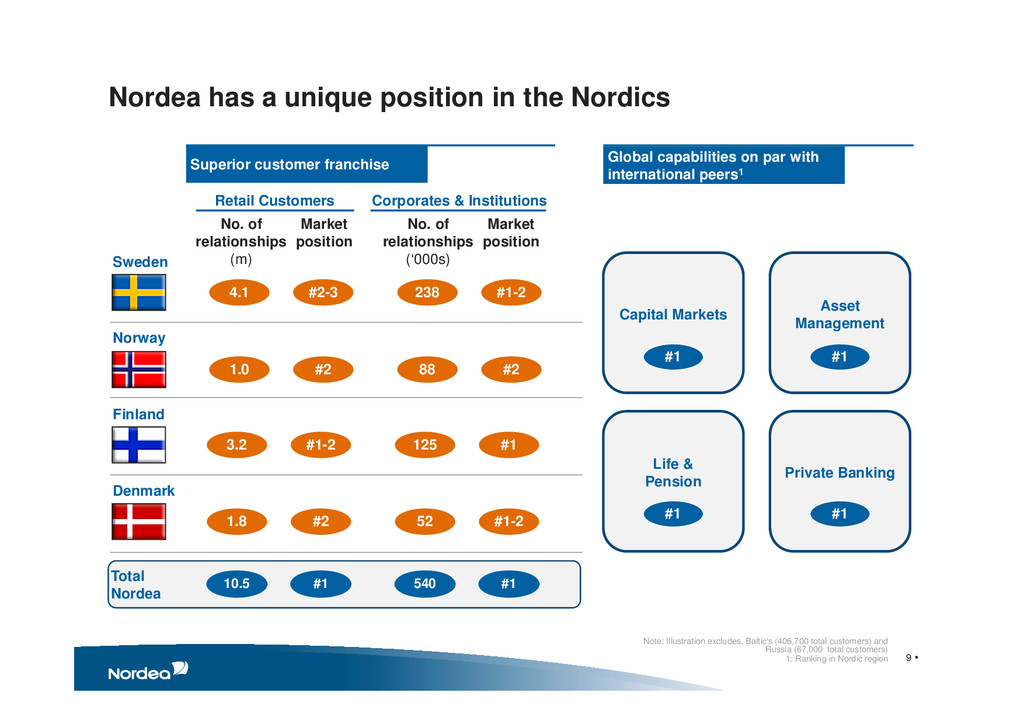
Note: Illustration excludes, Baltic's (406,700 total customers) and Russia (67,000 total customers) 1: Ranking in Nordic region Retail market Sweden Norway Finland Denmark No. of relationships (m) Market position Superior customer franchise Global capabilities on par with international peers1 4.1 #2-3 1.0 #2 3.2 #1-2 1.8 #2 No. of relationships (‘000s) Market position 238 #1-2 88 #2 125 #1 52 #1-2 Total Nordea 10.5 #1 540 #1 Capital Markets Asset Management Life & Pension Private Banking #1 #1 #1 #1 Retail Customers Corporates & Institutions
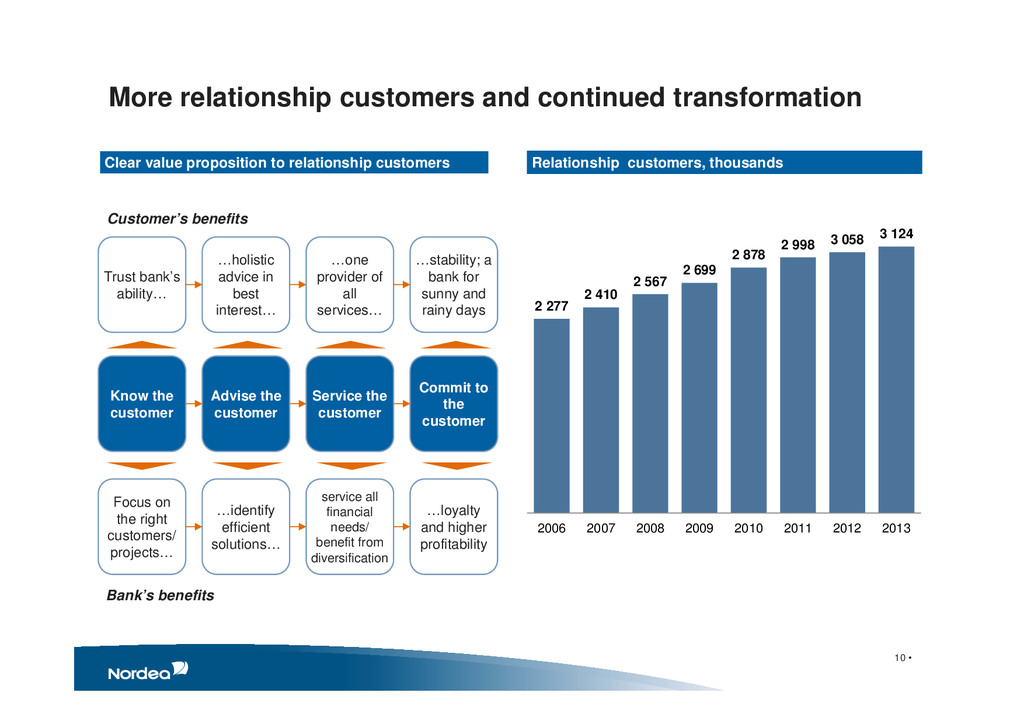
relationship customers Trust bank’s ability… …holistic advice in best interest… …one provider of all services… …stability; a bank for sunny and rainy days Customer’s benefits Focus on the right customers/ projects… …identify efficient solutions… service all financial needs/ benefit from diversification …loyalty and higher profitability Bank’s benefits Know the customer Advise the customer Service the customer Commit to the customer Relationship customers, thousands 10 • 2 277 2 410 2 567 2 699 2 878 2 998 3 058 3 124 2006 2007 2008 2009 2010 2011 2012 2013
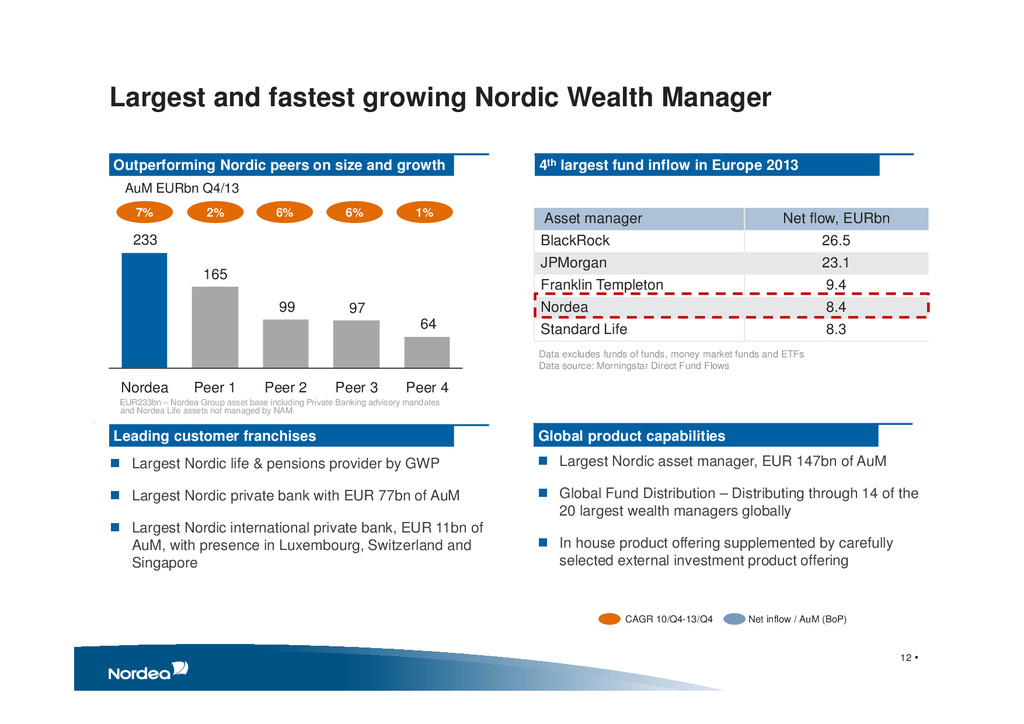
EURbn Q4/13 Largest Nordic life & pensions provider by GWP Largest Nordic private bank with EUR 77bn of AuM Largest Nordic international private bank, EUR 11bn of AuM, with presence in Luxembourg, Switzerland and Singapore Largest Nordic asset manager, EUR 147bn of AuM Global Fund Distribution – Distributing through 14 of the 20 largest wealth managers globally In house product offering supplemented by carefully selected external investment product offering Global product capabilities Leading customer franchises 4th largest fund inflow in Europe 2013 Outperforming Nordic peers on size and growth Largest and fastest growing Nordic Wealth Manager EUR233bn – Nordea Group asset base including Private Banking advisory mandates and Nordea Life assets not managed by NAM. . 7% 2% 6% 6% 1% 64 97 99 165 233 Peer 4 Peer 3 Peer 2 Peer 1 Nordea Data excludes funds of funds, money market funds and ETFs Data source: Morningstar Direct Fund Flows Asset manager Net flow, EURbn BlackRock 26.5 JPMorgan 23.1 Franklin Templeton 9.4 Nordea 8.4 Standard Life 8.3
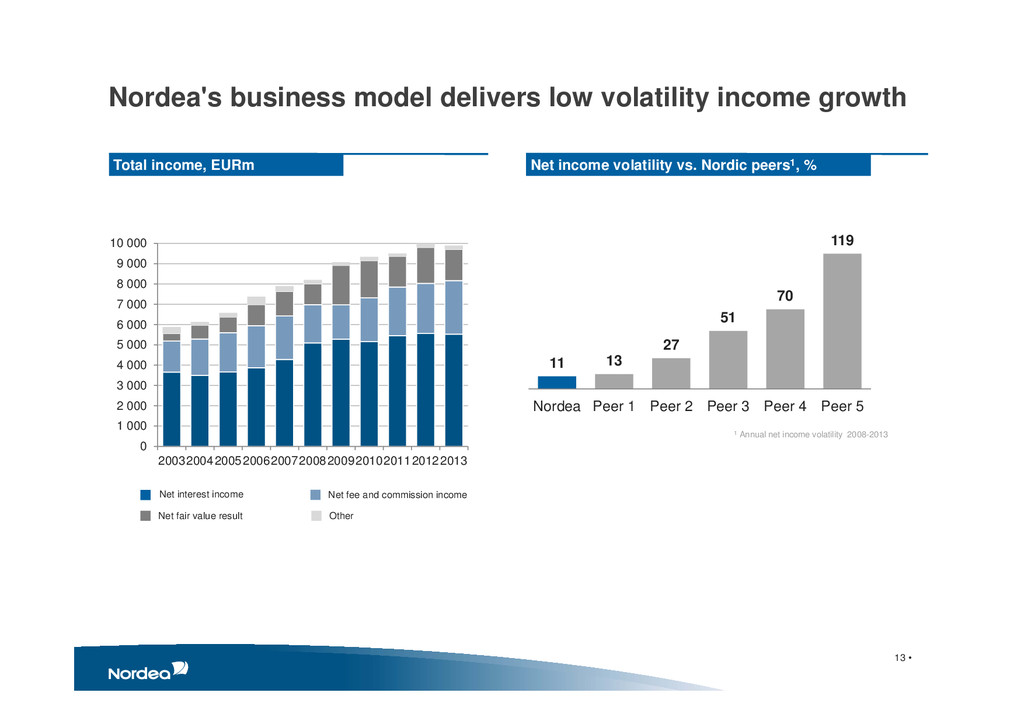
Total income, EURm 0 1 000 2 000 3 000 4 000 5 000 6 000 7 000 8 000 9 000 10 000 20032004200520062007200820092010201120122013 Other Net fee and commission income Net fair value result Net interest income 11 13 27 51 70 119 Nordea Peer 1 Peer 2 Peer 3 Peer 4 Peer 5 Net income volatility vs. Nordic peers1, % 1 Annual net income volatility 2008-2013
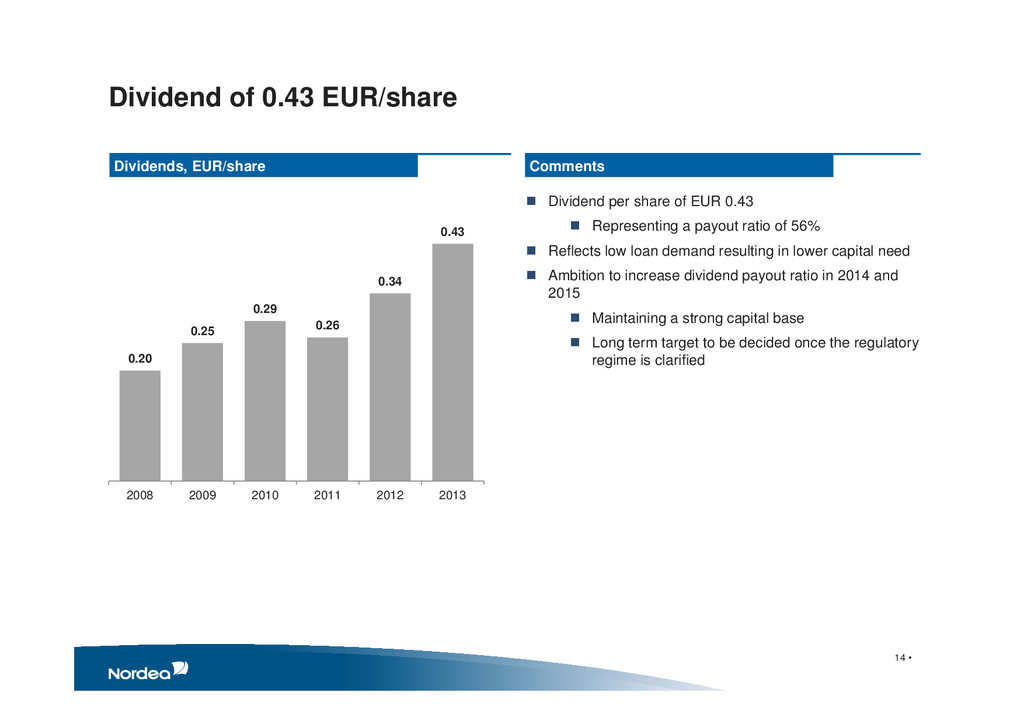
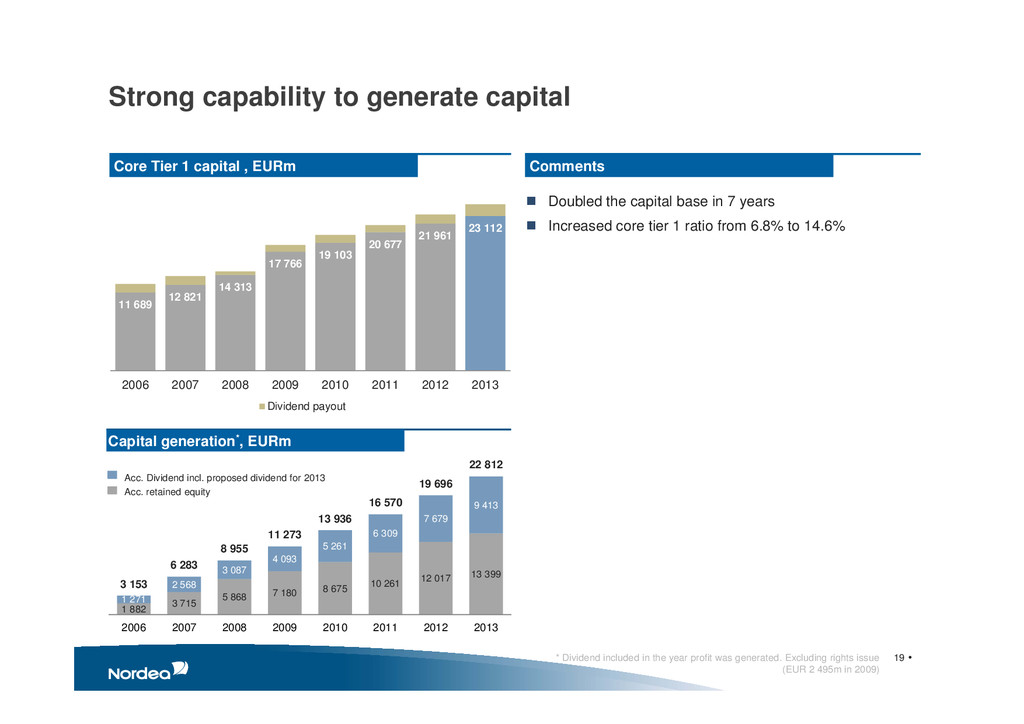
share of EUR 0.43 Representing a payout ratio of 56% Reflects low loan demand resulting in lower capital need Ambition to increase dividend payout ratio in 2014 and 2015 Maintaining a strong capital base Long term target to be decided once the regulatory regime is clarified 0.20 0.25 0.29 0.26 0.34 0.43 2008 2009 2010 2011 2012 2013 14 •
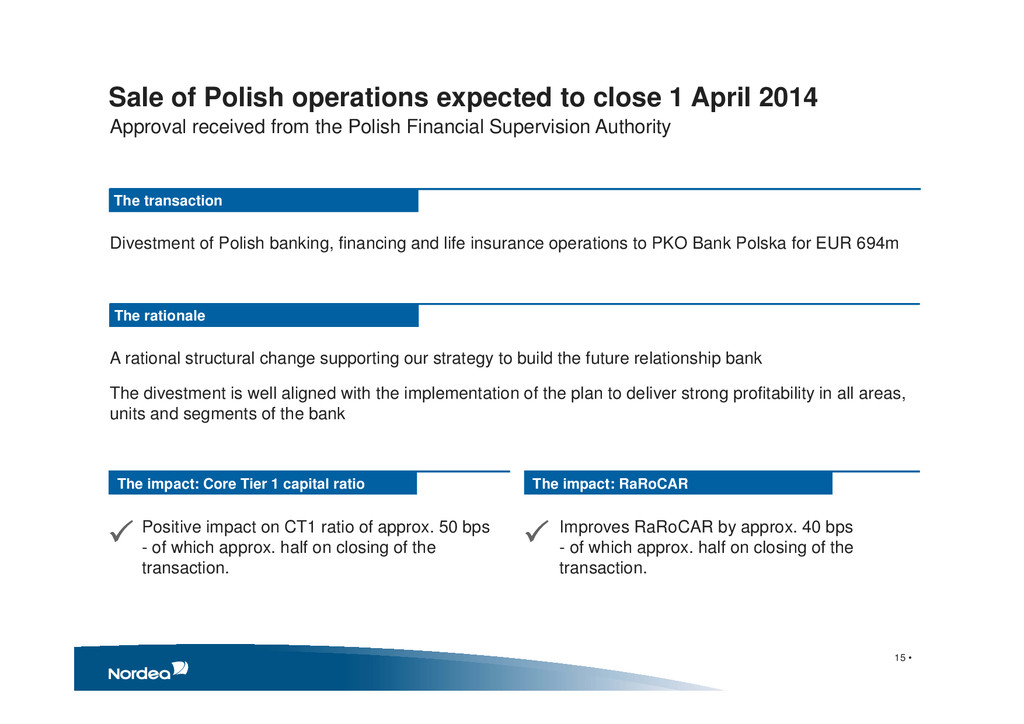
Divestment of Polish banking, financing and life insurance operations to PKO Bank Polska for EUR 694m A rational structural change supporting our strategy to build the future relationship bank The divestment is well aligned with the implementation of the plan to deliver strong profitability in all areas, units and segments of the bank The transaction The rationale Positive impact on CT1 ratio of approx. 50 bps - of which approx. half on closing of the transaction. The impact: Core Tier 1 capital ratio The impact: RaRoCAR Improves RaRoCAR by approx. 40 bps - of which approx. half on closing of the transaction. Sale of Polish operations expected to close 1 April 2014
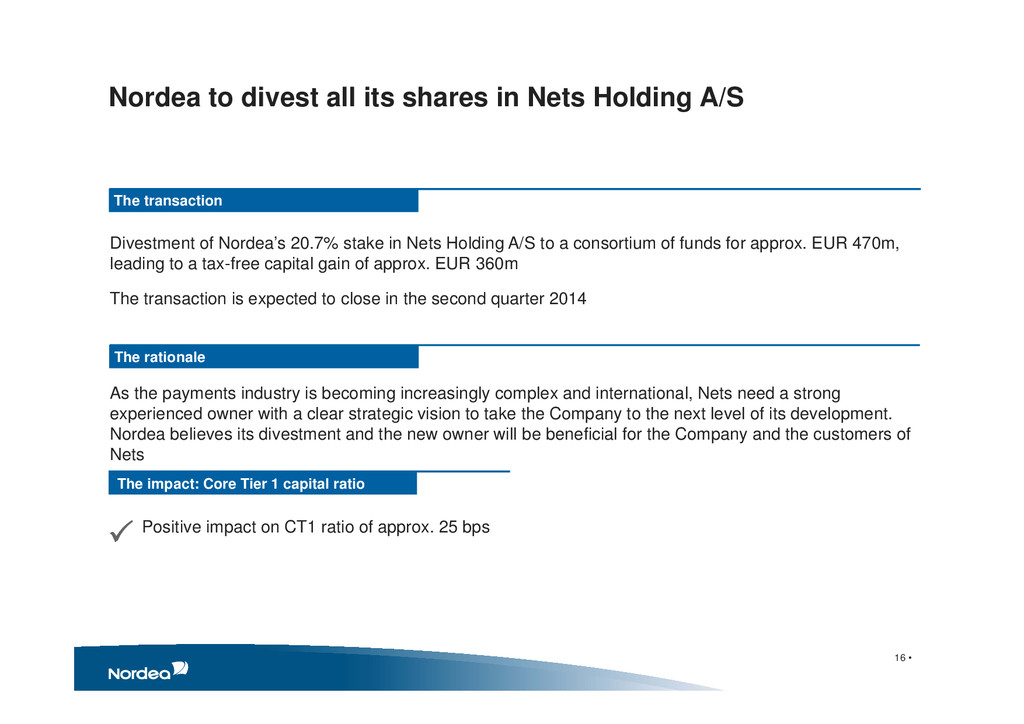
A/S to a consortium of funds for approx. EUR 470m, leading to a tax-free capital gain of approx. EUR 360m The transaction is expected to close in the second quarter 2014 As the payments industry is becoming increasingly complex and international, Nets need a strong experienced owner with a clear strategic vision to take the Company to the next level of its development. Nordea believes its divestment and the new owner will be beneficial for the Company and the customers of Nets The transaction The rationale Positive impact on CT1 ratio of approx. 25 bps The impact: Core Tier 1 capital ratio Nordea to divest all its shares in Nets Holding A/S
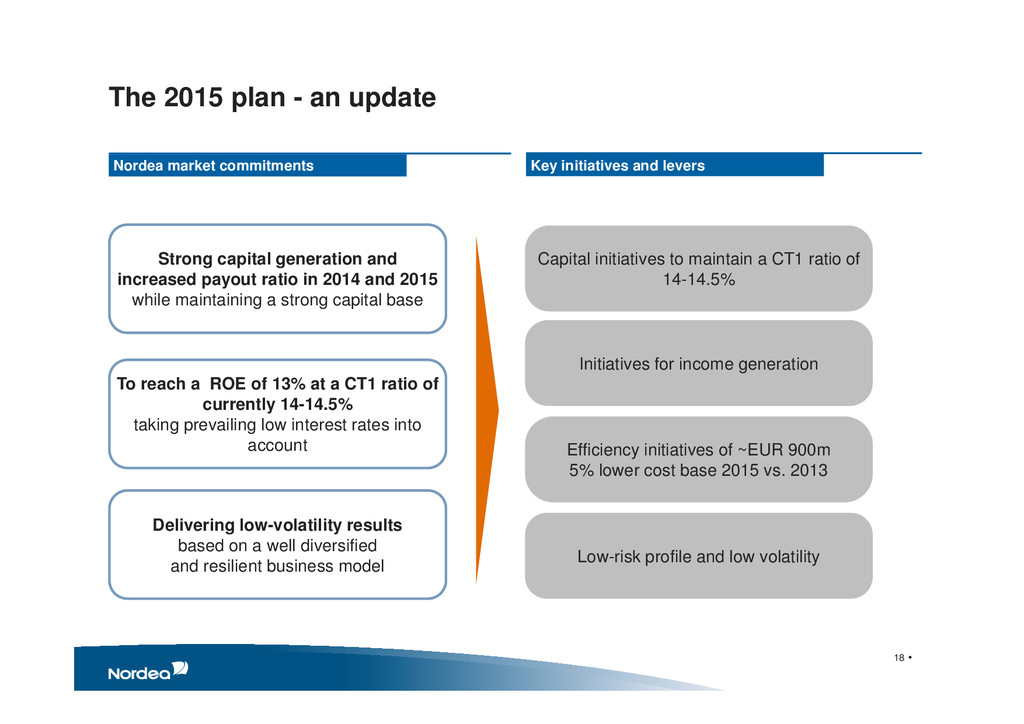
to maintain a CT1 ratio of 14-14.5% Initiatives for income generation Efficiency initiatives of ~EUR 900m 5% lower cost base 2015 vs. 2013 Low-risk profile and low volatility Strong capital generation and increased payout ratio in 2014 and 2015 while maintaining a strong capital base To reach a ROE of 13% at a CT1 ratio of currently 14-14.5% taking prevailing low interest rates into account Delivering low-volatility results based on a well diversified and resilient business model Nordea market commitments Key initiatives and levers
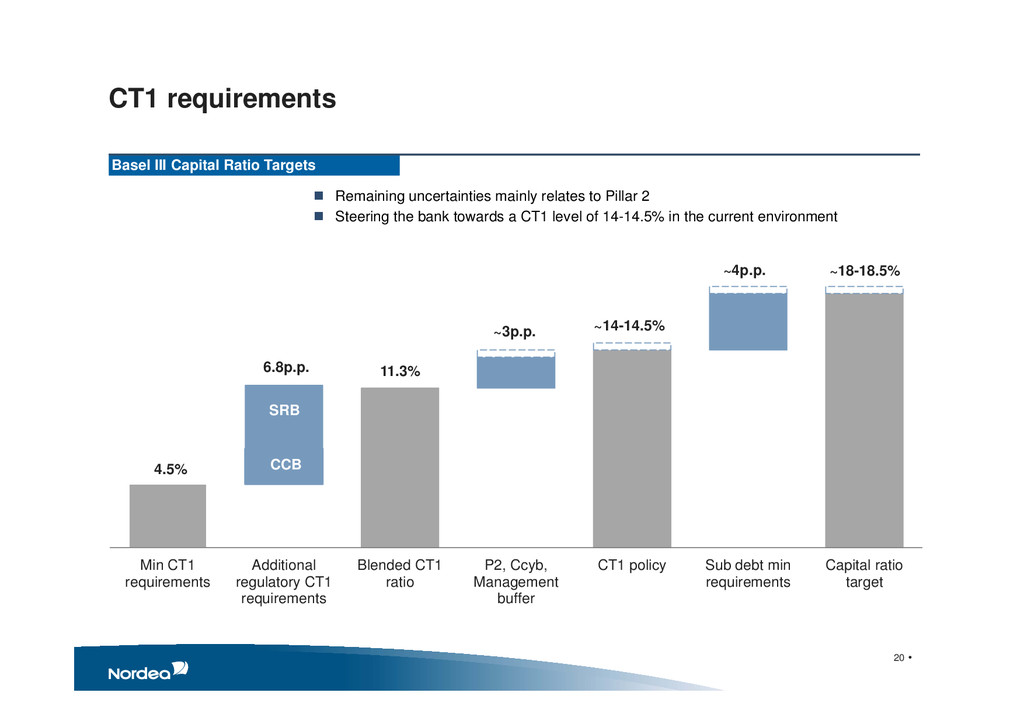
CT1 requirements Additional regulatory CT1 requirements Blended CT1 ratio P2, Ccyb, Management buffer CT1 policy Sub debt min requirements Capital ratio target SRB CCB Basel III Capital Ratio Targets CCB SRB Remaining uncertainties mainly relates to Pillar 2 Steering the bank towards a CT1 level of 14-14.5% in the current environment CT1 requirements
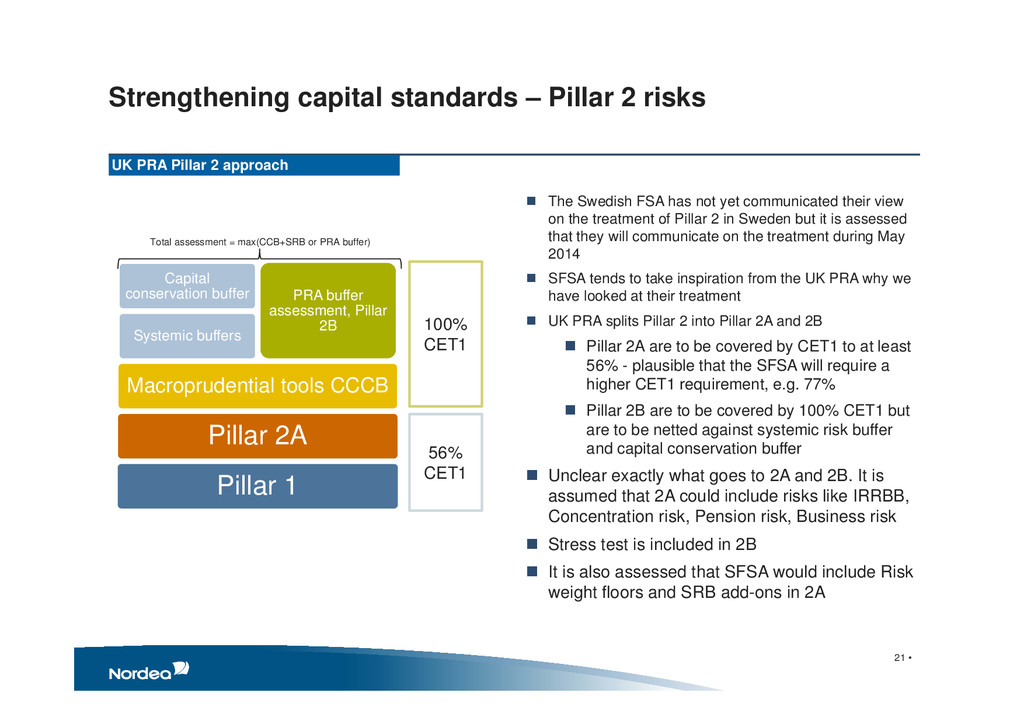
2A Macroprudential tools CCCB Systemic buffers Capital conservation buffer PRA buffer assessment, Pillar 2B 100% CET1 56% CET1 Total assessment = max(CCB+SRB or PRA buffer) UK PRA Pillar 2 approach The Swedish FSA has not yet communicated their view on the treatment of Pillar 2 in Sweden but it is assessed that they will communicate on the treatment during May 2014 SFSA tends to take inspiration from the UK PRA why we have looked at their treatment UK PRA splits Pillar 2 into Pillar 2A and 2B Pillar 2A are to be covered by CET1 to at least 56% - plausible that the SFSA will require a higher CET1 requirement, e.g. 77% Pillar 2B are to be covered by 100% CET1 but are to be netted against systemic risk buffer and capital conservation buffer Unclear exactly what goes to 2A and 2B. It is assumed that 2A could include risks like IRRBB, Concentration risk, Pension risk, Business risk Stress test is included in 2B It is also assessed that SFSA would include Risk weight floors and SRB add-ons in 2A 21 •
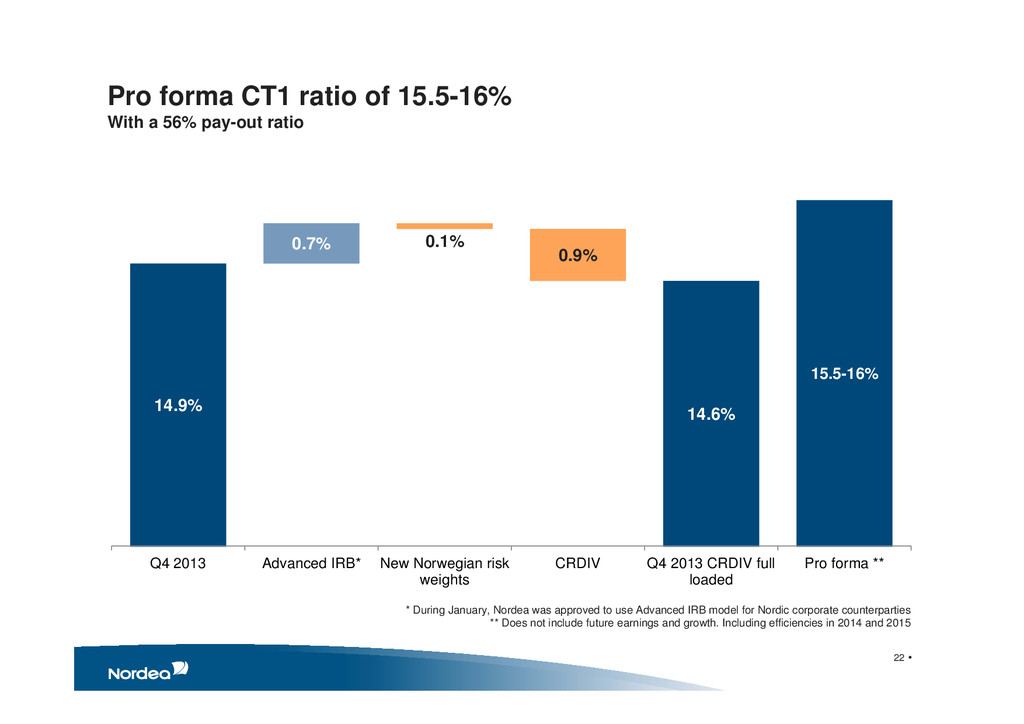
56% pay-out ratio 14.9% 0.7% 0.1% 0.9% 14.6% 15.5-16% Q4 2013 Advanced IRB* New Norwegian risk weights CRDIV Q4 2013 CRDIV full loaded Pro forma ** * During January, Nordea was approved to use Advanced IRB model for Nordic corporate counterparties ** Does not include future earnings and growth. Including efficiencies in 2014 and 2015
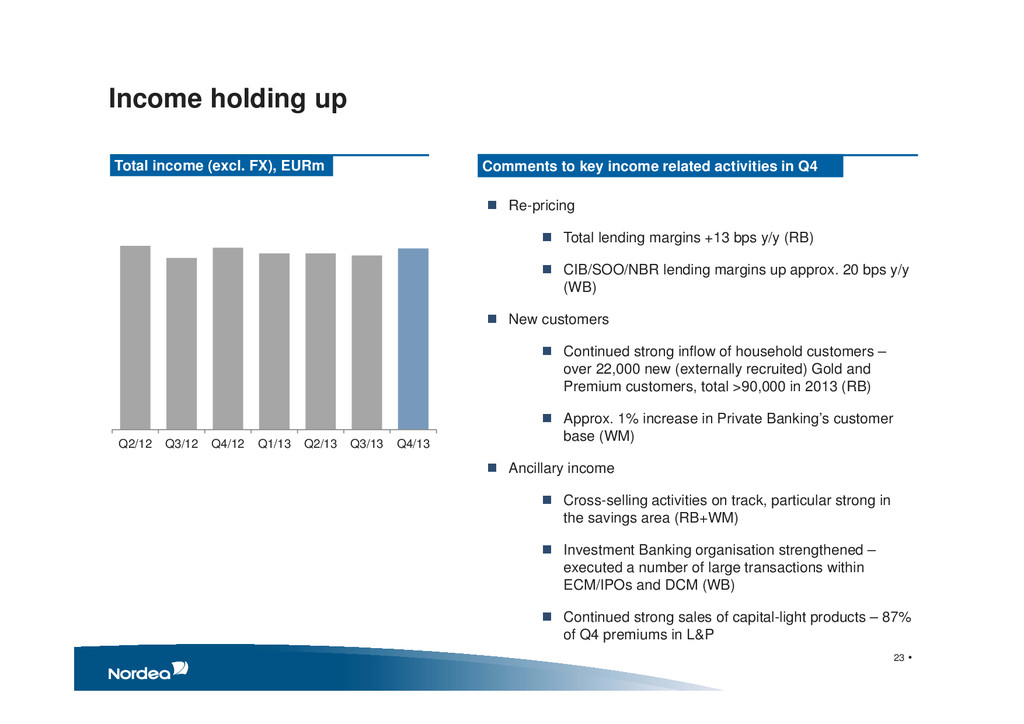
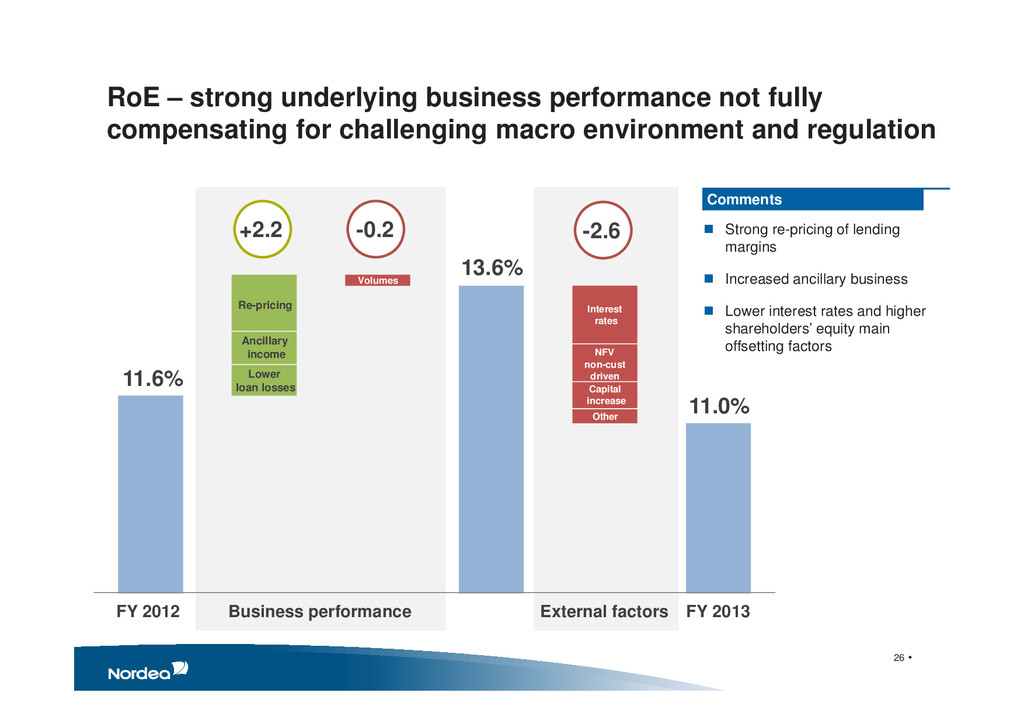
Comments to key income related activities in Q4 Re-pricing Total lending margins +13 bps y/y (RB) CIB/SOO/NBR lending margins up approx. 20 bps y/y (WB) New customers Continued strong inflow of household customers – over 22,000 new (externally recruited) Gold and Premium customers, total >90,000 in 2013 (RB) Approx. 1% increase in Private Banking’s customer base (WM) Ancillary income Cross-selling activities on track, particular strong in the savings area (RB+WM) Investment Banking organisation strengthened – executed a number of large transactions within ECM/IPOs and DCM (WB) Continued strong sales of capital-light products – 87% of Q4 premiums in L&P Q2/12 Q3/12 Q4/12 Q1/13 Q2/13 Q3/13 Q4/13
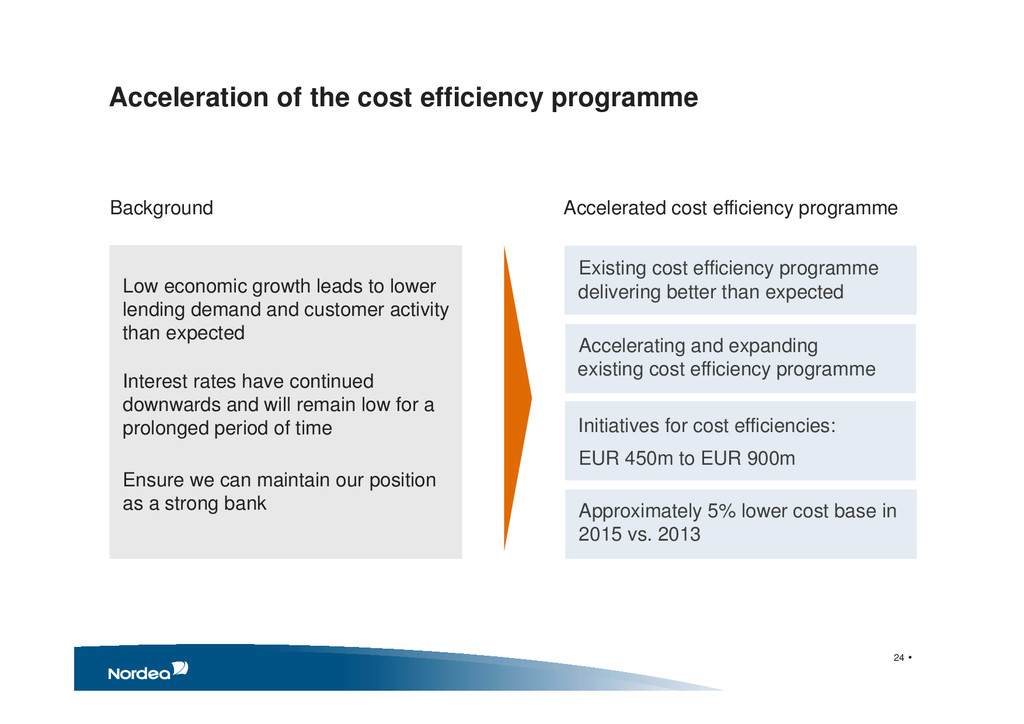
cost efficiency programme Accelerating and expanding Initiatives for cost efficiencies: Approximately 5% lower cost base in 2015 vs. 2013 EUR 450m to EUR 900m Low economic growth leads to lower lending demand and customer activity than expected Interest rates have continued downwards and will remain low for a prolonged period of time Ensure we can maintain our position as a strong bank existing cost efficiency programme Existing cost efficiency programme delivering better than expected
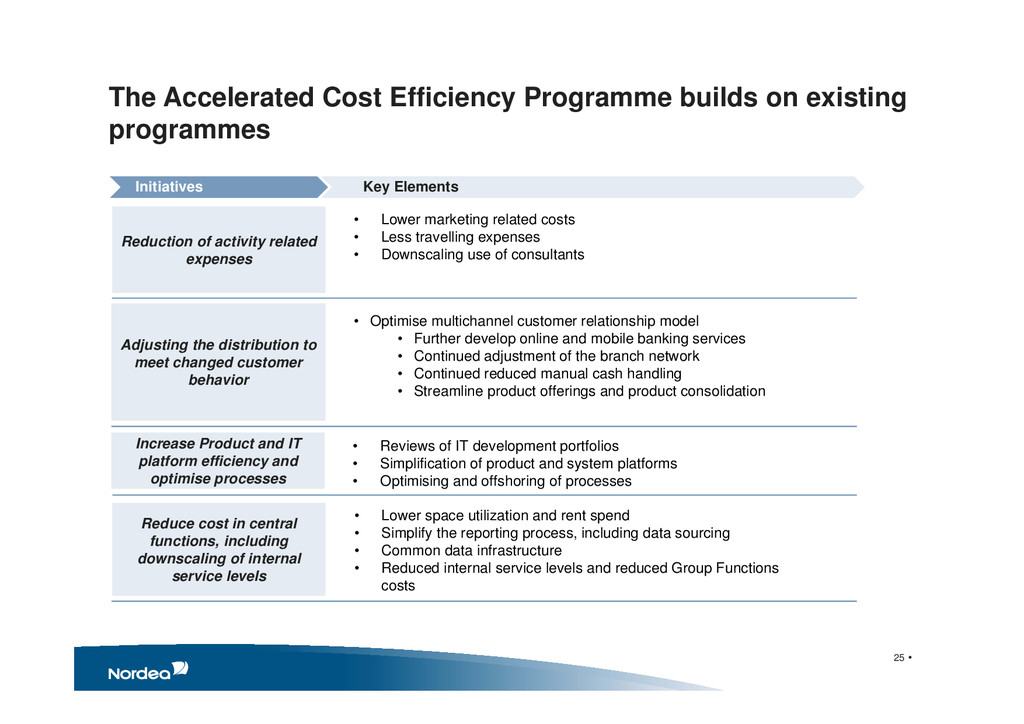
programmes Reduction of activity related expenses Increase Product and IT platform efficiency and optimise processes Reduce cost in central functions, including downscaling of internal service levels Adjusting the distribution to meet changed customer behavior Initiatives Key Elements • Optimise multichannel customer relationship model • Further develop online and mobile banking services • Continued adjustment of the branch network • Continued reduced manual cash handling • Streamline product offerings and product consolidation • Lower marketing related costs • Less travelling expenses • Downscaling use of consultants • Reviews of IT development portfolios • Simplification of product and system platforms • Optimising and offshoring of processes • Lower space utilization and rent spend • Simplify the reporting process, including data sourcing • Common data infrastructure • Reduced internal service levels and reduced Group Functions costs
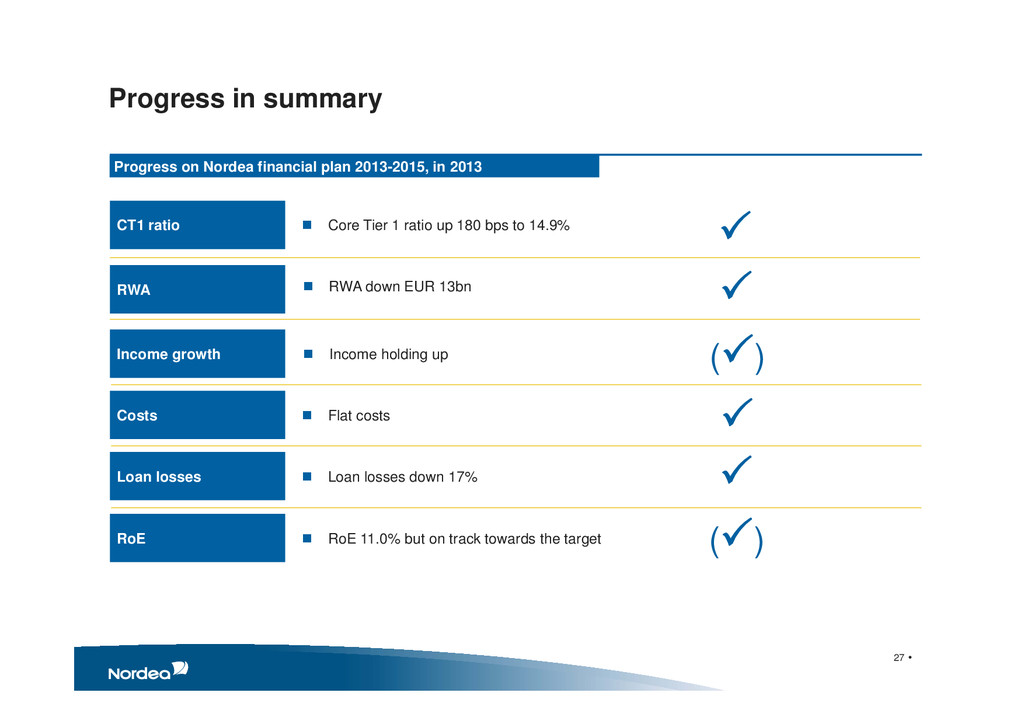
up 180 bps to 14.9% CT1 ratio RWA down EUR 13bn RWA Income holding up Income growth Flat costs Costs Loan losses down 17% Loan losses RoE 11.0% but on track towards the target RoE Progress on Nordea financial plan 2013-2015, in 2013 () ()