Upgrade to Pro — share decks privately, control downloads, hide ads and more …

Grant Paton-Simpson: Python and Creative Data Analysis

Grant Paton-Simpson: Python and Creative Data Analysis

= = = = = = = = = = = = = = = = = = = = = = = = = = = = = = = = =
Grant Paton-Simpson:
Python and Creative Data Analysis
= = = = = = = = = = = = = = = = = = = = = = = = = = = = = = = = =
@ Kiwi PyCon 2013 - Saturday, 07 Sep 2013 - Track 2
http://nz.pycon.org/

**Audience level**

Novice

**Description**

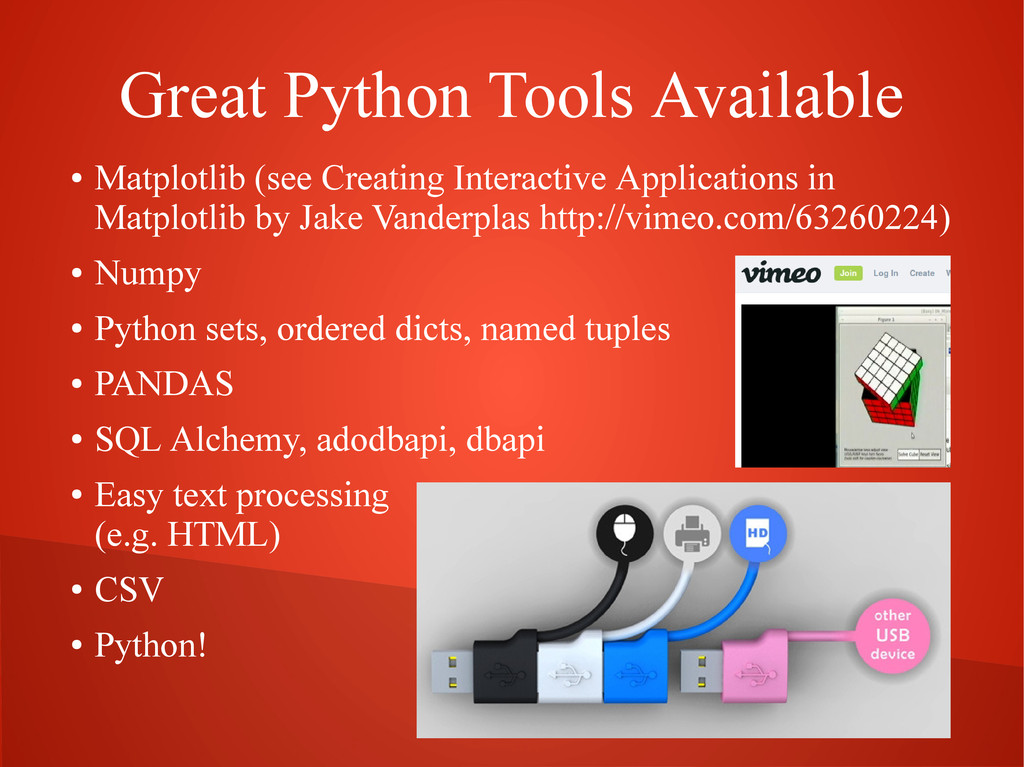
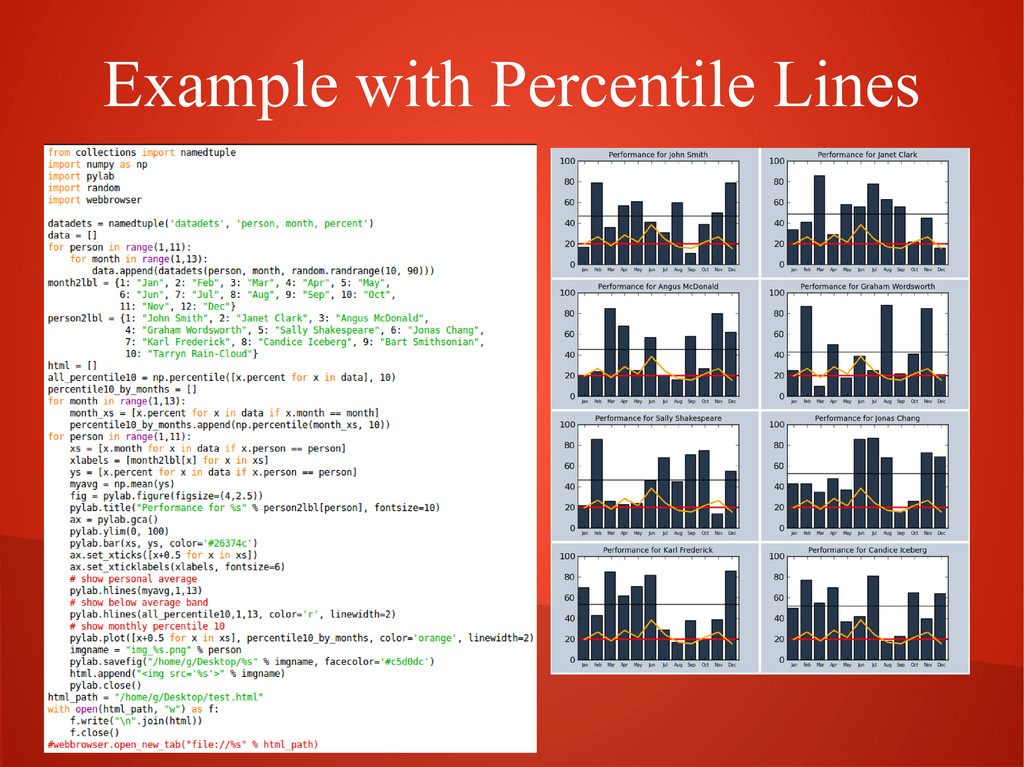
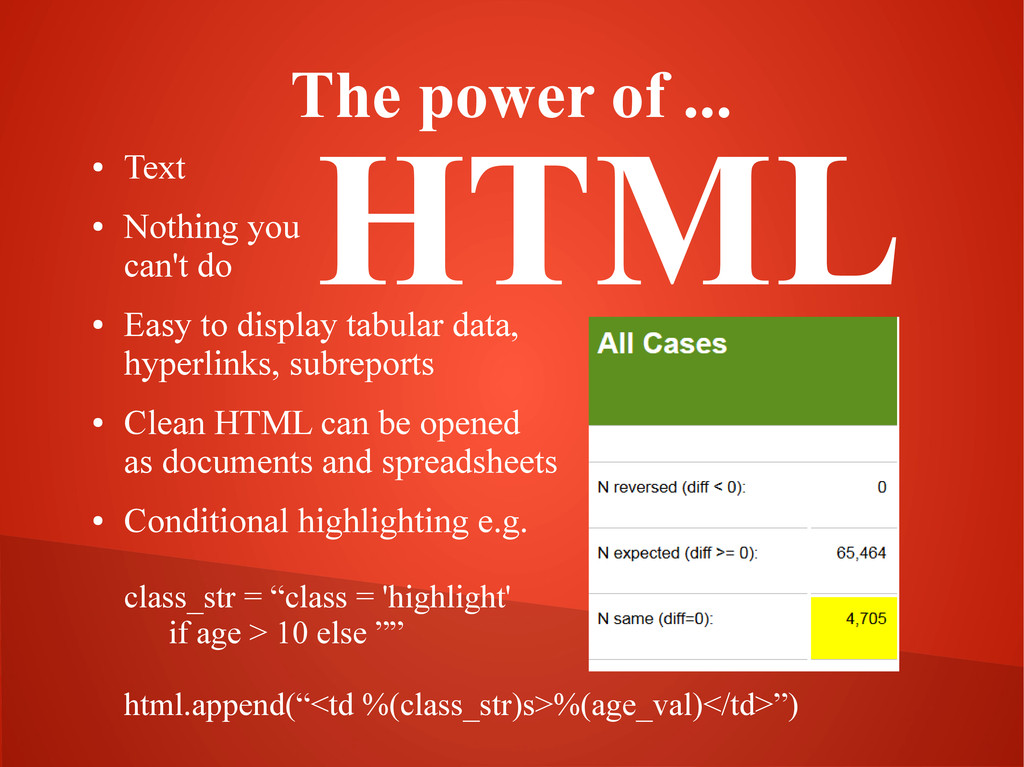
Python + SQL/CSV + matplotlib + HTML make it possible to create flexible and sophisticated analyses. If you want to express something about your data, there is probably a way of doing it using these tools. This talk will be about some lessons learned.

**Abstract**

Python + SQL/CSV + matplotlib + HTML make it possible to create flexible and sophisticated analyses of data from your spreadsheet or database. If you want to express something about your data, there is probably a way of doing it using these tools. The presentation will include both general principles and specific technical tips (who knew named tuples would be so useful!). Bring questions and enthusiasm. Data analysis should be fun.

**YouTube**

http://www.youtube.com/watch?v=6gz2eEC4qdc

New Zealand Python User Group

September 07, 2013
Tweet

More Decks by New Zealand Python User Group

Other Decks in Programming

Transcript

  1. Creative Data Analysis with Python Grant Paton-Simpson Senior Data &

    Implementation Specialist Optima Corporation Creator of SOFA Statistics
  2. Great Python Tools Available • Matplotlib (see Creating Interactive Applications

    in Matplotlib by Jake Vanderplas http://vimeo.com/63260224) • Numpy • Python sets, ordered dicts, named tuples • PANDAS • SQL Alchemy, adodbapi, dbapi • Easy text processing (e.g. HTML) • CSV • Python!
  3. Make a Simple Point • Make complex things simple •

    Extract small information from large data • Present truth, do not deceive http://www.dataists.com/2010/10/... … what-data-visualization-should-do-simple-small-truth/
  4. is your friend • How to shift a legend outside

    the plot • How to have a major and minor axis • How to shift x axis labels to the middle of a bar • How to position a triangle a certain percentage along the x axis • How to apply a heat map to circles etc etc
  5. SQL The power of ... • Planned non-obsolescence • Nothing

    you can't do • Scales • Can decouple • SQL Alchemy, dbapi, adodbapi etc • In my current role, I use SQL with safe data where there is no significant potential for dangerous input. In this case, the most readable and maintainable way of building SQL strings is to use dicts and string interpolation: “SELECT %(fld1)s, %(fld2)s FROM ...” % {“fld1”: dest_arrive_time, “fld2”: dest_depart_time}. But this is not a good habit otherwise – search on “SQL injection” if you don't know why! • Read data using dicts: row[“dest_x”]
  6. dbapi • con = db.connect(host=...) • cur = con.cursor() •

    sql = “SELECT fname FROM data WHERE age > 40” • cur.execute(sql) • print(“, ”.join(x[“fname”] for x in cur.fetchall()))
  7. HTML The power of ... • Text • Nothing you

    can't do • Easy to display tabular data, hyperlinks, subreports • Clean HTML can be opened as documents and spreadsheets • Conditional highlighting e.g. class_str = “class = 'highlight' if age > 10 else ”” html.append(“<td %(class_str)s>%(age_val)</td>”)