Upgrade to Pro — share decks privately, control downloads, hide ads and more …

Open GPU-Accelerated Data Analytics

OmniSci
January 31, 2018

Open GPU-Accelerated Data Analytics

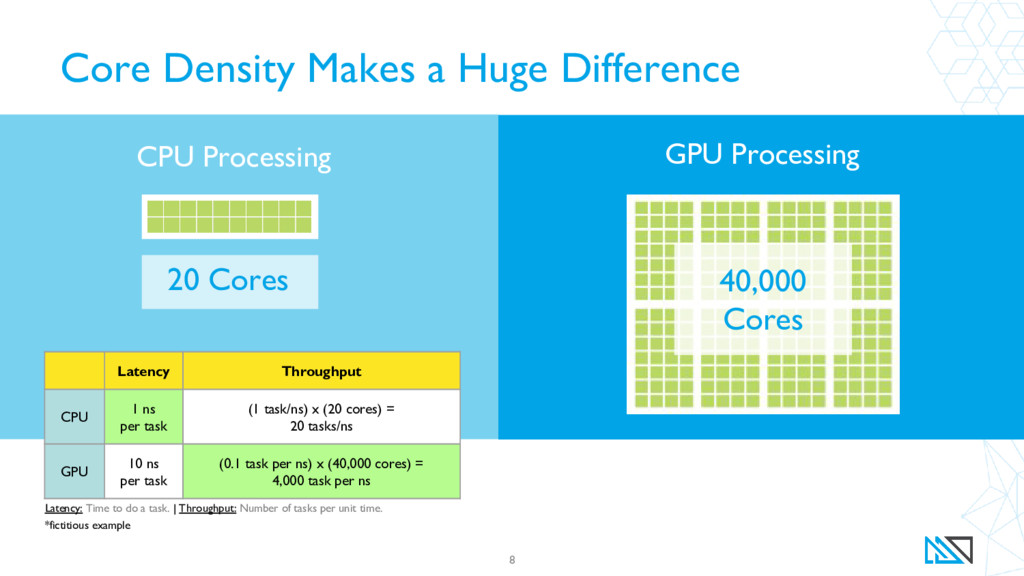
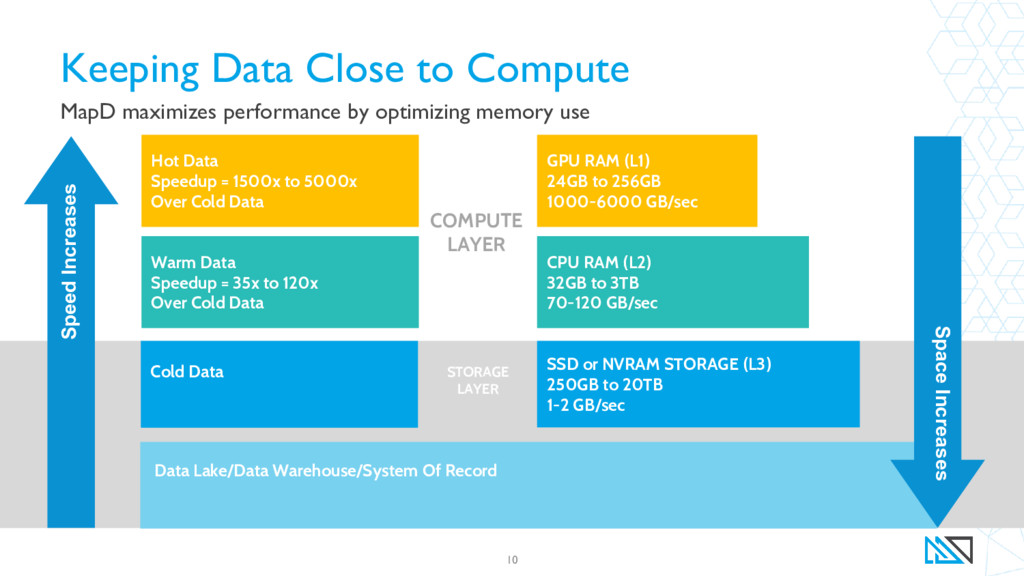
A revolution is occurring across the GPU software stack, driven by the disruptive performance gains GPUs have seen generation after generation. The modern field of deep learning would have not been possible without GPUs, and as a database we are often seeing two-or-more orders of magnitude performance gains compared to CPU systems.

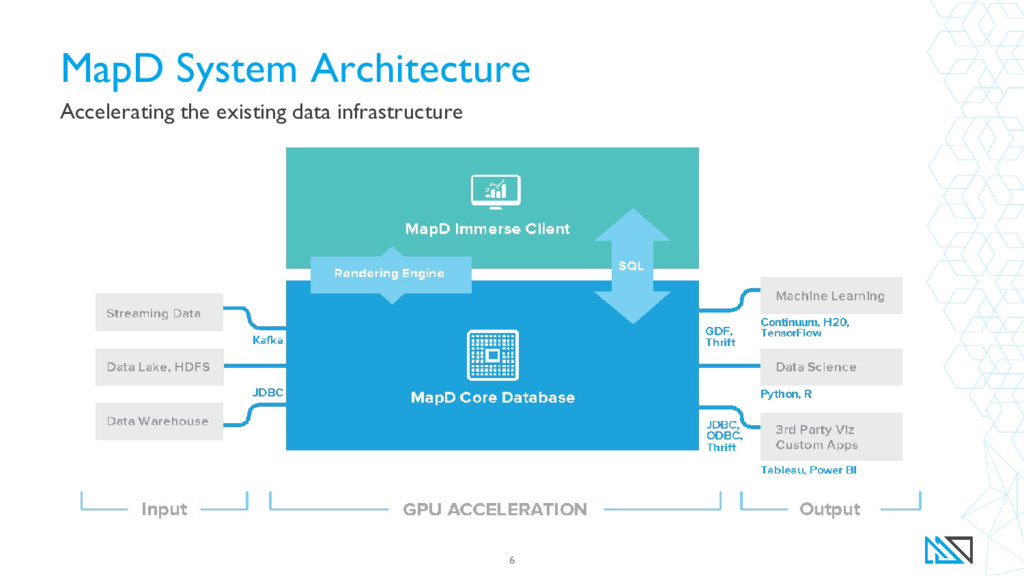
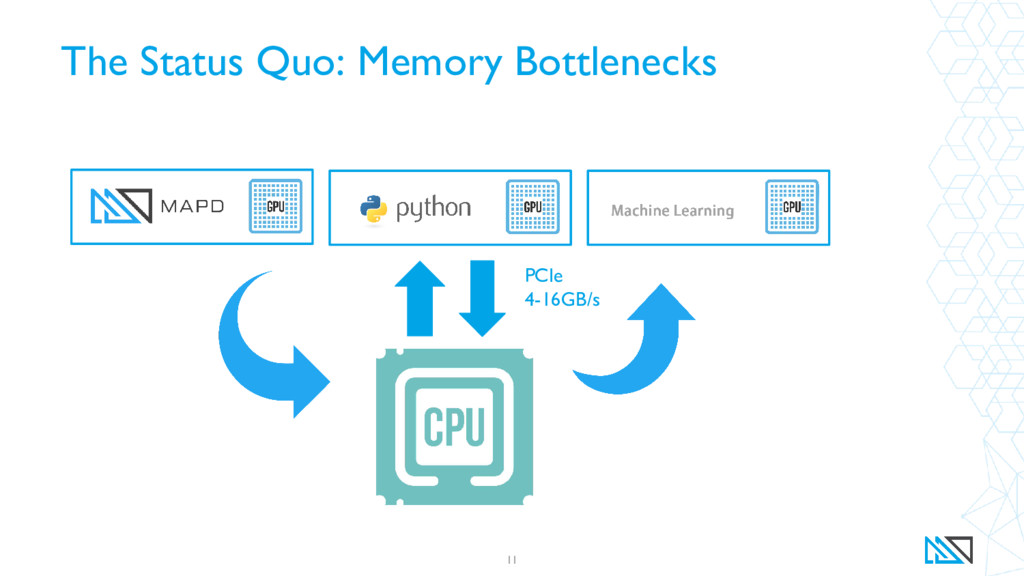
But for all of the innovation occurring in the GPU software ecosystem, the systems and platforms themselves still remain isolated from each other. Even though the individual components are seeing significant acceleration from running on the GPU, they must intercommunicate over the relatively thin straw of the PCIe and then through CPU memory.

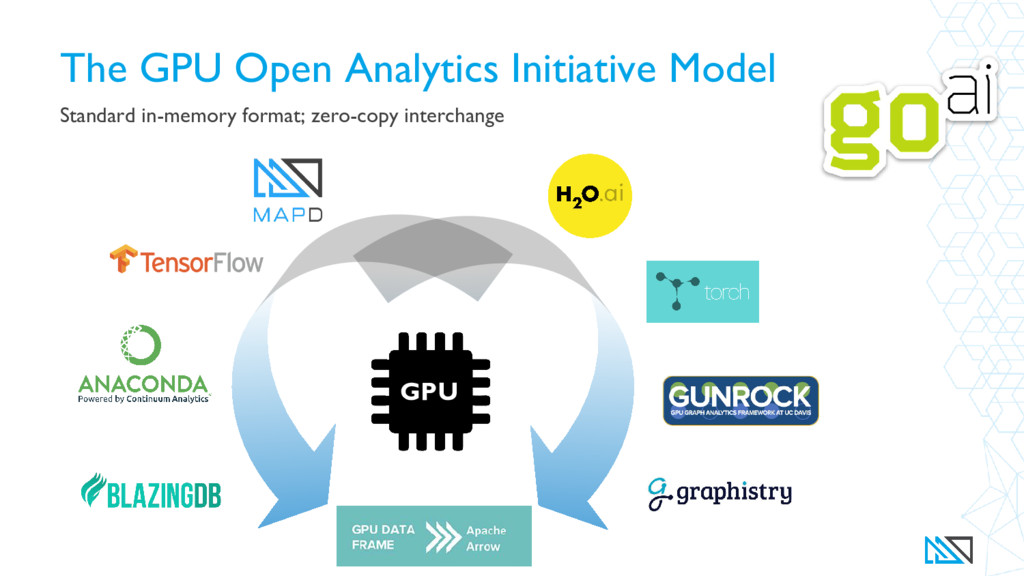
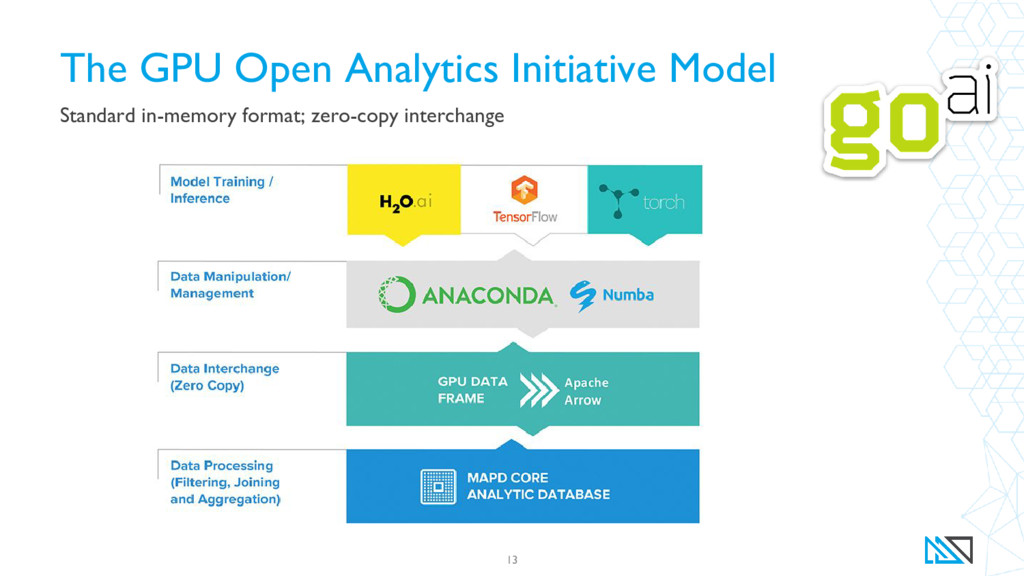
In this session, Aaron Williams will make a case for the open source community to enable efficient intra-GPU communication between different processes running on the GPUs. He will discuss (and provide examples) how this integration will allow developers to build new functions to cluster or perform analysis on queries, and will make seamless workflows that combine data processing, machine learning (ML), and visualization possible without ever needing to leave the GPU.

OmniSci

January 31, 2018
Tweet

More Decks by OmniSci

Other Decks in Technology

Transcript

  1. Aaron Williams VP of Global Community @_arw_ [email protected] /in/aaronwilliams/ /williamsaaron

    Christophe Viau Data Visualization Engineer [email protected] /in/christopheviau/ /biovisualize
  2. “Every business will become a software business, build applications, use

    advanced analytics and provide SaaS services.” - Smart CEO Guy has
  3. The Evolution of Data as a Weapon 4 Collect It

    Make It Actionable Make it Predictive
  4. MapD: Extreme Analytics 5 100x Faster Queries MapD Core The

    world’s fastest columnar database, built specifically for GPUs + Visualization at the Speed of Thought MapD Immerse A visualization front end that leverages the speed & rendering superiority of GPUs
  5. Core Density Makes a Huge Difference 8 GPU Processing CPU

    Processing 40,000 Cores 20 Cores *fictitious example Latency Throughput CPU 1 ns per task (1 task/ns) x (20 cores) = 20 tasks/ns GPU 10 ns per task (0.1 task per ns) x (40,000 cores) = 4,000 task per ns Latency: Time to do a task. | Throughput: Number of tasks per unit time.
  6. Query Compilation with LLVM 9 Traditional DBs can be highly

    inefficient • each operator in SQL treated as a separate function • incurs tremendous overhead and prevents vectorization MapD compiles queries w/LLVM to create one custom function • Queries run at speeds approaching hand-written functions • LLVM enables generic targeting of different architectures (GPUs, X86, ARM, etc). • Code can be generated to run query on CPU and GPU simultaneously 10111010101001010110101101010101 00110101101101010101010101011101 LLVM
  7. Keeping Data Close to Compute MapD maximizes performance by optimizing

    memory use 10 SSD or NVRAM STORAGE (L3) 250GB to 20TB 1-2 GB/sec CPU RAM (L2) 32GB to 3TB 70-120 GB/sec GPU RAM (L1) 24GB to 256GB 1000-6000 GB/sec Hot Data Speedup = 1500x to 5000x Over Cold Data Warm Data Speedup = 35x to 120x Over Cold Data Cold Data COMPUTE LAYER STORAGE LAYER Data Lake/Data Warehouse/System Of Record Speed Increases Space Increases
  8. Interactive Machine Learning Empowering the People in the Pipeline 14

    Personas in Analytics Lifecycle (Illustrative) Business Analyst Data Scientist Data Engineer IT Systems Admin Data Scientist / Business Analyst Data Preparation Data Discovery & Feature Engineering Model & Validate Predict Operationalize Monitoring & Refinement Evaluate & Decide GPUs MapD H20.ai MapD
  9. MapD Immerse Using a hybrid approach to speed and scale

    visualization 15 Basic charts are frontend rendered using D3 and other related toolkits Scatterplots, pointmaps + polygons are backend rendered using the Iris Rendering Engine on GPUs Geo-Viz is composited over a frontend rendered basemap
  10. Built for an open-source ecosystem 16 Extending multiple APIs •

    Dc.js (docs): Mapd-charting (docs) • Crossfilter: Mapd-crossfilter • Vega (editor): Mapd Raster • GPU DB Connector (docs) Part of an ecosystem • Related projects like Deck.gl • Building blocks like Mapbox, which uses Leaflet • Using smaller building blocks, like D3.js
  11. Try MapD It’s free and it’s easy 17 Play with

    the live demos: https://www.mapd.com/demos/ Try the Test Drive: https://mapd.io/testdrive-enterprise Install the Community Edition: https://www.mapd.com/platform/download-community/ Join our forums: https://community.mapd.com/ Review these slides: https://speakerdeck.com/mapd
  12. © MapD 2017 MapD Test Drive 18 Try it now:

    mapd.io/testdrive-enterprise Use our sample data or upload your own Try our dashboards or create your own The easiest way to try a complete MapD instance
  13. AWS Credits Available 19 Free GPU Compute! We’re looking for

    interesting use cases. Email Aaron Williams ([email protected]) with your ideas!
  14. Aaron Williams VP of Global Community @_arw_ [email protected] /in/aaronwilliams/ /williamsaaron

    Christophe Viau Data Visualization Engineer [email protected] /in/christopheviau/ /biovisualize