Upgrade to Pro — share decks privately, control downloads, hide ads and more …

Creating Custom Visualizations and Applications Using OmniSci Workshop

OmniSci
October 21, 2019

Creating Custom Visualizations and Applications Using OmniSci Workshop

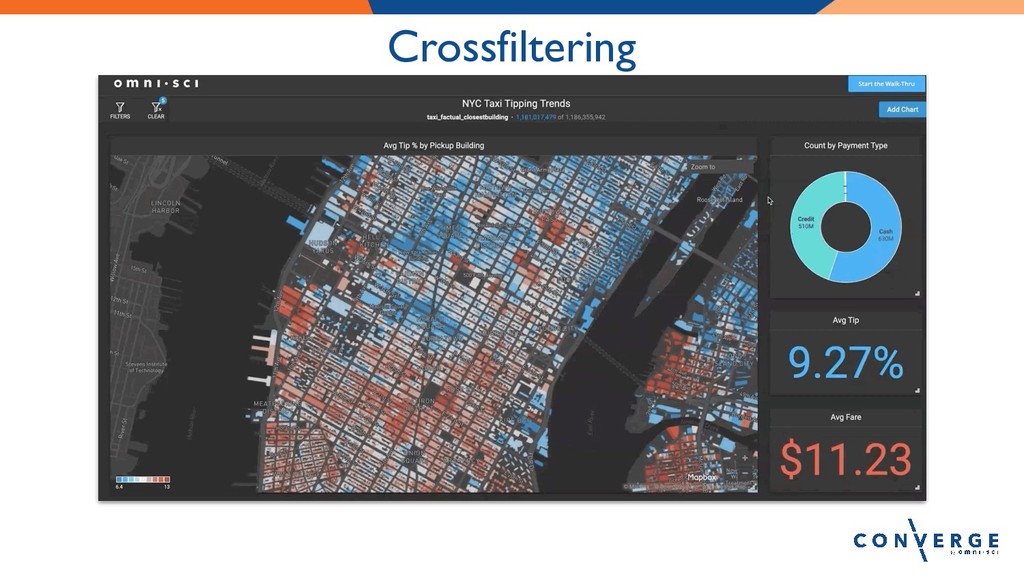
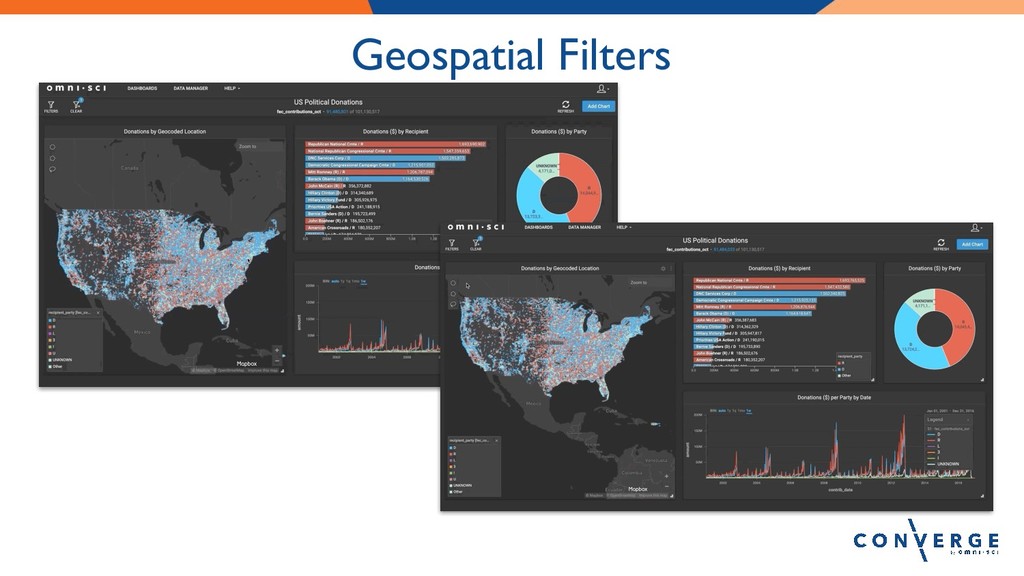
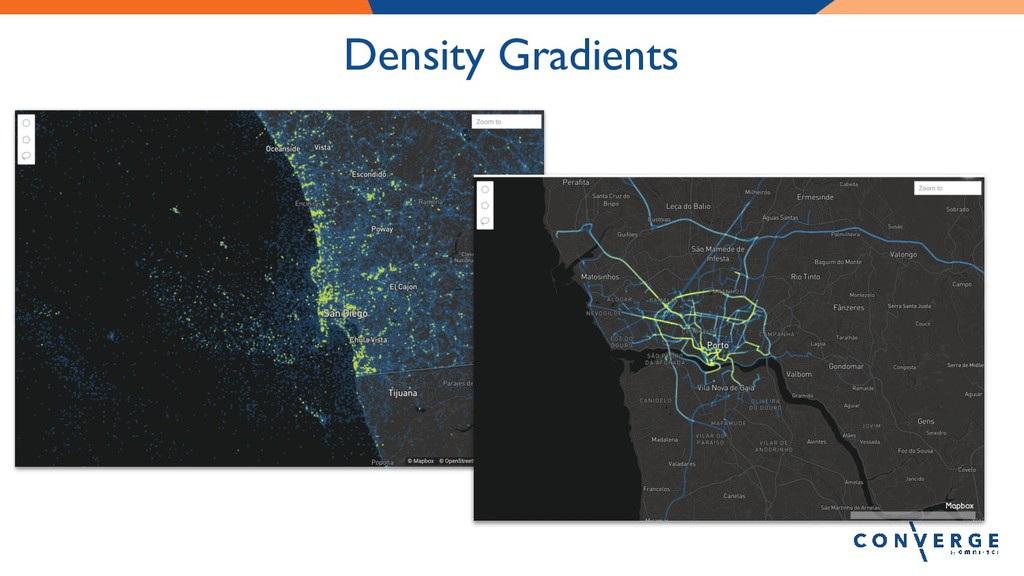
Attendees will learn how to create their own custom visualizations and applications using mapd-connector and other related JavaScript libraries. Topics such as using OmniSci Render for large scale geospatial charting, cross filtering charts and optimizing queries to provide a fluid-looking data-intensive application will all be discussed.

OmniSci

October 21, 2019
Tweet

More Decks by OmniSci

Other Decks in Technology

Transcript

  1. Immerse Exploration & Custom App Development with OmniSci Converge 2019,

    Mountain View Sean Keegan, Caitlin Wolters, & Matt Torok, OmniSci | October 21st, 2019
  2. Agenda • Introduction to OmniSci • Immerse Visualization Platform •

    Geospatial Features in OmniSci • Lab: Immerse Exploration • OmniSci Charting Libraries • Lab: Building web applications using OmniSci charting libraries
  3. Data Grows Faster Than CPU Processing Data Growth 40% per

    year CPU Processing Power 20% per year
  4. Three Ways to Get Started GitHub repo OPEN SOURCE OmniSci

    as a service OMNISCI CLOUD Contact sales ENTERPRISE
  5. Let’s dive into Immerse! • Create a Cloud account by

    going to this link: https://bit.ly/2MY7iTq • Create a new dashboard using Tutela dataset. ◦ Add charts that answer the following questions ▪ Which city is better for Sprint customers: Chicago or Seattle? ▪ How many records are there for Verizon in 2019? ▪ Questions from the Data Challenge! • Feel free to play with other preloaded datasets or import a different dataset from our Data Library
  6. Helpful Resources • Immerse documentation • OmniSci Demos ◦ All

    of the demos (except Tweetmap) are regular Immerse dashboards • Immerse Chart Types • Measures vs Dimensions ◦ Measure - values or aggregated data ◦ Dimension - categorizes measures
  7. mapd-connector • JavaScript Library for connecting to OmniSci Core database

    • Can execute queries, manage the database, and perform all other DB operations • Communicates over Apache Thrift, the same protocol internal OmniSci apps use • The start of every custom OmniSci app GitHub repo | Documentation | Example
  8. mapd-charting • Charting built to work natively with OmniSci Core

    DB and crossfilter • Based on open-source DC.js library (but diverged since forking) • Uses D3.js for creating browser-based charts • Leverages OmiSci Core Rendering to display raster charts GitHub repo | Documentation | Example
  9. mapd-crossfilter • JavaScript library for connecting multiple charts for interactively

    “cross” filtering • Allows you to select data on one chart, and filter the data displayed on other charts • Forked from existing open-source crossfilter library GitHub repository
  10. Testing mapd-charting with your Cloud instance To test the charting

    API with your OmniSci cloud instance, you will need to set the user and password variables by creating the write API key under the Developer tab in the Cloud Settings interface as shown in the caption below.
  11. Starter kit • Go to https://bit.ly/32xGCQ8 and clone the starter

    kit repository. • What’s inside: ◦ HTML/CSS Skeleton ◦ All of the charting libraries pre-bundled into one file: main.js ▪ mapd-charting, mapd-crossfilter, and mapd-connector ◦ Starter code for creating some basic charts
  12. function init() { // This is where everything comes together.

    // 1. Initialize a new connection with Mapd-connector to our OmniSci cloud database // 2. Then hook up crossfilter with our data // 3. Then render our charts. new MapdCon() .protocol("https") .host("use2-api.mapd.cloud") .port("443") .dbName("mapd") .user("API Key Name from cloud instance SETTINGS") .password("API Key Secret from cloud instance SETTINGS") .connect(function(error, con) { crossfilter.crossfilter(con, "tutela_converge").then(cf => { createCharts(cf, con); }); }); }
  13. • Make a third chart using the pre-connected Tutela data

    set • Use mapd-connector to find all the tables available • Create 2+ charts using a different table Challenges