Upgrade to Pro — share decks privately, control downloads, hide ads and more …

RailsConf 2015: Actionable Performance Analytics

RailsConf 2015: Actionable Performance Analytics

Performance testing + Data Instrumentation + Machine Learning = predictive performance analytics

Avatar for paolamoretto

paolamoretto

April 23, 2015
Tweet

Other Decks in Technology

Transcript

  1. A new kind of analytics: Actionable Performance Analysis Paola Moretto,

    co-founder at Nouvola @paolamoretto3 @nouvolatech www.nouvola.com
  2. Something about me  Developer turned entrepreneur  20+ years

    high-tech  Love solving technical challenges Co-founder Nouvola @paolamoretto3
  3. You should know speed is product feature number 1 -

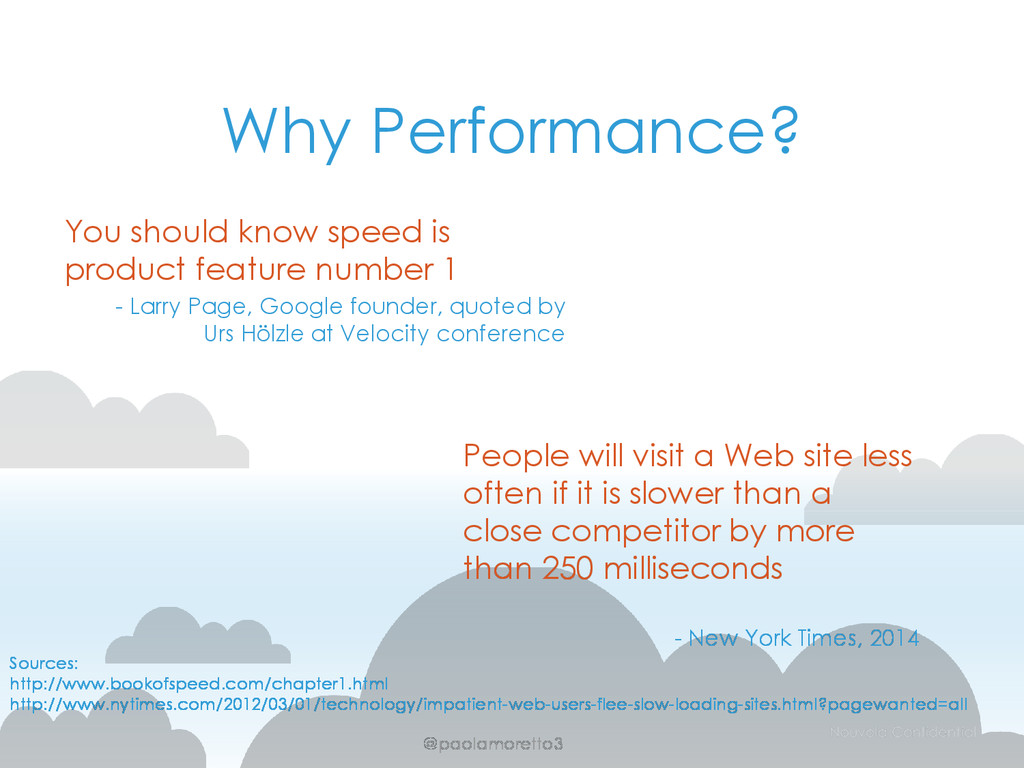
    Larry Page, Google founder, quoted by Urs Hölzle at Velocity conference Why Performance? People will visit a Web site less often if it is slower than a close competitor by more than 250 milliseconds - New York Times, 2014 Sources: http://www.bookofspeed.com/chapter1.html http://www.nytimes.com/2012/03/01/technology/impatient-web-users-flee-slow-loading-sites.html?pagewanted=all @paolamoretto3
  4. DevOps and performance Has become part of the cloud challenge

    Focus on non functional testing @paolamoretto3
  5. Many types of monitoring Stack monitoring NewRelic AppDynamic Infrastructure monitoring

    CloudWatch Logs aggregation Loggly, CloudTrail User behavior Splunk, ElasticSearch High frequency metrics SignalFX And many more… @paolamoretto3
  6. Monitoring is not enough • Live traffic is noisy •

    Hard to troubleshoot, don’t know what the users are going to do • After the fact @paolamoretto3
  7. “Monitoring is like calling AAA after the accident. You need

    to prevent the accident instead.” @paolamoretto3
  8. Different types of data Deploy Live Monitoring Preproduction / Staging

    Synthetic traffic Performance testing NOUVOLA @paolamoretto3
  9. Performance testing • Users simulated but traffic is real (synthetic)

    • Total control over amount of traffic and user scenarios / workflows • End-to-end user metrics – KPI for the user experience @paolamoretto3
  10.  Realistic scenarios  Any load, any device, any geo

     End-to-end User experience What to test GOAL: predict what is going to happen
  11.  User performance metrics  End to End response timing

    Throughput: number of successful requests Error rate What to measure GOAL: resolve issues before deployment
  12. • My tests are telling me that when I have

    10,000 concurrent users (/sec) on my platform, the response time deteriorates from 400ms to 2.5s @paolamoretto3
  13. Close the feedback loop: from identifying the issue to fixing

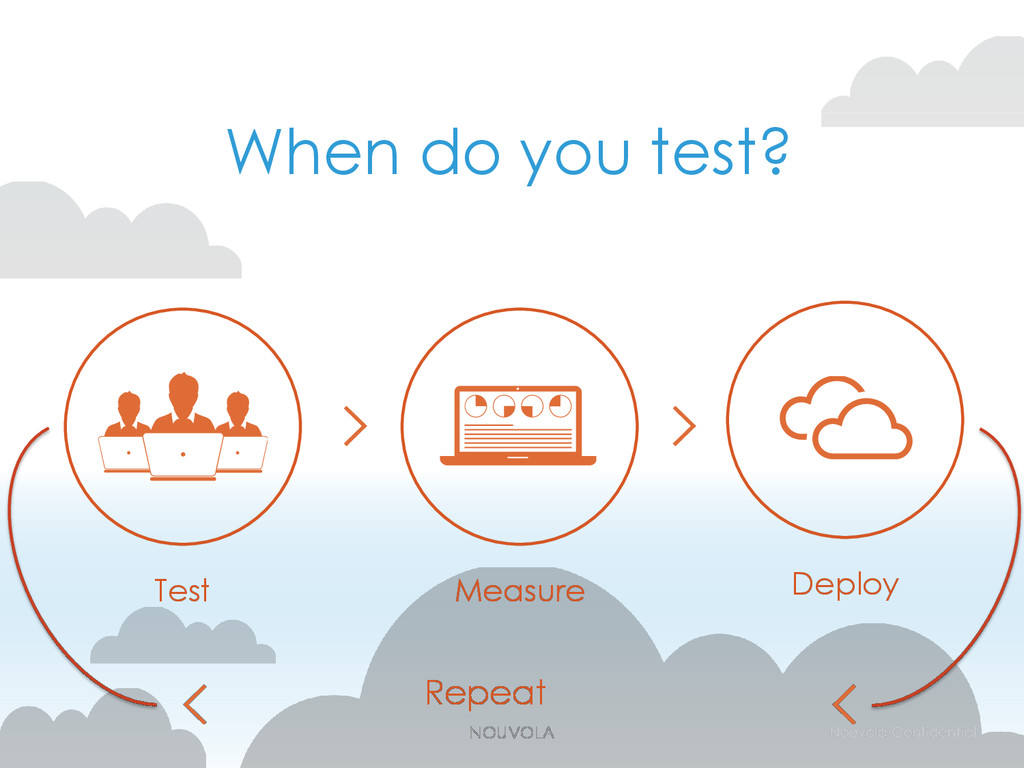
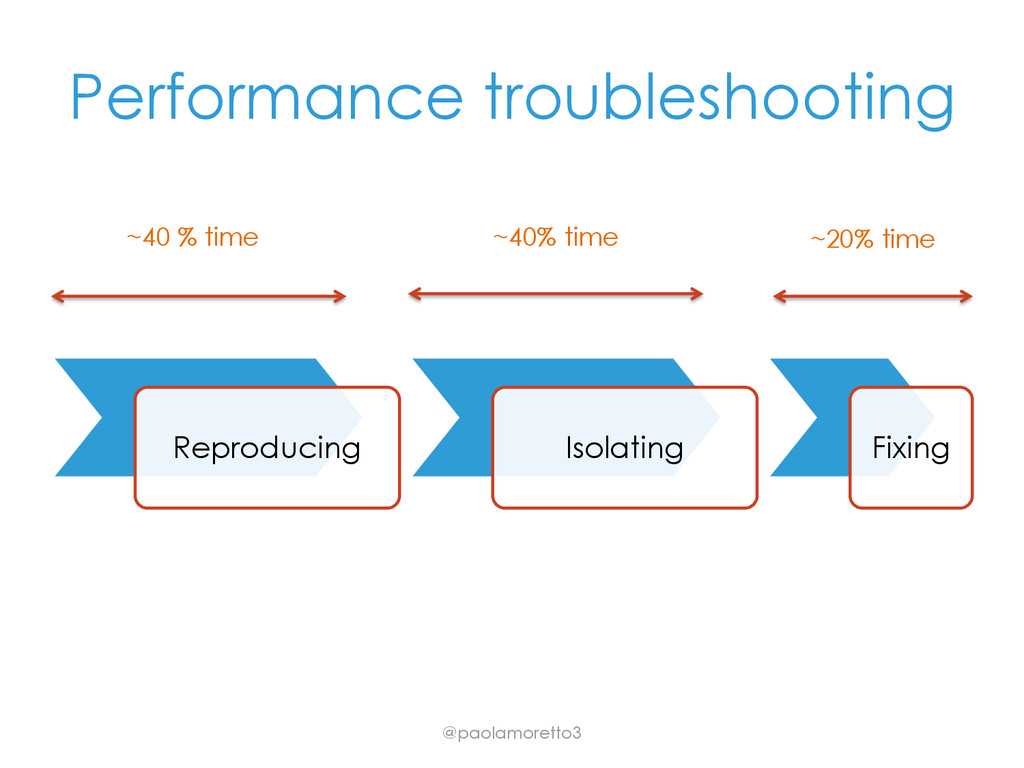
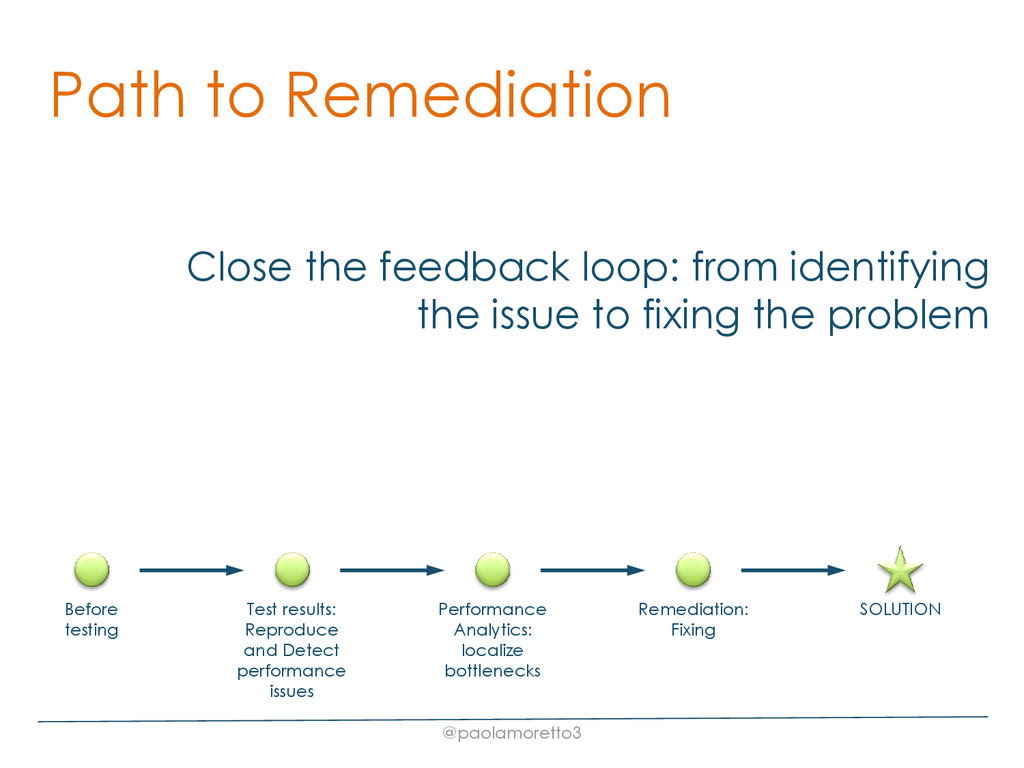
    the problem Before testing Test results: Reproduce and Detect performance issues Performance Analytics: localize bottlenecks Remediation: Fixing SOLUTION Path to Remediation @paolamoretto3
  14. Predictive Performance Analytics Objective: Identify leading indicators of performance issues

    Accelerate troubleshooting process Get actionable data @paolamoretto3
  15. General description • Increase in traffic causes an increase in

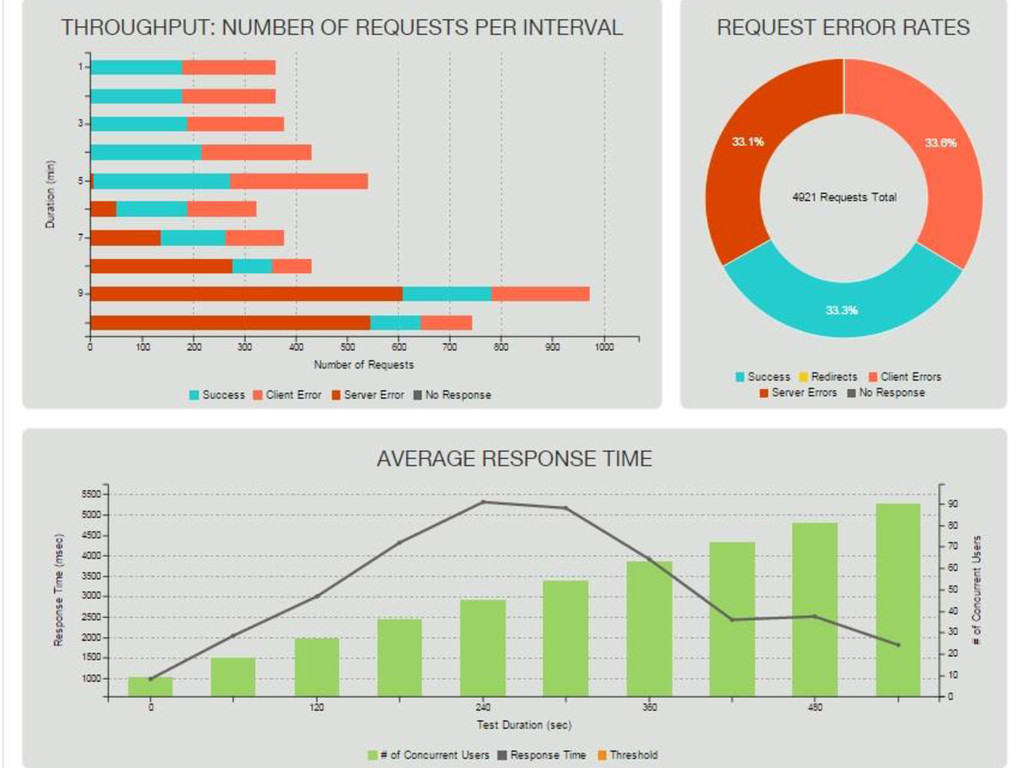
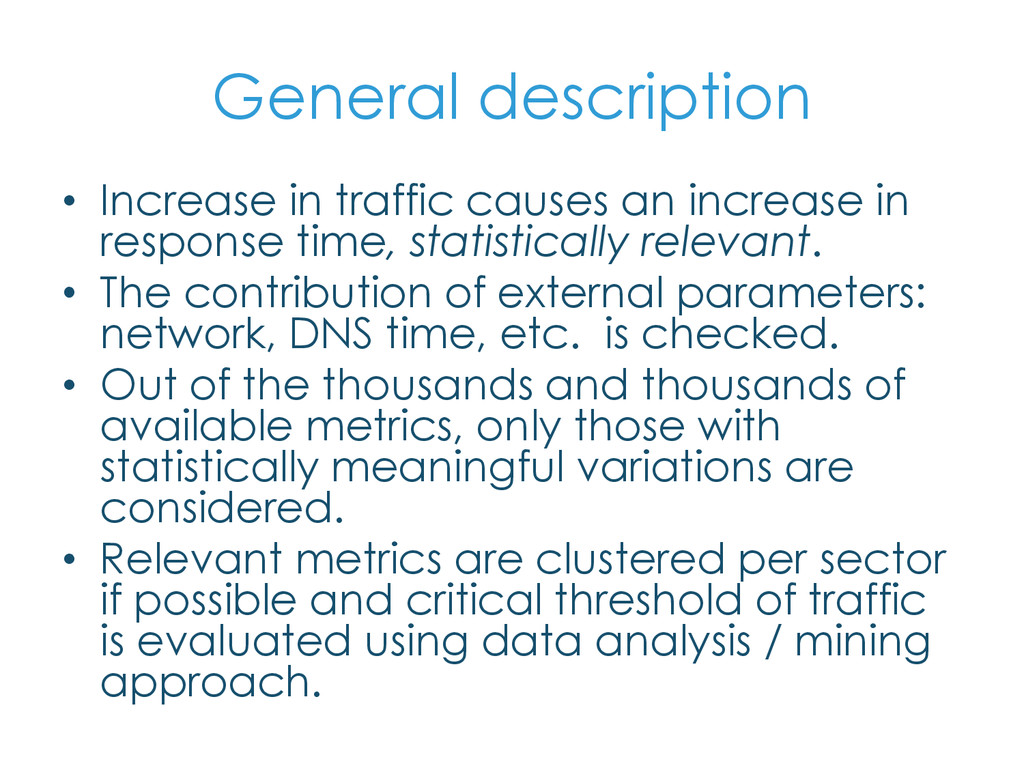
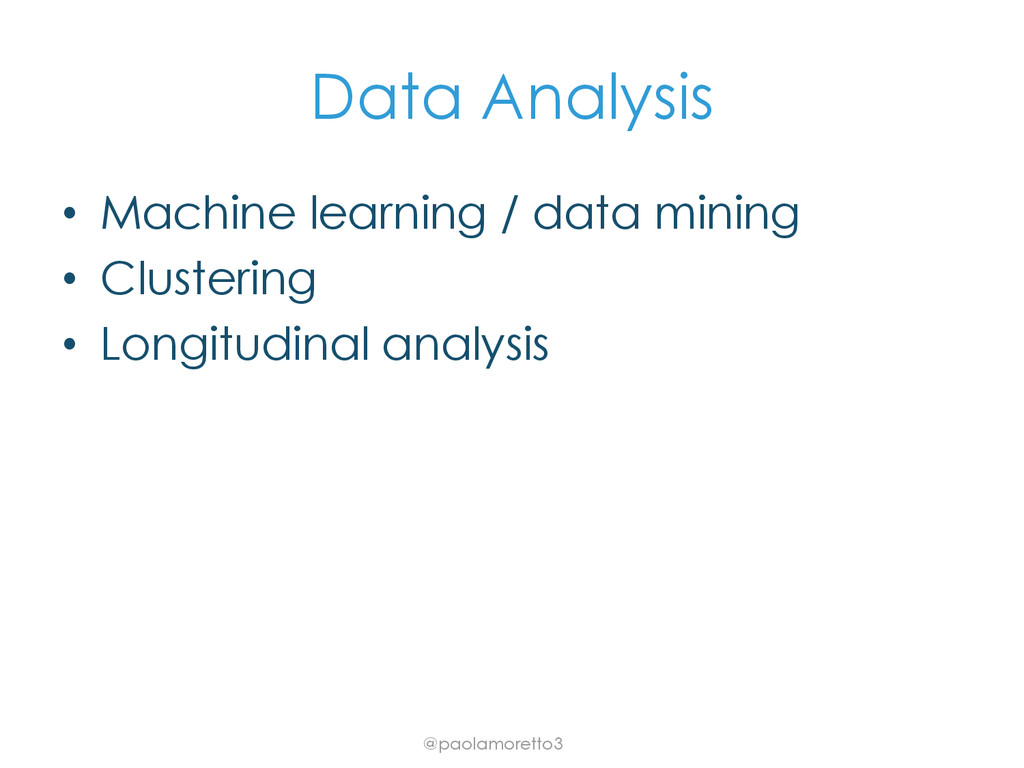
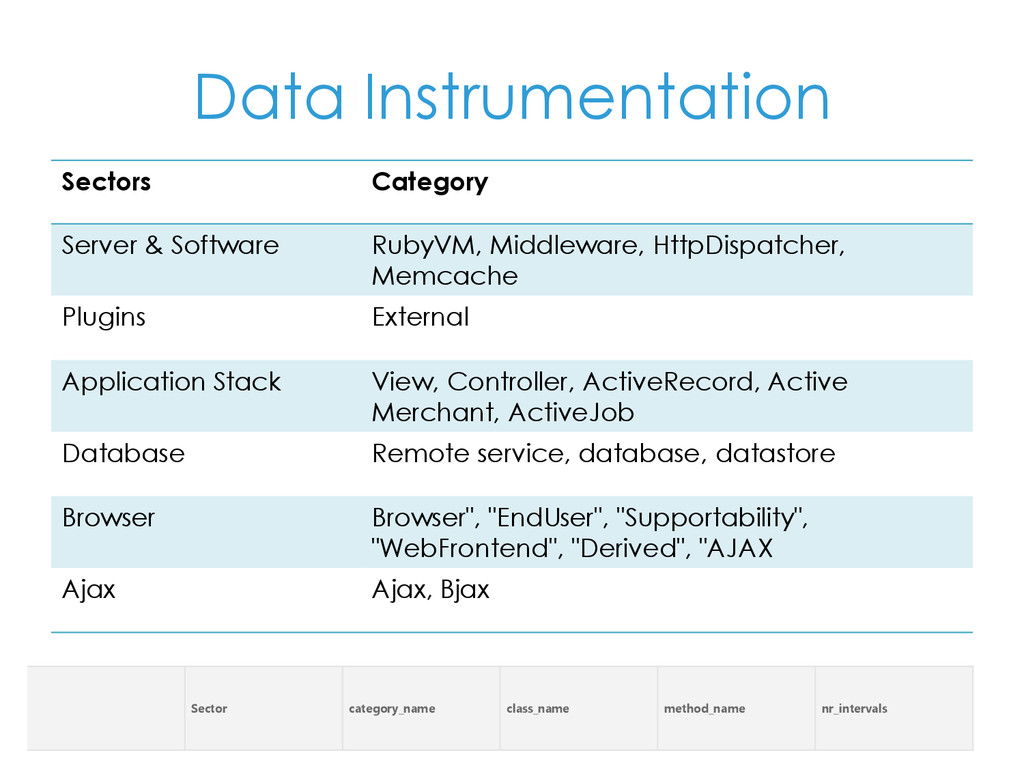
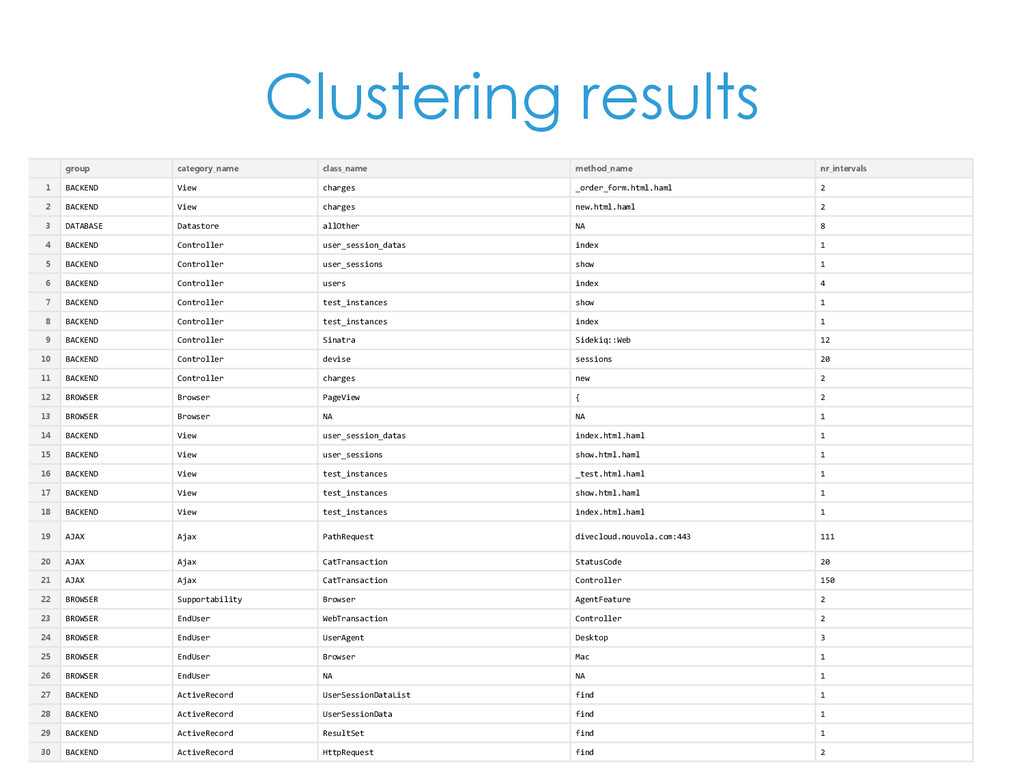
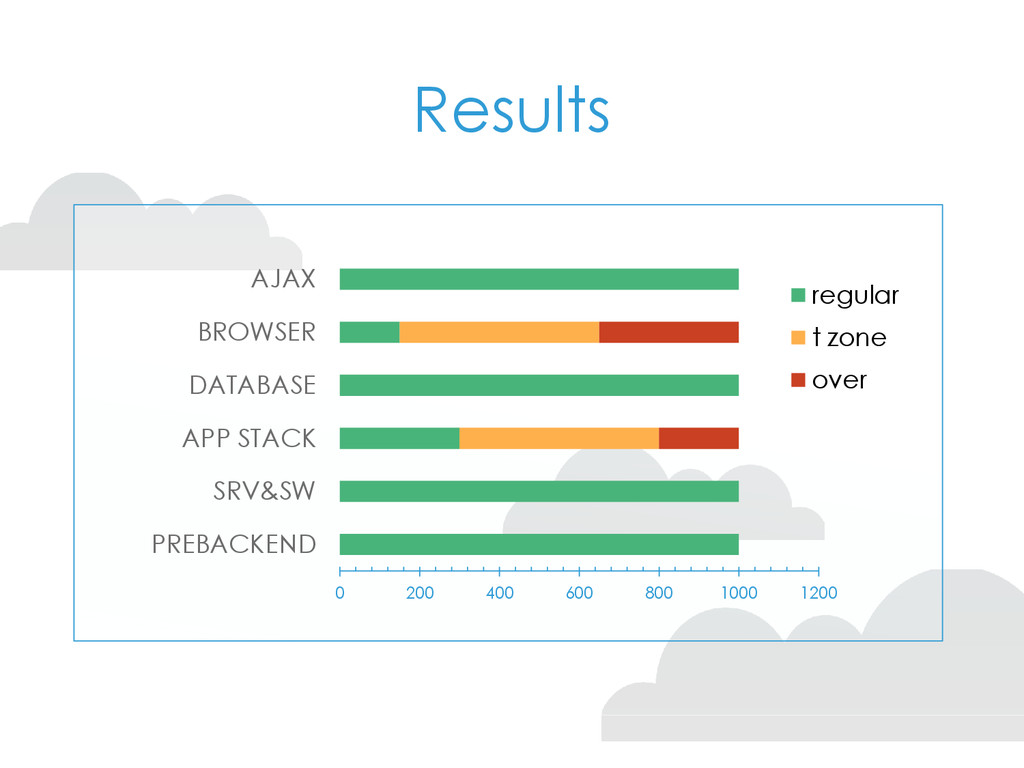
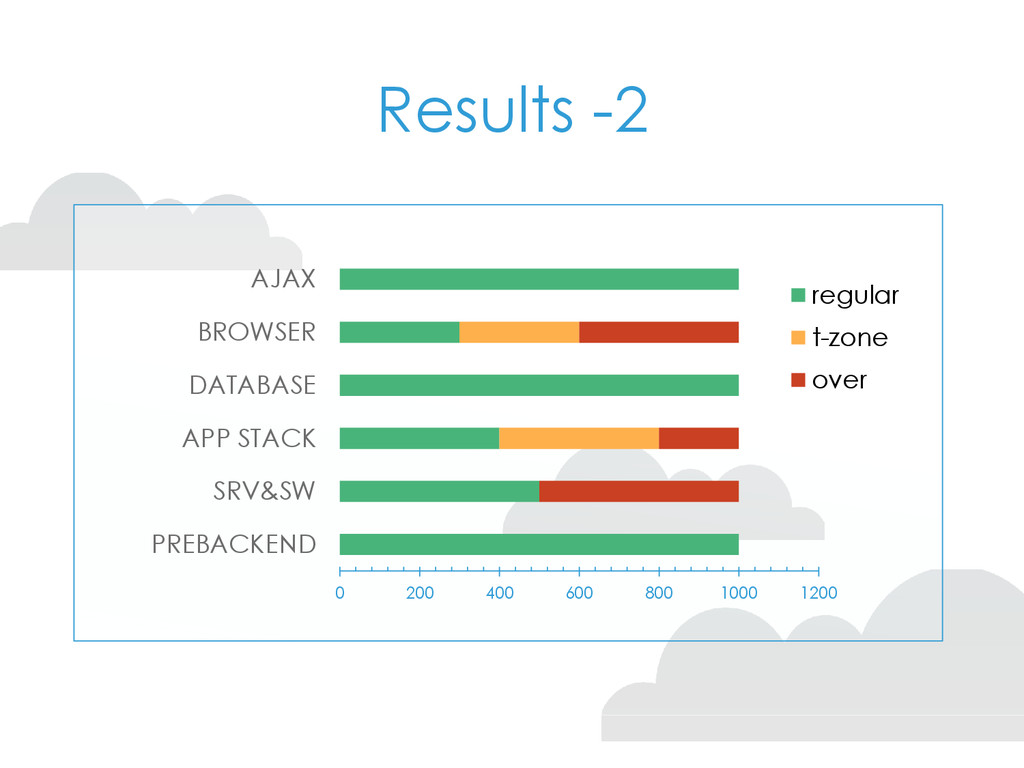
    response time, statistically relevant. • The contribution of external parameters: network, DNS time, etc. is checked. • Out of the thousands and thousands of available metrics, only those with statistically meaningful variations are considered. • Relevant metrics are clustered per sector if possible and critical threshold of traffic is evaluated using data analysis / mining approach.
  16. Data Analysis • Machine learning / data mining • Clustering

    • Longitudinal analysis @paolamoretto3
  17. Web application • id "658" • virtual_users “1000" • name

    "DC 1000 LR" • traffic_model "0" • duration "10" • uris "{Transaction A}" • user_id "42" • run_count "2" • run_last NA • created_at "2014-10-11 06:26:32" • updated_at "2014-10-13 17:14:25" • data_center "1" • credential_id "30" • user_session_id "146" @paolamoretto3
  18. Data Instrumentation Sectors Category Server & Software RubyVM, Middleware, HttpDispatcher,

    Memcache Plugins External Application Stack View, Controller, ActiveRecord, Active Merchant, ActiveJob Database Remote service, database, datastore Browser Browser", "EndUser", "Supportability", "WebFrontend", "Derived", "AJAX Ajax Ajax, Bjax Sector category_name class_name method_name nr_intervals
  19. Clustering results group category_name class_name method_name nr_intervals 1 BACKEND View

    charges _order_form.html.haml 2 2 BACKEND View charges new.html.haml 2 3 DATABASE Datastore allOther NA 8 4 BACKEND Controller user_session_datas index 1 5 BACKEND Controller user_sessions show 1 6 BACKEND Controller users index 4 7 BACKEND Controller test_instances show 1 8 BACKEND Controller test_instances index 1 9 BACKEND Controller Sinatra Sidekiq::Web 12 10 BACKEND Controller devise sessions 20 11 BACKEND Controller charges new 2 12 BROWSER Browser PageView { 2 13 BROWSER Browser NA NA 1 14 BACKEND View user_session_datas index.html.haml 1 15 BACKEND View user_sessions show.html.haml 1 16 BACKEND View test_instances _test.html.haml 1 17 BACKEND View test_instances show.html.haml 1 18 BACKEND View test_instances index.html.haml 1 19 AJAX Ajax PathRequest divecloud.nouvola.com:443 111 20 AJAX Ajax CatTransaction StatusCode 20 21 AJAX Ajax CatTransaction Controller 150 22 BROWSER Supportability Browser AgentFeature 2 23 BROWSER EndUser WebTransaction Controller 2 24 BROWSER EndUser UserAgent Desktop 3 25 BROWSER EndUser Browser Mac 1 26 BROWSER EndUser NA NA 1 27 BACKEND ActiveRecord UserSessionDataList find 1 28 BACKEND ActiveRecord UserSessionData find 1 29 BACKEND ActiveRecord ResultSet find 1 30 BACKEND ActiveRecord HttpRequest find 2
  20. Results 0 200 400 600 800 1000 1200 PREBACKEND SRV&SW

    APP STACK DATABASE BROWSER AJAX regular t zone over
  21. Results -2 0 200 400 600 800 1000 1200 PREBACKEND

    SRV&SW APP STACK DATABASE BROWSER AJAX regular t-zone over
  22. Summary  Speed is product feature number 1  Performance

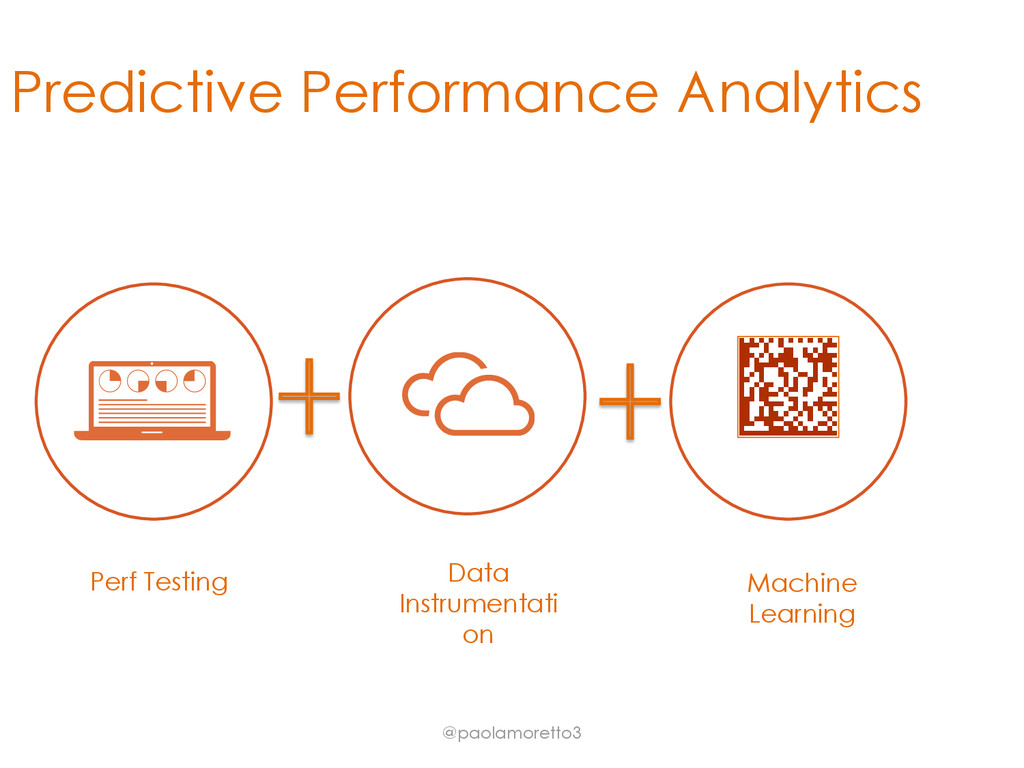
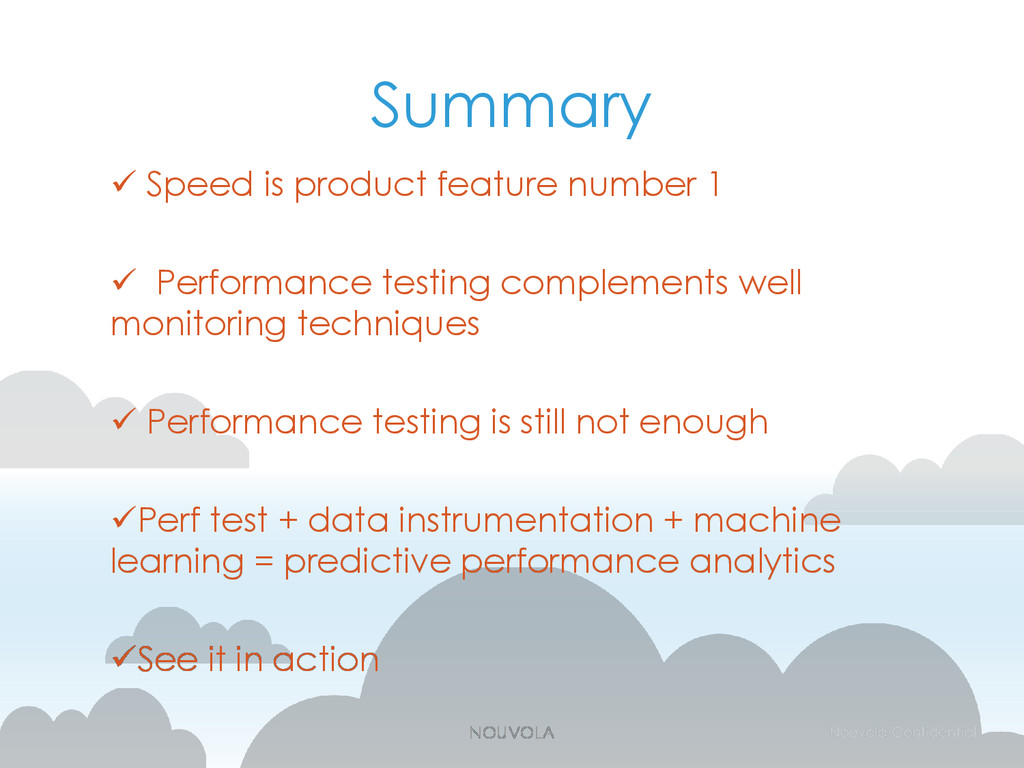
    testing complements well monitoring techniques  Performance testing is still not enough Perf test + data instrumentation + machine learning = predictive performance analytics See it in action NOUVOLA