Upgrade to Pro — share decks privately, control downloads, hide ads and more …

Modern Monitoring for .NET

Modern Monitoring for .NET

​In the world of .NET, monitoring your application has traditionally been to install WMI performance counters and let Operations sort it out. This means learning about how to install performance counters, how to do this via scripts in the cloud, how to get the data out of them, how to alert on them, and how to visualise them in something other than PerfMon. Not to mention how to debug why they break down under load.

Anyone who has done this (that hasn't given up in frustration!) knows that it's no simple task.

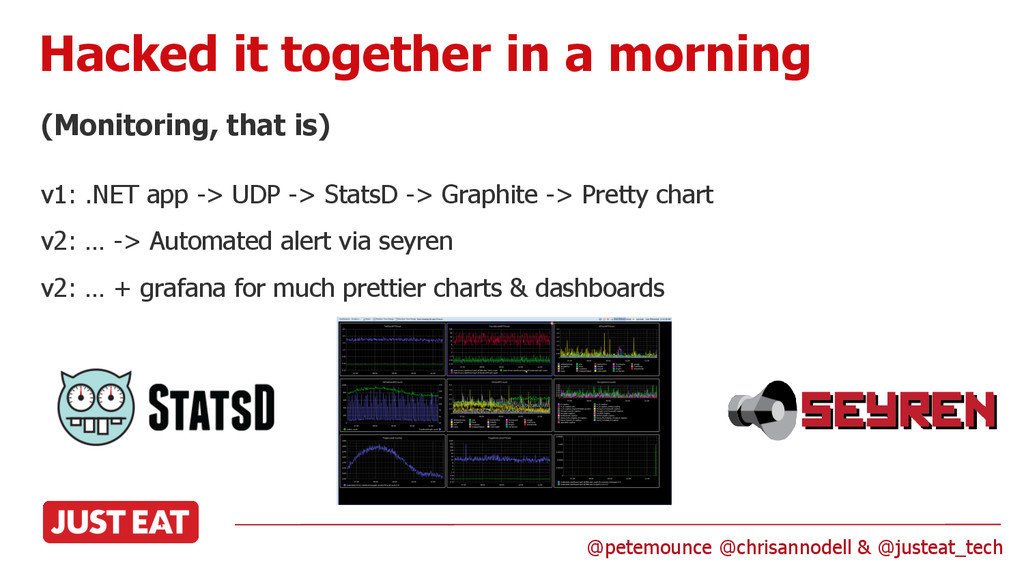
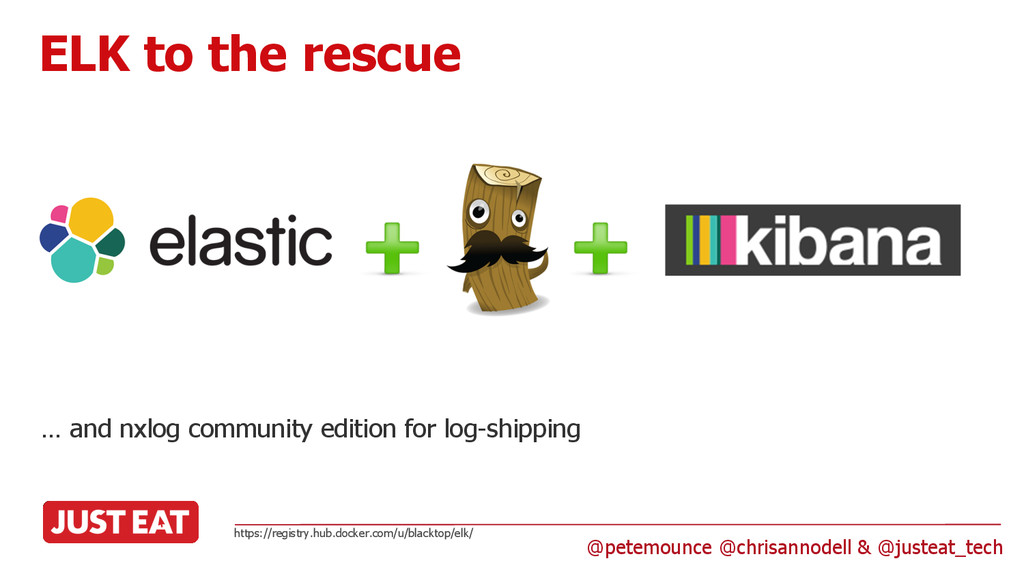
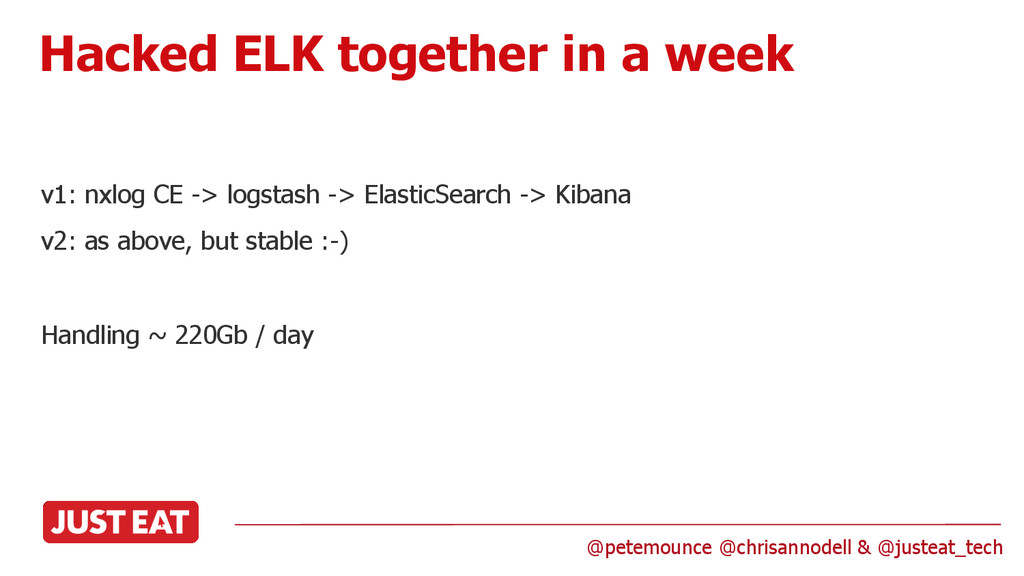
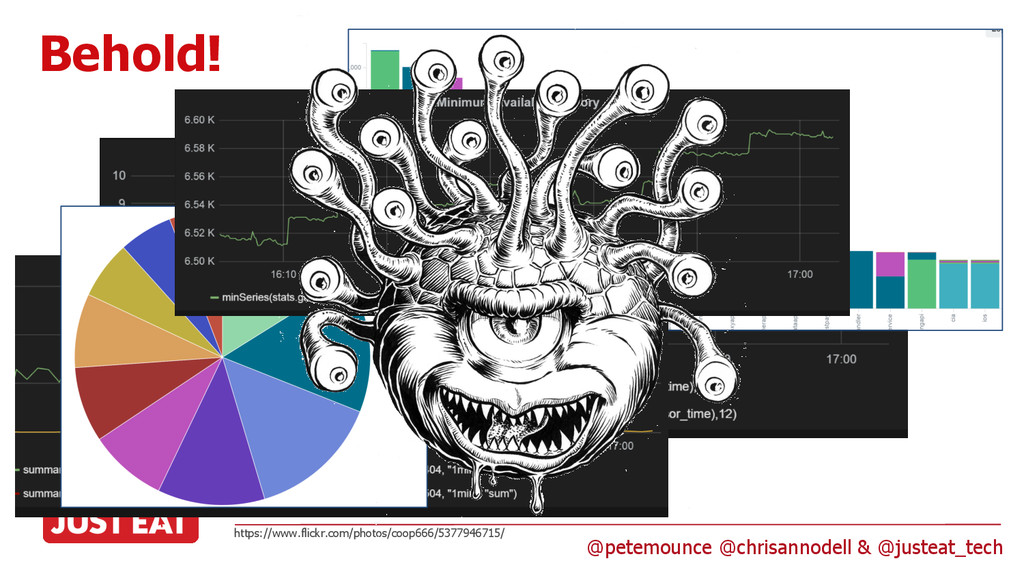
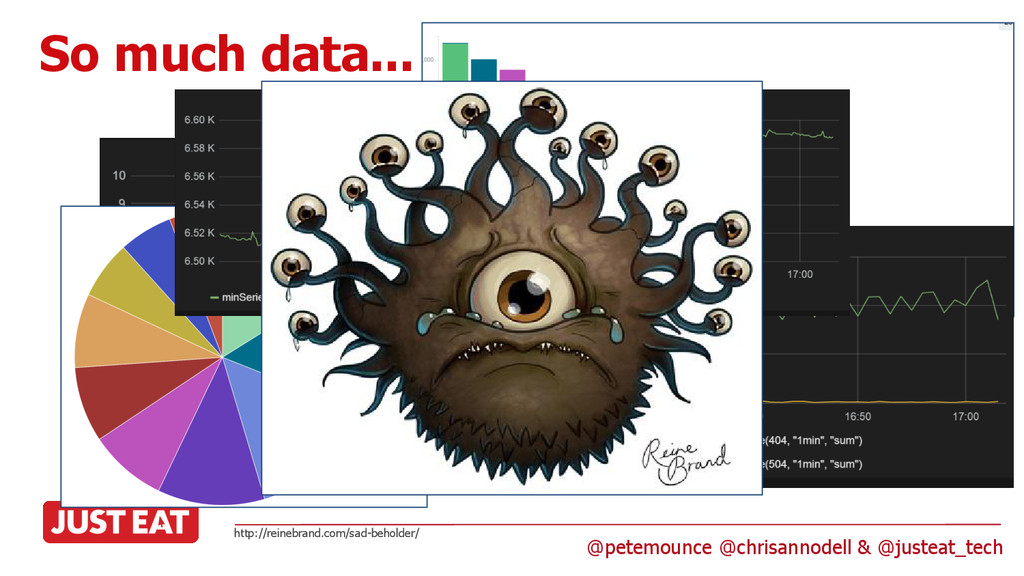
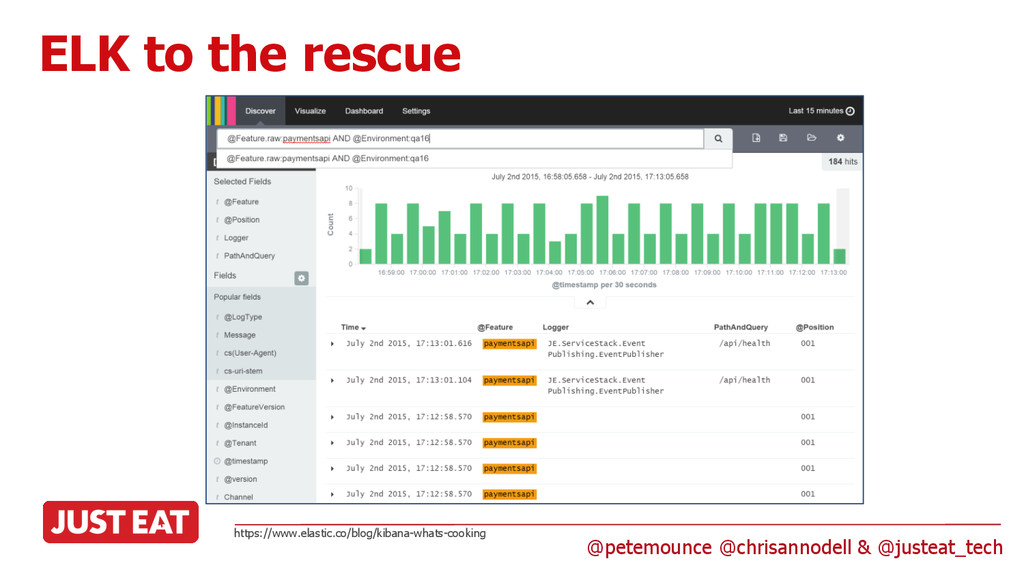
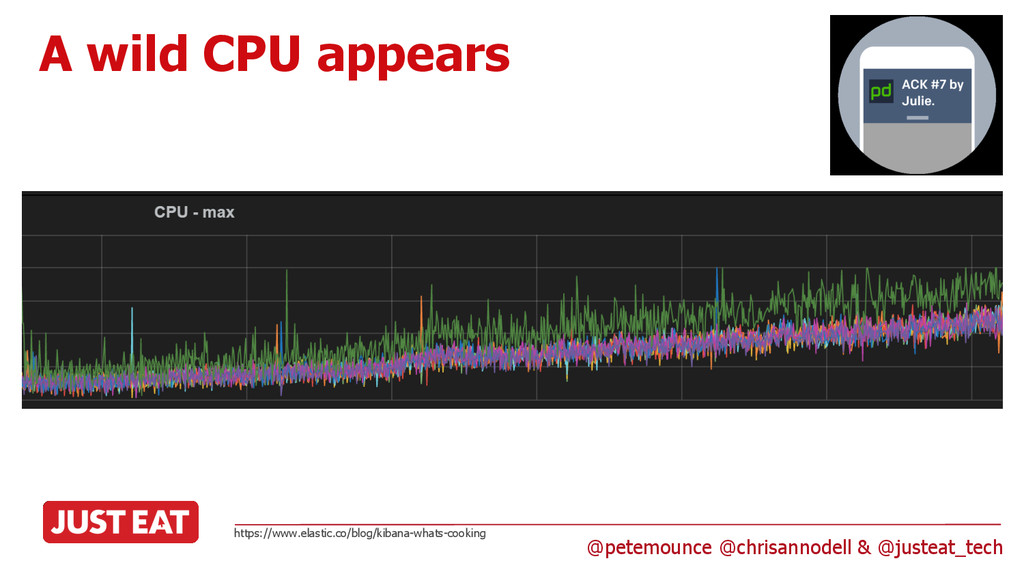
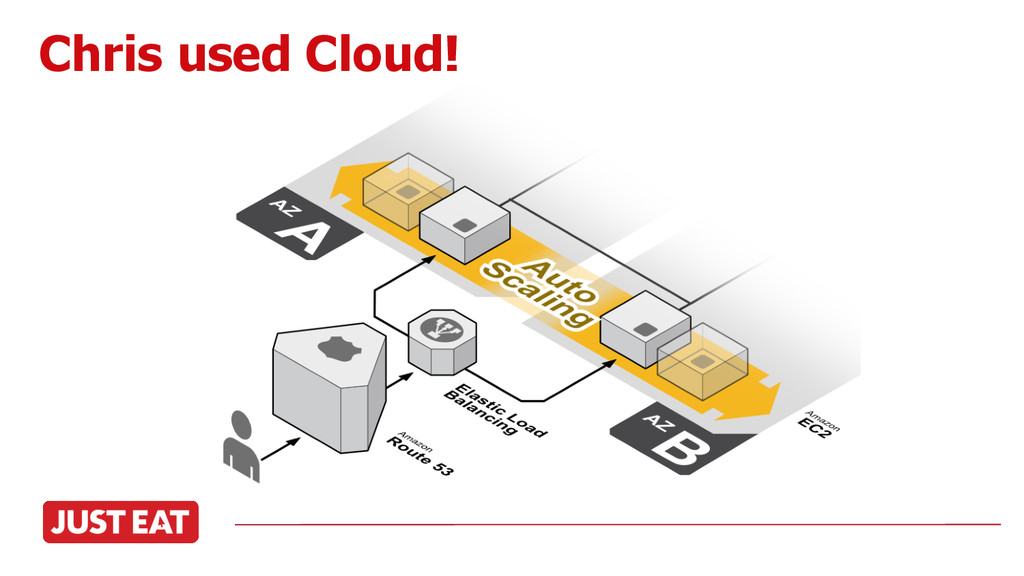
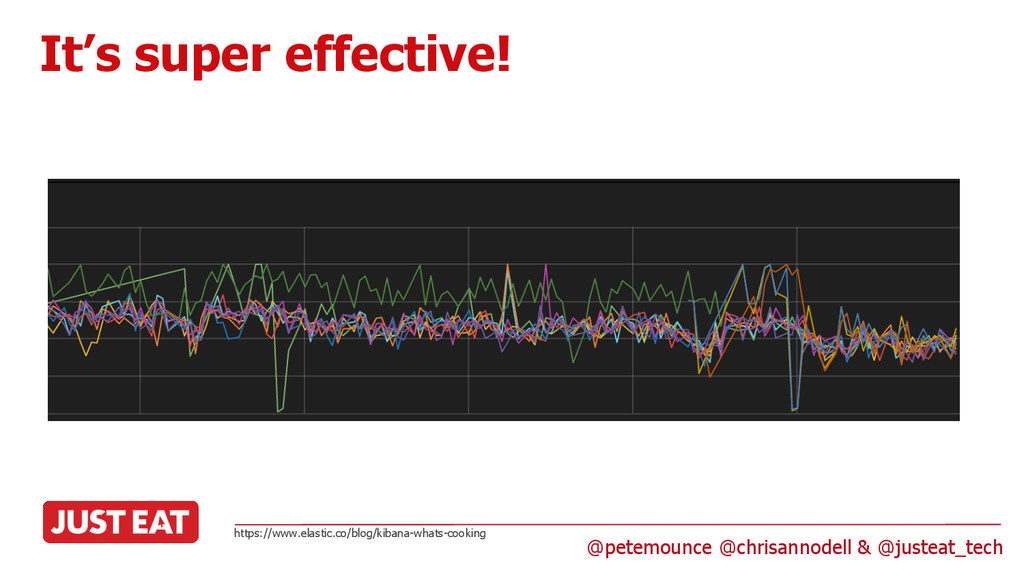
Chris and Pete will introduce the Open Source tools used at JUST EAT (and various others) in their high-volume, cloud-native, buzzword compliant microservice-based .NET platform. This talk will include a whirlwind tour of our tooling: statsd, graphite, grafana, logstash, elasticsearch, kibana as well as some culture changes that using these tools unlocked.

Peter Mounce

July 03, 2015
Tweet

More Decks by Peter Mounce

Other Decks in Technology

Transcript

  1. Knowing what went bump in Production - Modern monitoring in

    .NET @petemounce @chrisannodell & @justeat_tech
  2. Hacked it together in a morning v1: .NET app ->

    UDP -> StatsD -> Graphite -> Pretty chart v2: … -> Automated alert via seyren v2: … + grafana for much prettier charts & dashboards (Monitoring, that is) @petemounce @chrisannodell & @justeat_tech
  3. Spent next 4 months productionising (… but you wouldn’t have

    to) @petemounce @chrisannodell & @justeat_tech
  4. Hacked ELK together in a week v1: nxlog CE ->

    logstash -> ElasticSearch -> Kibana v2: as above, but stable :-) Handling ~ 220Gb / day @petemounce @chrisannodell & @justeat_tech
  5. Hacked ELK together in a week v1: nxlog CE ->

    logstash -> ElasticSearch -> Kibana v2: as above, but stable :-) Handling ~ 220Gb / day @petemounce @chrisannodell & @justeat_tech
  6. 3 years later … we know we’ve got issues before

    customers do (usually) @petemounce @chrisannodell & @justeat_tech
  7. Apps: “I’m healthy! I’m healthy!” public HealthCheckResult Execute() { var

    result = new HealthCheckResult(Name); try { var customThing = Run(result); EnrichResultWith(result, customThing); } catch (Exception exception) { result = ResultFromException(exception); _logger.Error(() => new { Log = "HealthCheck Error", Name, Error = exception.GetBaseException() }.ToJson()); } return result; } … and an alert for when they say “HELP ME!” @petemounce @chrisannodell & @justeat_tech
  8. Apps: “I’m healthy! I’m healthy!” public class LoadFromDynamoDbHealthCheck : HealthCheckBase<bool>

    { private readonly IDataAccess _dataAccess; public LoadFromDynamoDbHealthCheck(IDataAccess dataAccess, Logger logger) : base(logger) { Name = "LoadFromDynamoDbHealthCheck"; _dataAccess = dataAccess; } protected override bool Run(HealthCheckResult result) { _dataAccess.Load<ConsumerDeviceTokens>("-2"); return true; } } … and an alert for when they say “HELP ME!” @petemounce @chrisannodell & @justeat_tech
  9. Apps: “I’m healthy! I’m healthy!” Not just for production -

    helps 1st checkout … and an alert for when they say “HELP ME!” @petemounce @chrisannodell & @justeat_tech
  10. Publish a metric Counter: uk.payments.attempts:1|c Timer: uk.payments.attempts:34|ms Gauge: uk.payments.cpu:47|g Then,

    roughly: var client = new UdpClient(_hostNameOrAddress, _port) { Client = { SendBufferSize = 0 } }; client.Client.SendPacketsAsync(data); If you can write a string to a UDP socket... @petemounce @chrisannodell & @justeat_tech
  11. How to be on call @petemounce @chrisannodell & @justeat_tech 1.

    Get an alert 2. Log on & look at alert -> charts -> dashboards -> logs 3. Establish IMPACT of the problem 4. Provide options to mitigate a. Turn off a feature? b. DO NOTHING -> risk of change outweighs reward? 5. Take action (which might be “escalate higher for help”) 6. Repeat 7. Do root cause analysis AFTER the issue has been resolved