Upgrade to Pro — share decks privately, control downloads, hide ads and more …

Monitoring with Sensu

Monitoring with Sensu

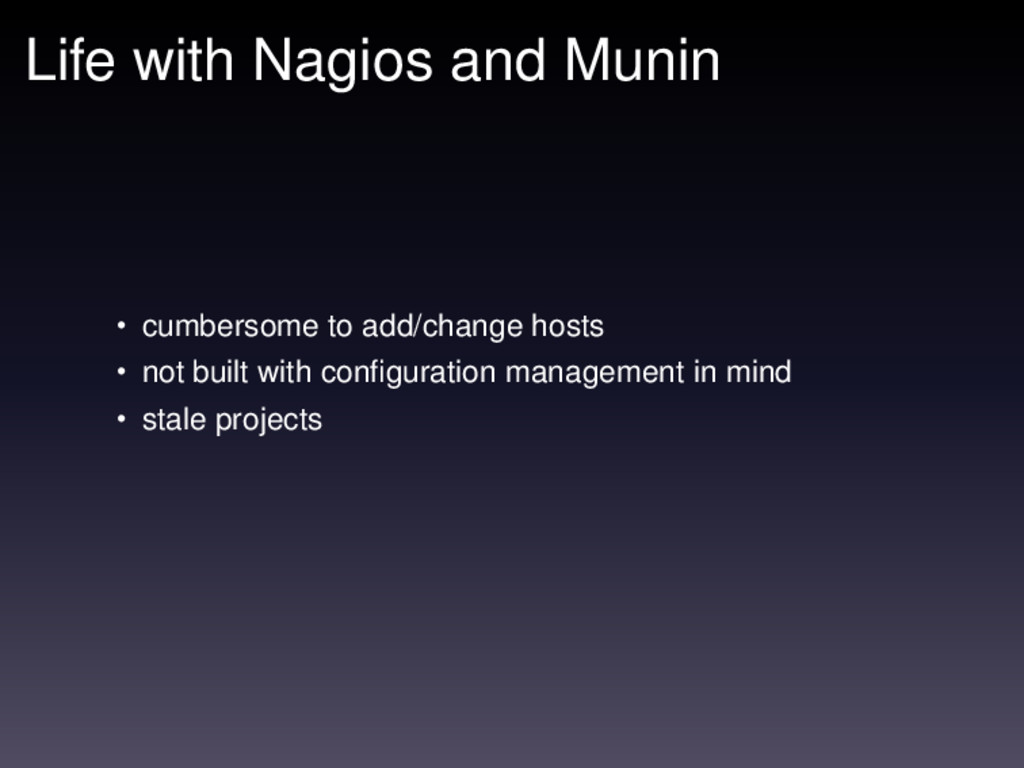
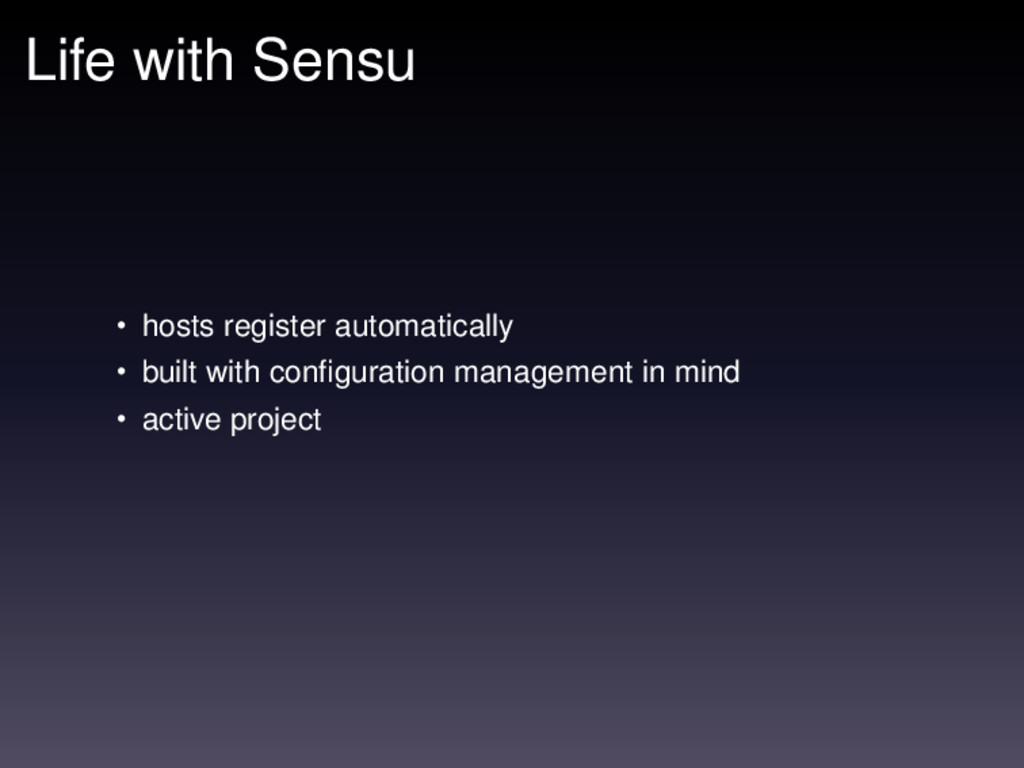
If you feel stuck with the likes of Nagios and Munin, then Sensu might be for you. Sensu is a new open-source monitoring framework built with and for modern technology. Learn how it works and how you can use it to monitor your PostgreSQL installations.

(originally presented at PGConf NYC 2014, http://nyc.pgconf.us/2014/event/17/)

Peter Eisentraut

April 03, 2014
Tweet

More Decks by Peter Eisentraut

Other Decks in Technology

Transcript

  1. Life with Nagios and Munin • cumbersome to add/change hosts

    • not built with configuration management in mind • stale projects
  2. Life with Sensu • hosts register automatically • built with

    configuration management in mind • active project
  3. Configuration /etc/sensu/config.json { "rabbitmq": { "host": "sensu.example.net", "port": 5671, "vhost":

    "/sensu", "user": "sensu", "password": "password", "ssl": { "cert_chain_file": "/etc/sensu/ssl/cert.pem", "private_key_file": "/etc/sensu/ssl/key.pem" } } }
  4. A Check /etc/sensu/conf.d/checks/check-cpu.json { "checks": { "check-cpu": { "command": "/etc/sensu/community/plugins/system/

    check-cpu.rb -w 80 -c 95", "handlers": ["email", "pagerduty"], "subscribers": ["default"], "interval": 60, "occurrences": 10, "refresh": 1800 } } }
  5. Use Chef sensu_check "check-cpu" do command "/etc/sensu/community/plugins/system/check-cpu .rb -w 80

    -c 95" handlers ["email", "pagerduty"] subscribers ["default"] interval 60 additional(occurrences: 10, refresh: 1800) end
  6. Use Puppet sensu::check { 'check-cpu': command => '/etc/sensu/community/plugins/system/ check-cpu.rb -w

    80 -c 95', handlers => ['email', 'pagerduty'], subscribers => ['default'], interval => 60, custom => { 'occurrences' => 10, 'refresh' => 1800, }, }
  7. Standalone Checks sensu_check "check_postgres_backends_5432" do interval 60 command "check_postgres --action=backends

    --port=5432" standalone true handlers ['dba'] end sensu_check "check_postgres_backends_5433" do interval 60 command "check_postgres --action=backends --port=5433" standalone true handlers ['dba'] end
  8. A Metric { "checks": { "cpu_metrics": { "command": "/etc/sensu/community/plugins/system/ cpu-pcnt-usage-metrics.rb",

    "handlers": ["graphite"], "subscribers": ["default"], "type": "metric", "interval": 60 } } }
  9. Nagios “Performance Data” $ check_postgres --action=backends POSTGRES_BACKENDS OK: DB "postgres"

    1 of 100 connections (1%) | time=0.02s commitfest=0;90;95;0;100 contrib_regression=0;90;95;0;100 foo=0;90;95;0;100 postgres=1;90;95;0;100 template0=0;90;95;0;100 template1=0;90;95;0;100 test=0;90;95;0;100 test2 =0;90;95;0;100
  10. Other Features • REST API • port 3030 • sensu-admin

    • remediation • multimaster server • custom check attributes • severity filtering • check dependencies • flap detection • subduing