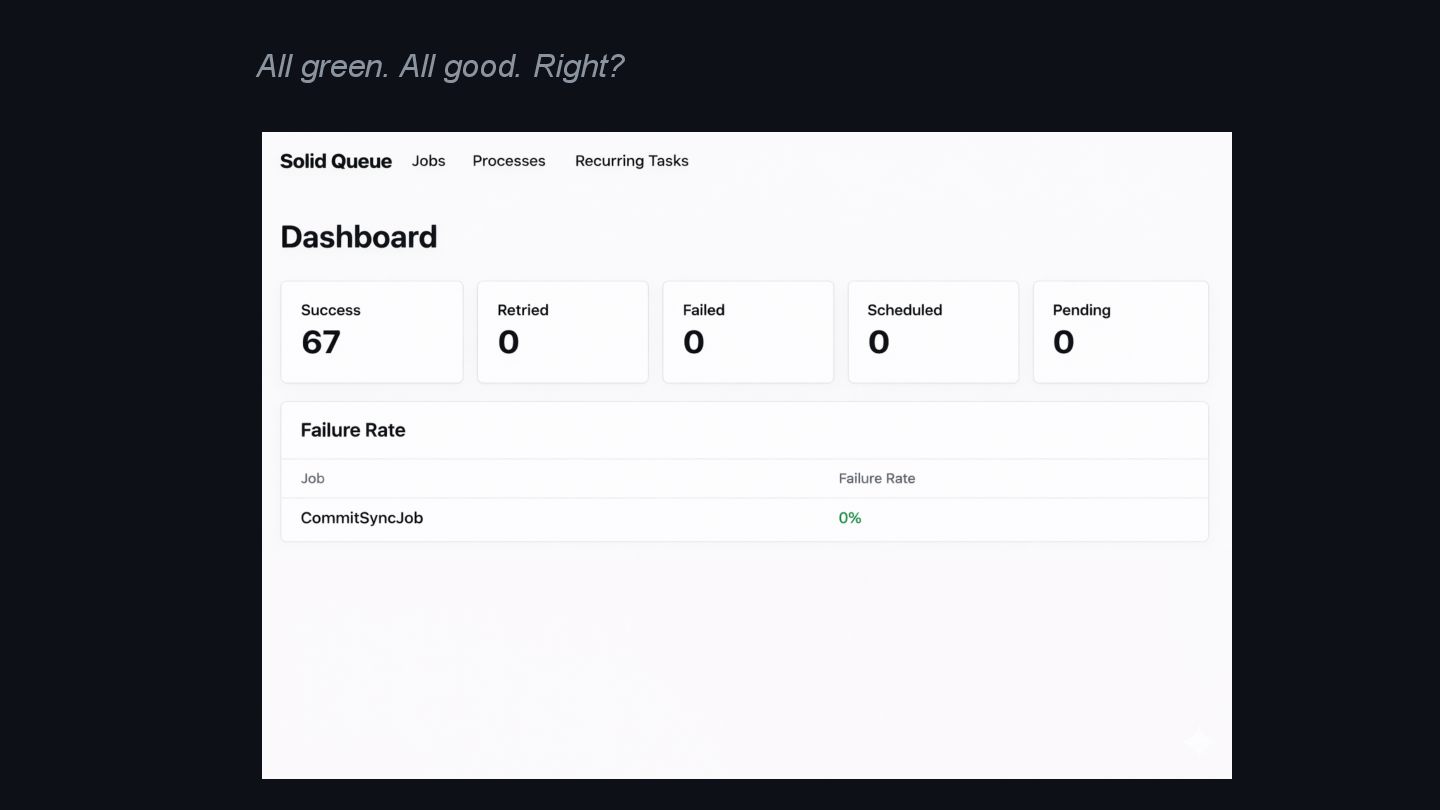
Your Rails app is in production. A user says it’s slow. Another says a feature just broke. You need answers fast.
This talk shows how to make your app observable: capturing metrics, logs, and traces, then feeding them into open source monitoring tools. You’ll see what’s worth recording, how to avoid drowning in noise, and how to set alerts that lead straight to the cause.
Walk away ready to see inside your app when it matters most and fix problems before everything is on fire.
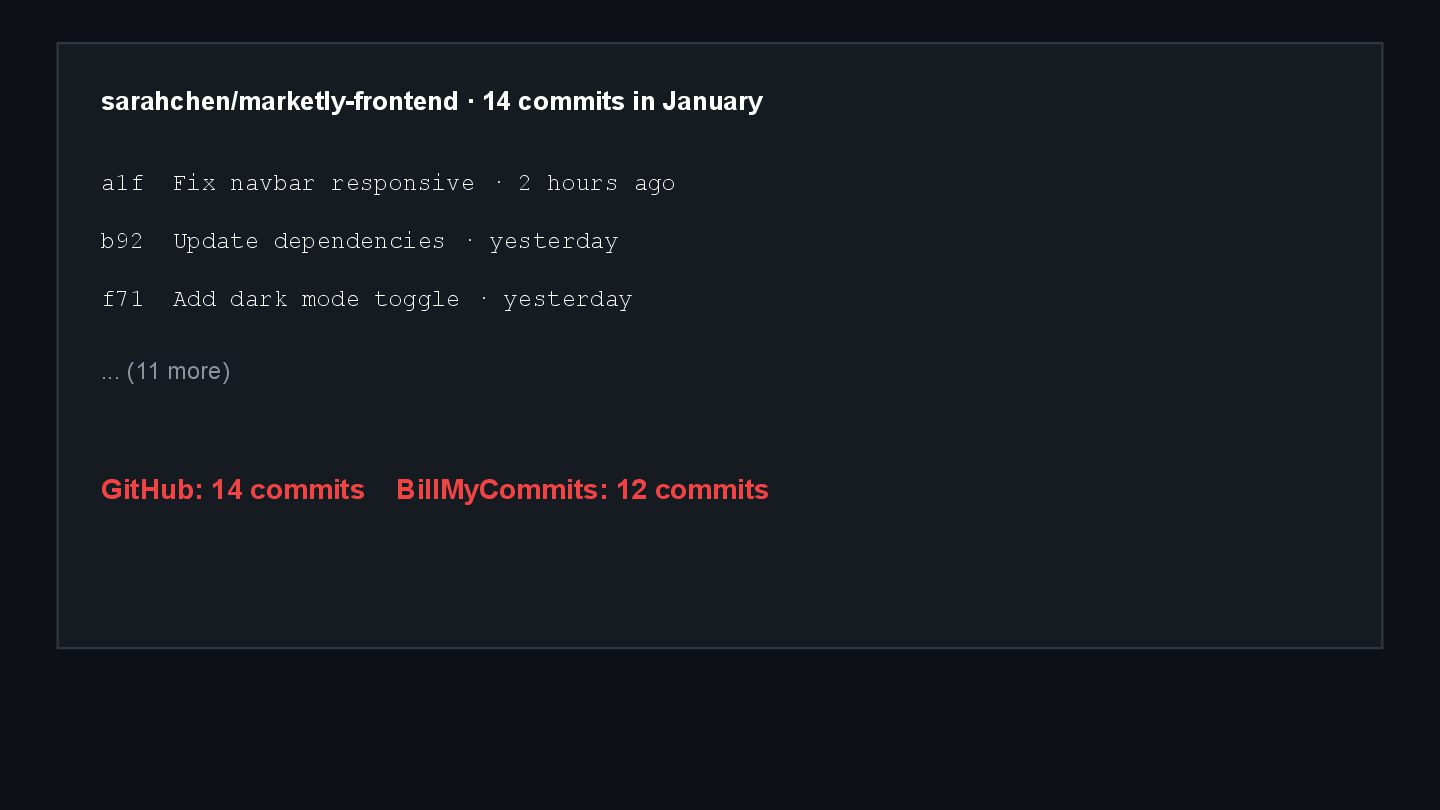
![From: Sarah Chen <[email protected]> To: [email protected] Subject: Missing commits -](https://files.speakerdeck.com/presentations/34af9a3cda1e43d8bb6a2844f6d3e4f6/slide_0.jpg)
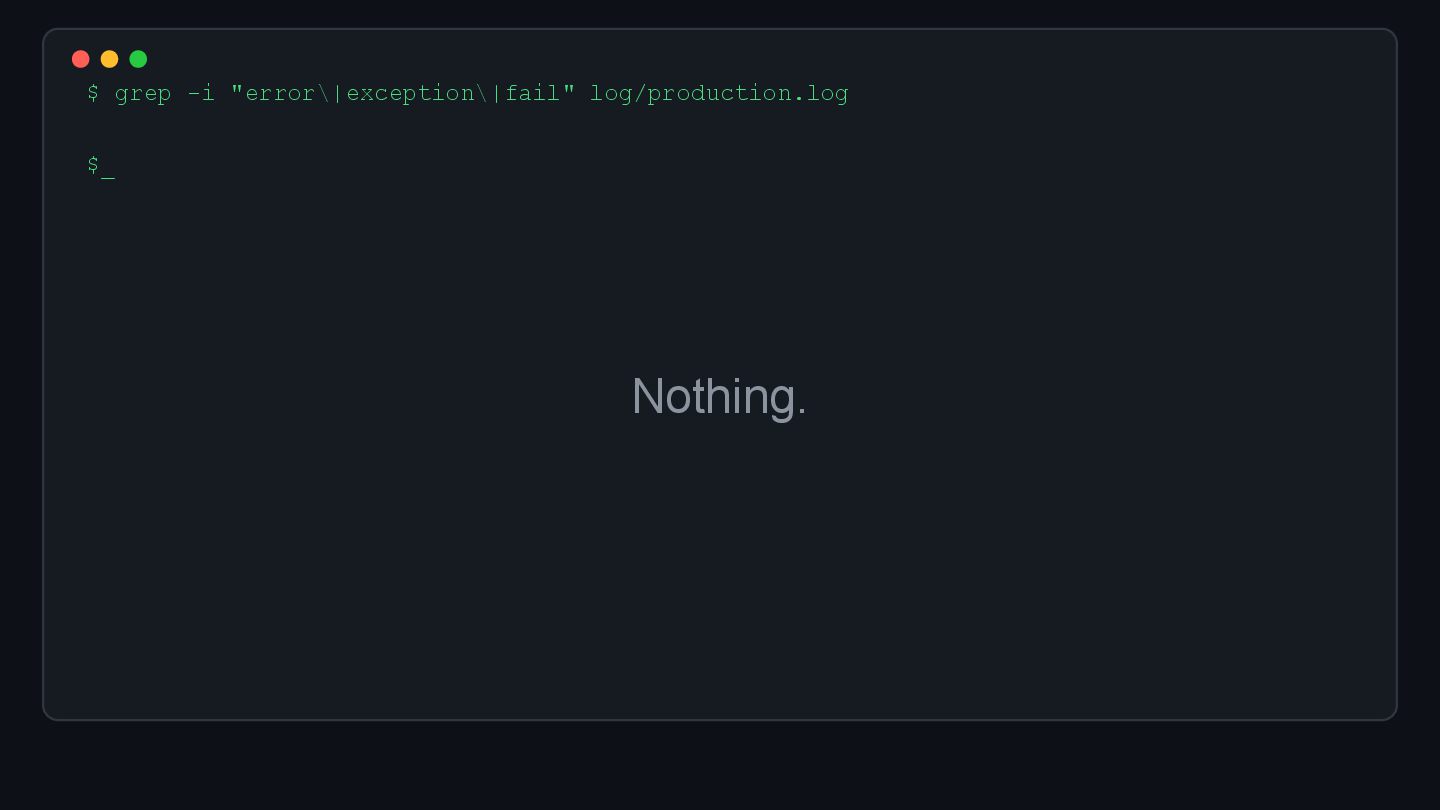
![$ tail -f log/production.log [09:41:23] INFO Started POST "/webhooks/github" [09:41:23]](https://files.speakerdeck.com/presentations/34af9a3cda1e43d8bb6a2844f6d3e4f6/slide_5.jpg)
![Prometheus aggregates at WRITE time LOGS (aggregate at read): [09:41:23]](https://files.speakerdeck.com/presentations/34af9a3cda1e43d8bb6a2844f6d3e4f6/slide_20.jpg)
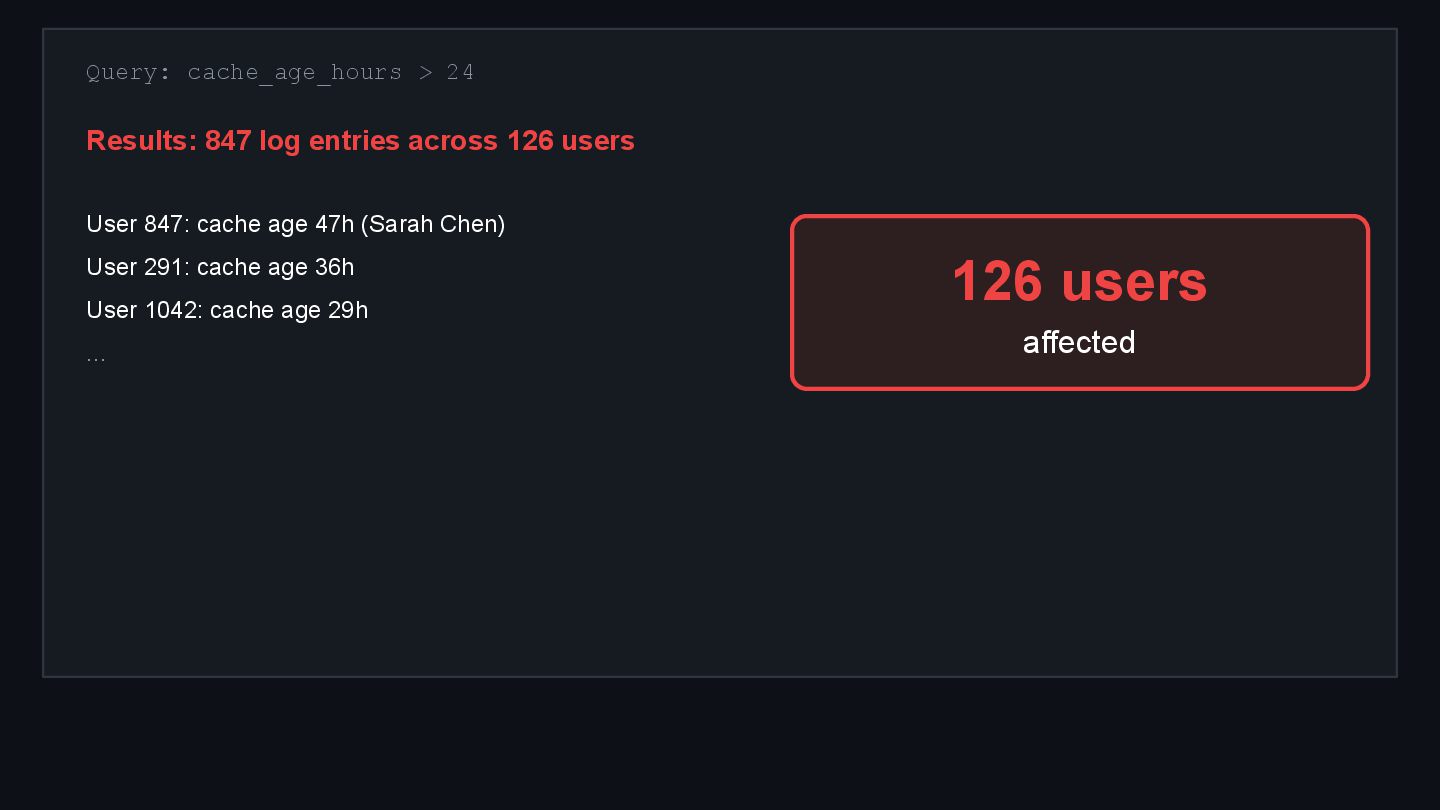
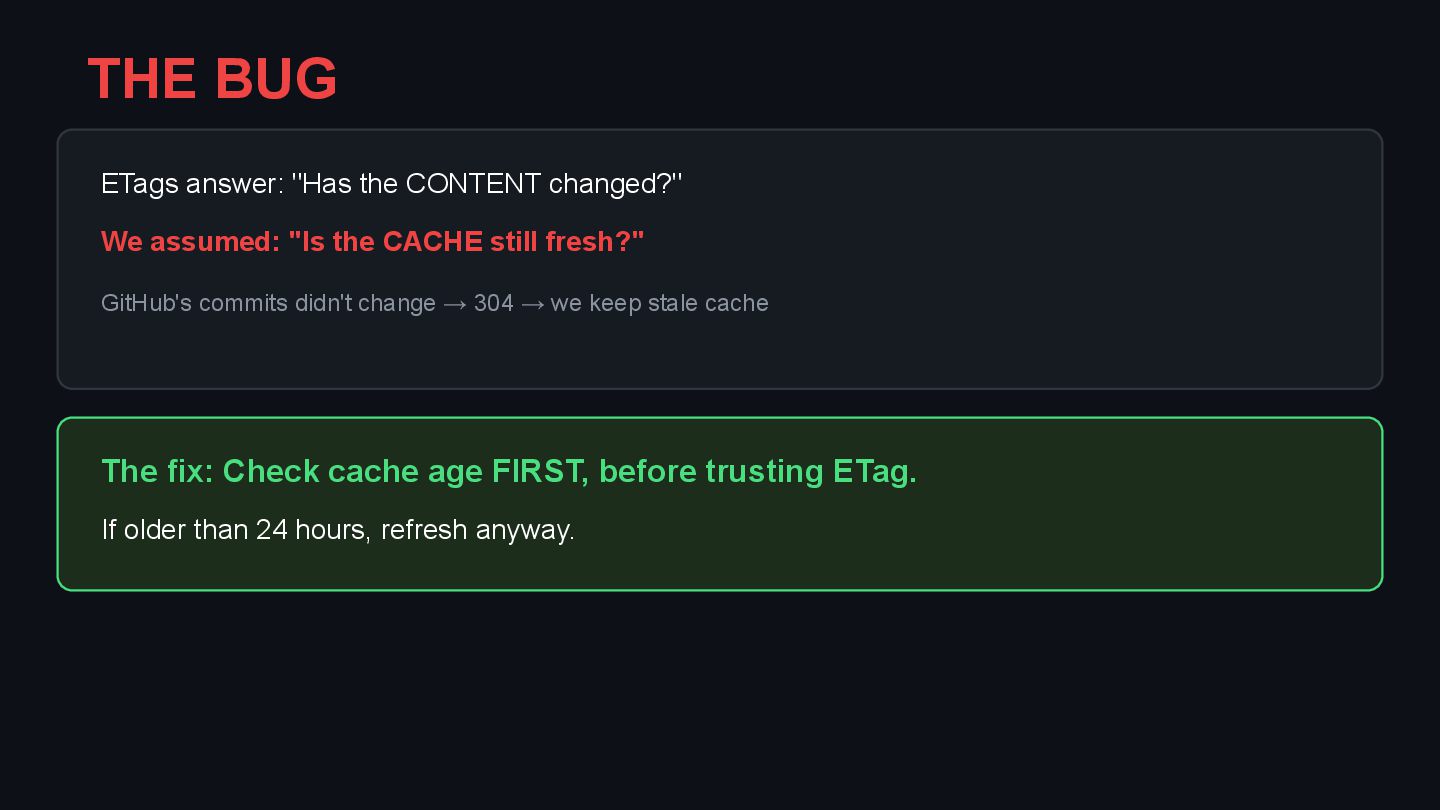
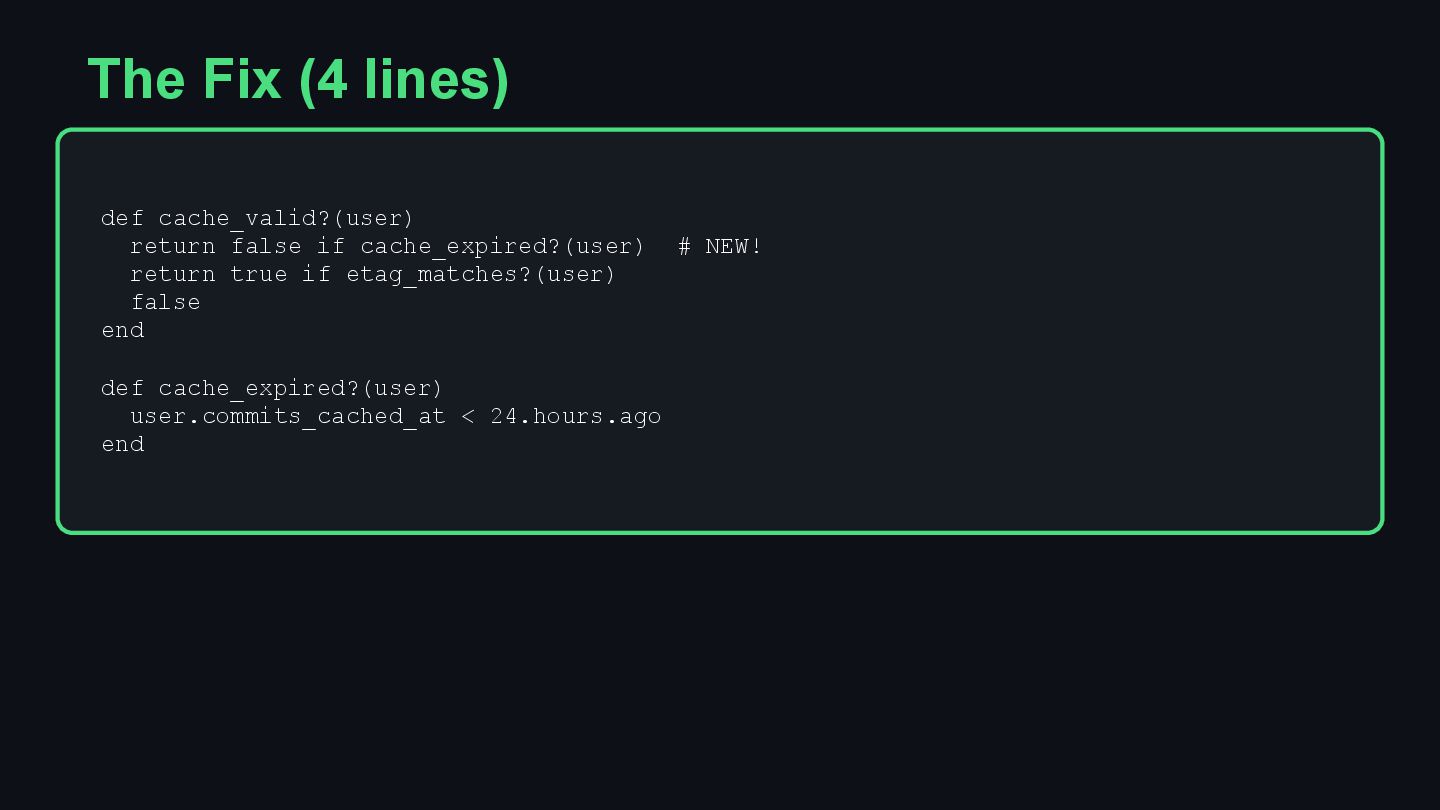
![Plain text: [09:41:23] INFO GitHub API returned 304... Structured JSON:](https://files.speakerdeck.com/presentations/34af9a3cda1e43d8bb6a2844f6d3e4f6/slide_39.jpg)
![Alert 3: API Calls Stopped rate(api_calls_total[1h]) == 0 Zero API](https://files.speakerdeck.com/presentations/34af9a3cda1e43d8bb6a2844f6d3e4f6/slide_50.jpg)