Upgrade to Pro — share decks privately, control downloads, hide ads and more …

Quantile and Probability Plots in Python

Paul Hobson
February 09, 2017

Quantile and Probability Plots in Python

Background and methods for creating probability plots in python.

Paul Hobson

February 09, 2017
Tweet

More Decks by Paul Hobson

Other Decks in Science

Transcript

  1. BASICS WAYS TO VISUALIZE THE DISTRIBUTION OF A SAMPLE ▸Histogram

    ▸Boxplot ▸KDE/Violin Plot ▸Swarmplot ▸Quantile/Probability Plots
  2. COMPUTING PLOTTING POSITIONS HOW TO MAKE A PERCENTILE PLOT ▸

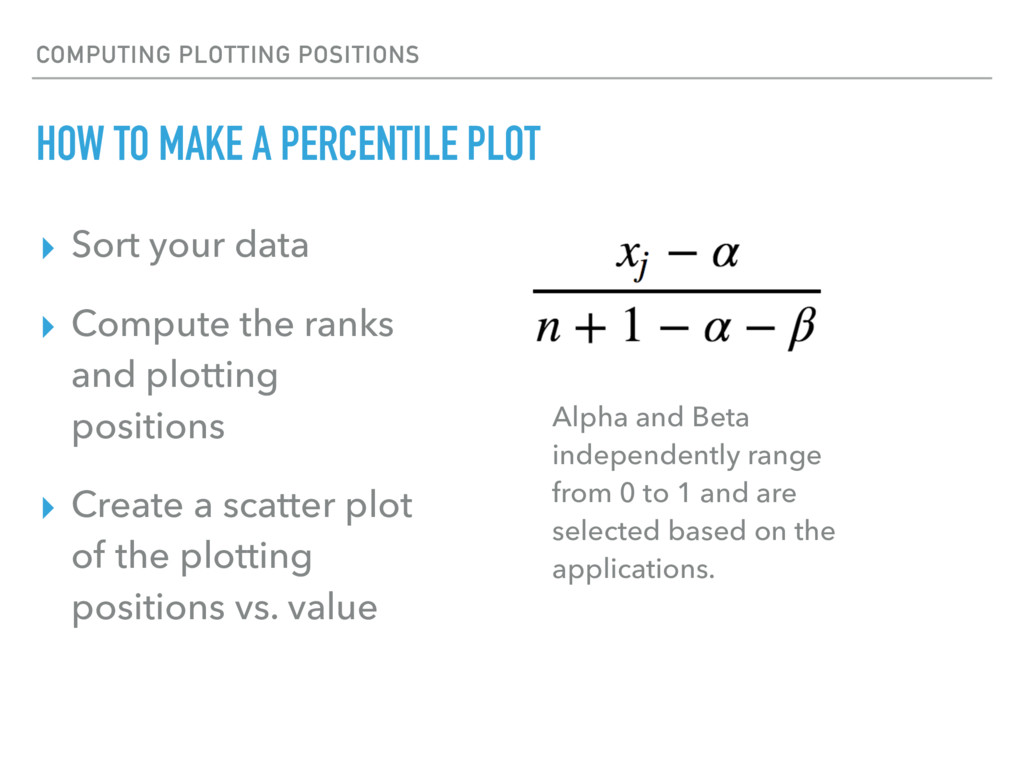
    Sort your data ▸ Compute the ranks and plotting positions ▸ Create a scatter plot of the plotting positions vs. value Alpha and Beta independently range from 0 to 1 and are selected based on the applications.
  3. QUANTILE PLOTS HOW TO MAKE A QUANTILE PLOT ▸ Pick

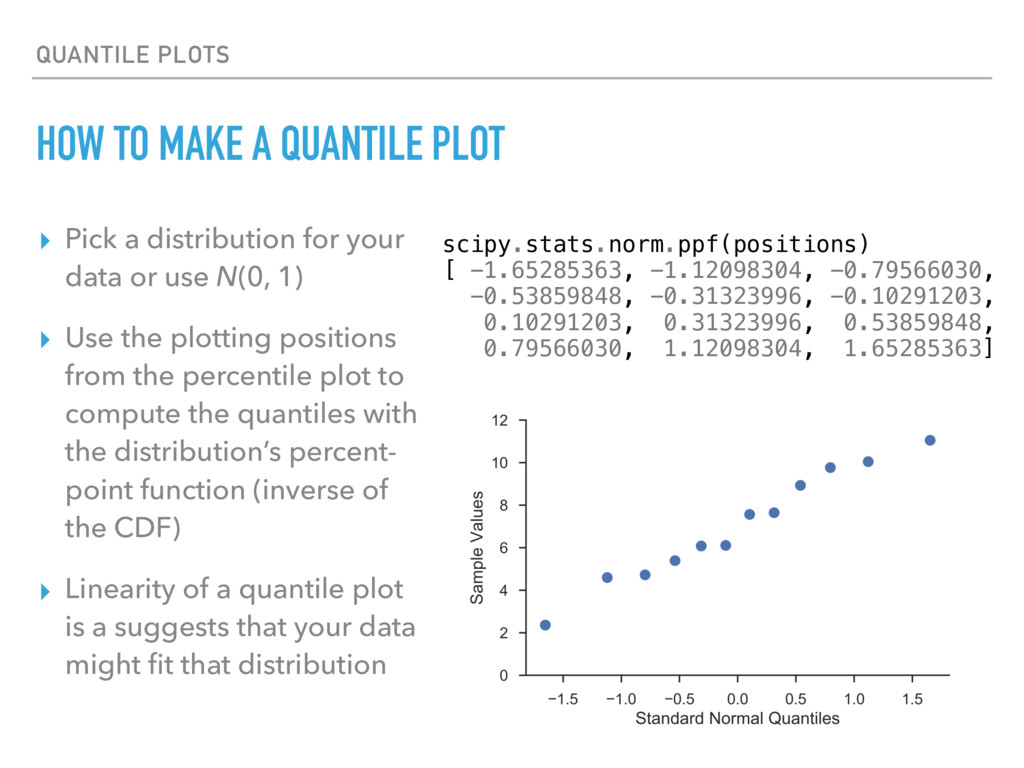
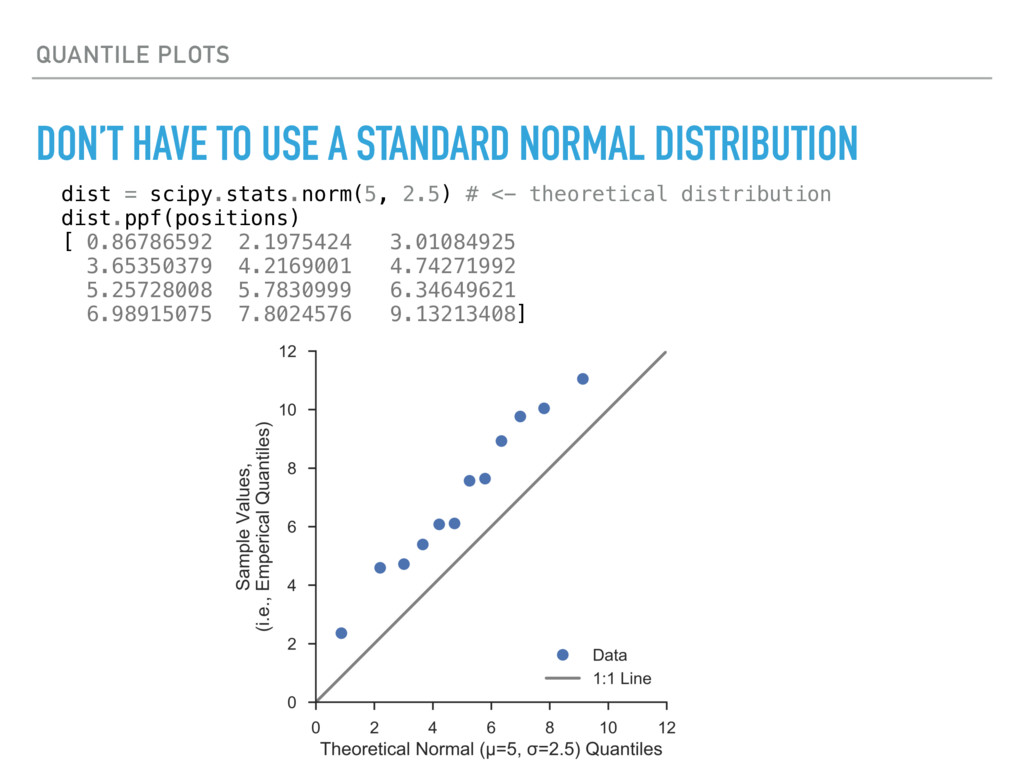
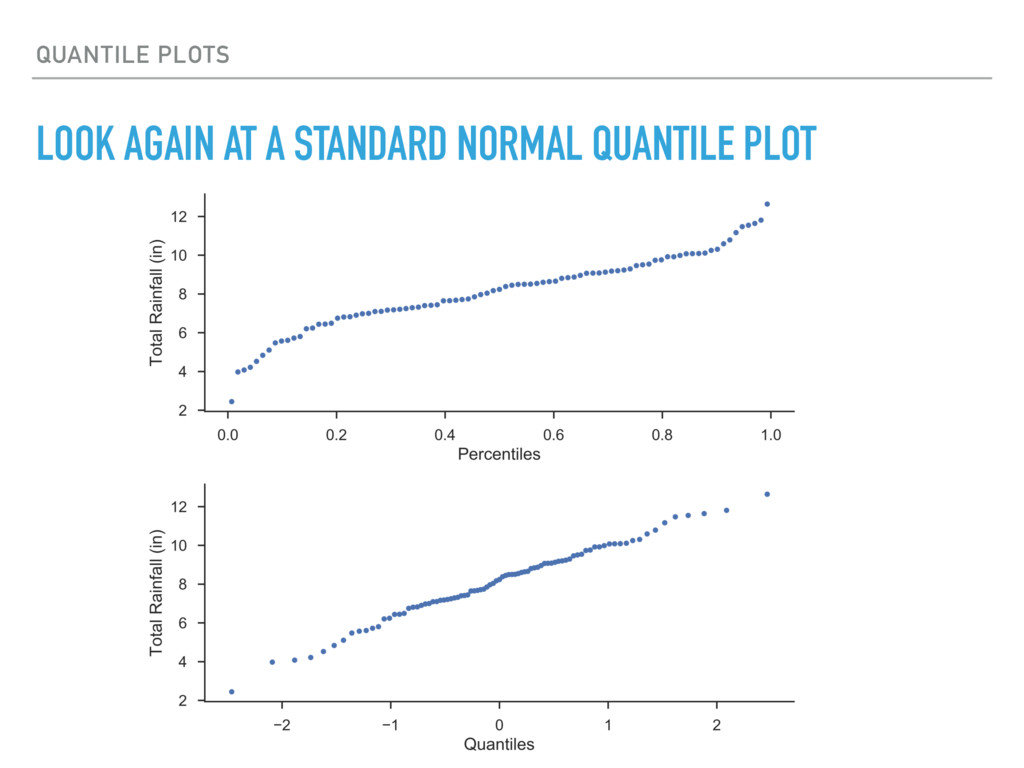
    a distribution for your data or use N(0, 1) ▸ Use the plotting positions from the percentile plot to compute the quantiles with the distribution’s percent- point function (inverse of the CDF) ▸ Linearity of a quantile plot is a suggests that your data might fit that distribution scipy.stats.norm.ppf(positions) [ -1.65285363, -1.12098304, -0.79566030, -0.53859848, -0.31323996, -0.10291203, 0.10291203, 0.31323996, 0.53859848, 0.79566030, 1.12098304, 1.65285363]
  4. QUANTILE PLOTS DON’T HAVE TO USE A STANDARD NORMAL DISTRIBUTION

    dist = scipy.stats.norm(5, 2.5) # <- theoretical distribution dist.ppf(positions) [ 0.86786592 2.1975424 3.01084925 3.65350379 4.2169001 4.74271992 5.25728008 5.7830999 6.34649621 6.98915075 7.8024576 9.13213408]
  5. FINALLY PROBABILITY PLOTS ▸ Preserve the shape of the quantile

    plots ▸ Provide a readable probability axis
  6. PROBABILITY SCALES ASYMPTOTICALLY APPROACH ZERO & ONE fig, ax =

    pyplot.subplots(figsize=(3, 10)) ax.set_yticks([]) ax.set_xscale('prob') ax.set_xlim(0.01, 99.99) seaborn.despine(fig=fig, left=True)
  7. PROBABILITY SCALES MPL-PROBSCALE ▸ Legit probability scales for matplotlib ▸

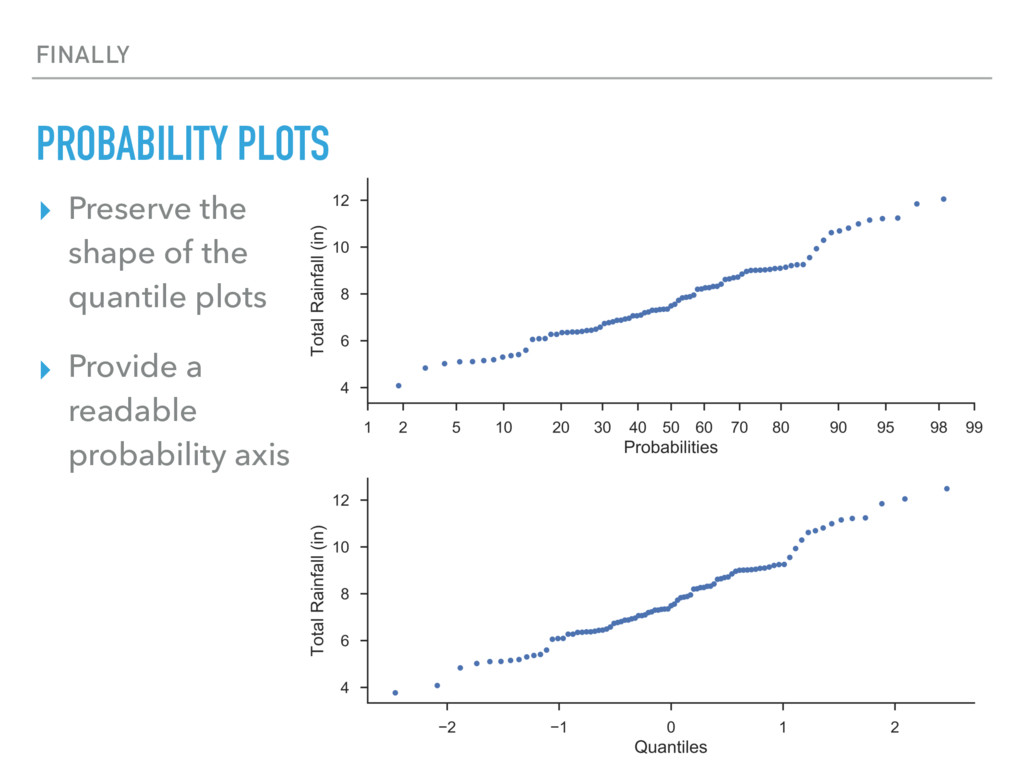
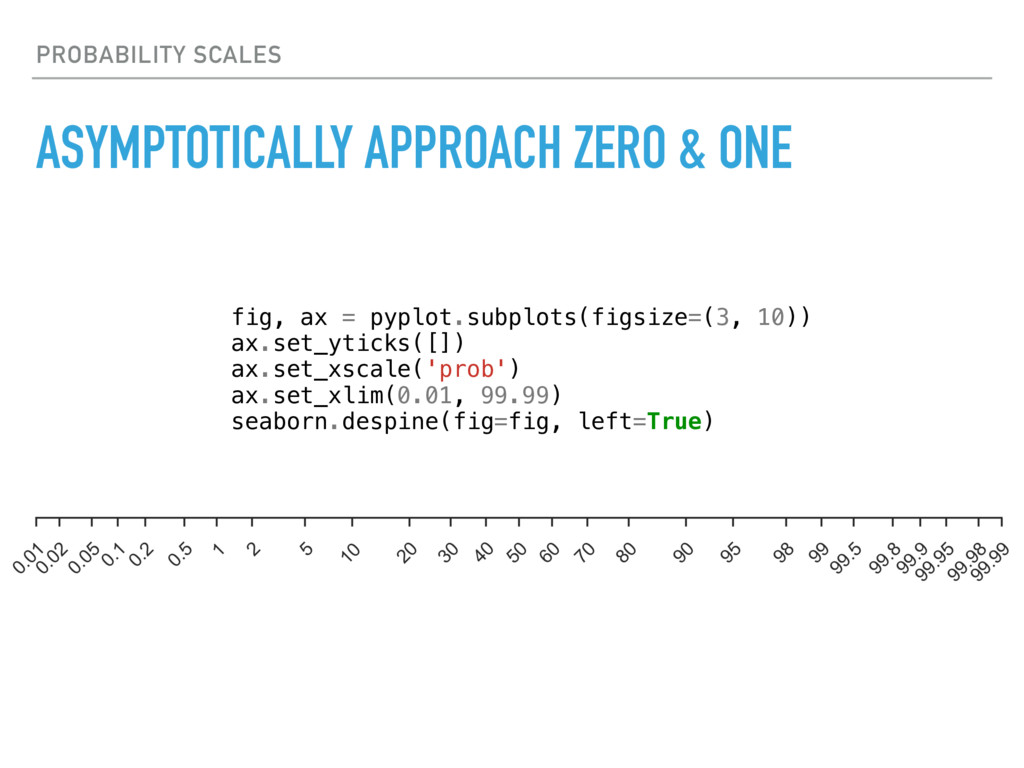
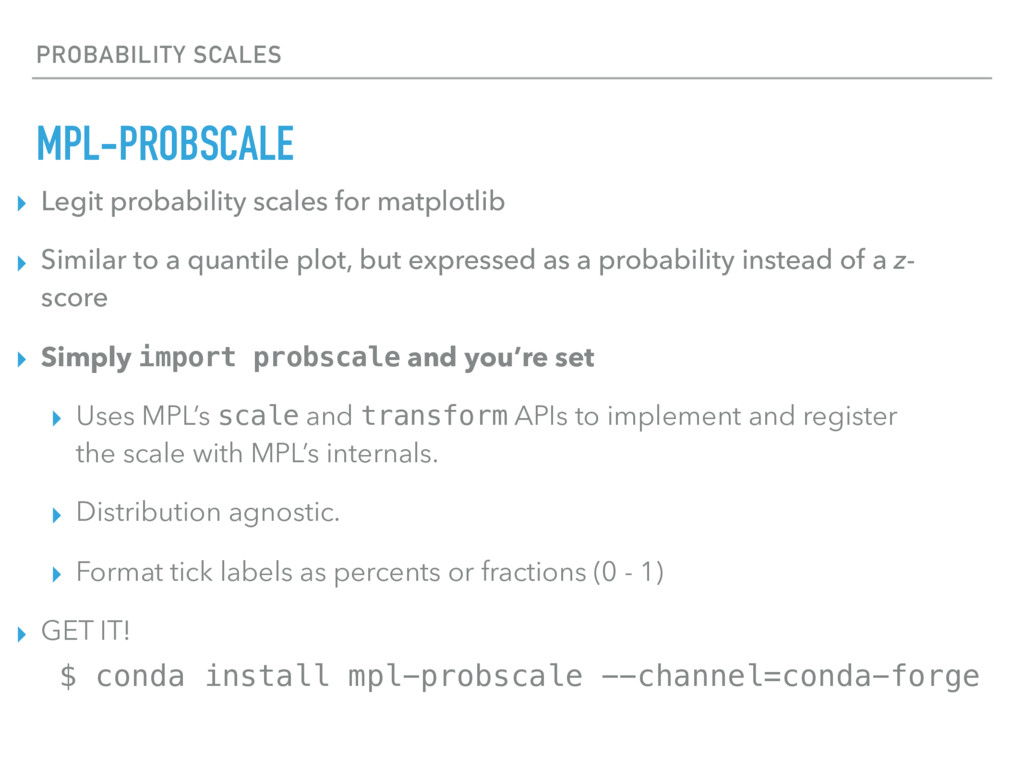
    Similar to a quantile plot, but expressed as a probability instead of a z- score ▸ Simply import probscale and you’re set ▸ Uses MPL’s scale and transform APIs to implement and register the scale with MPL’s internals. ▸ Distribution agnostic. ▸ Format tick labels as percents or fractions (0 - 1) ▸ GET IT! $ conda install mpl-probscale --channel=conda-forge
  8. PROBABILITY SCALES MPL-PROBSCALE import probscale ax1.set_xscale('prob') ax1.set_xlim(left=2, right=98) ax1.set_xlabel('Normal scale')

    ax2.set_xscale('prob', dist=beta(a=3, b=2)) ax2.set_xlim(left=2, right=98) ax2.set_xlabel('Beta scale (α=3, β=2)')
  9. PROBABILITY PLOTS MPL-PROBSCALE ▸ Can fit linear regression in log-

    probability space ▸ Bootstrapped confidence intervals ▸ Top-level functions for easy plotting import probscale fig = probscale.probplot( data, ax=ax, # optional Axes plottype='prob', # or ‘qq’, 'pp' probax='y', # or 'x' problabel=ylabel, datascale='log', datalabel=xlabel, bestfit=True, estimate_ci=True )
  10. MPL-PROBSCALE, ETC LINK DUMP ▸ Source code: https://github.com/matplotlib/mpl- probscale ▸

    Docs: matplotlib.org/mpl-probscale/ ▸ Me ▸ https://twitter.com/pmhobson ▸ https://github.com/phobson