Upgrade to Pro — share decks privately, control downloads, hide ads and more …

Herald Haproxy agent for load feedback

Herald Haproxy agent for load feedback

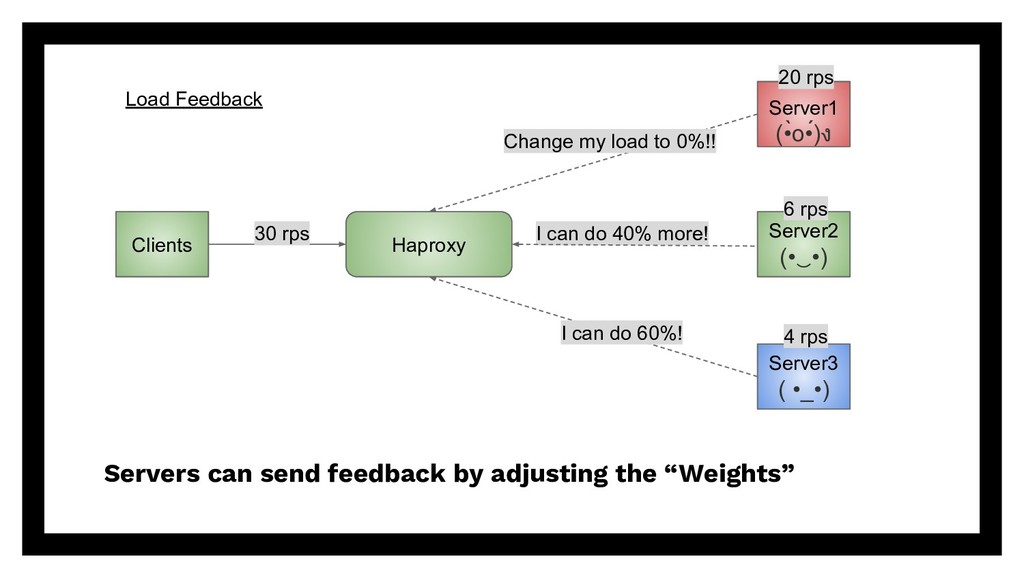
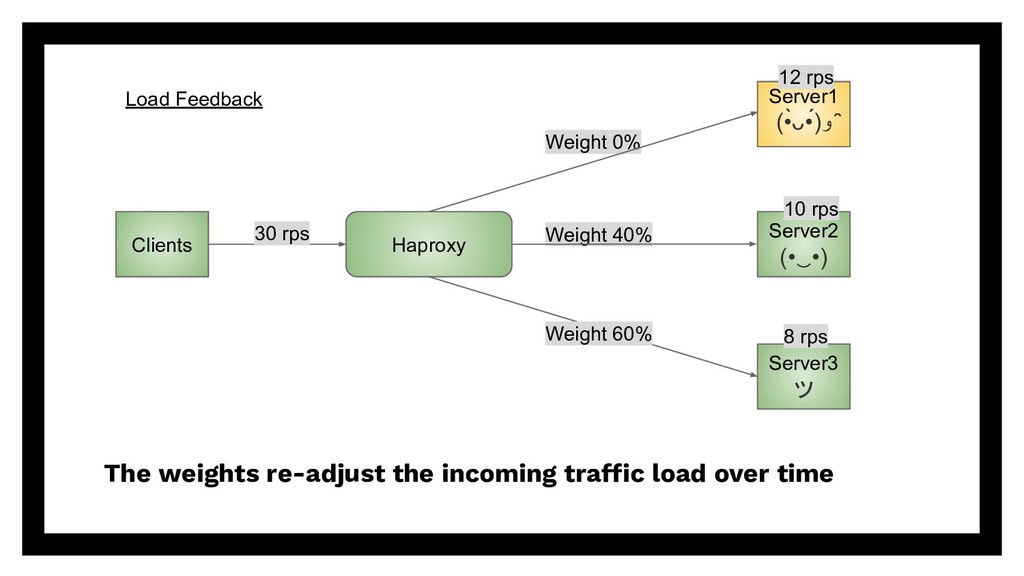
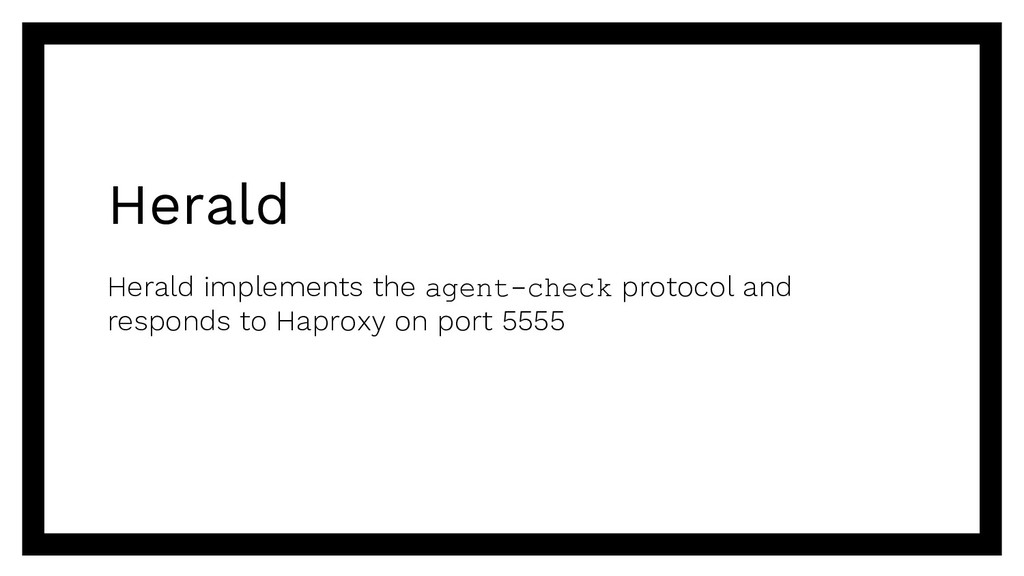
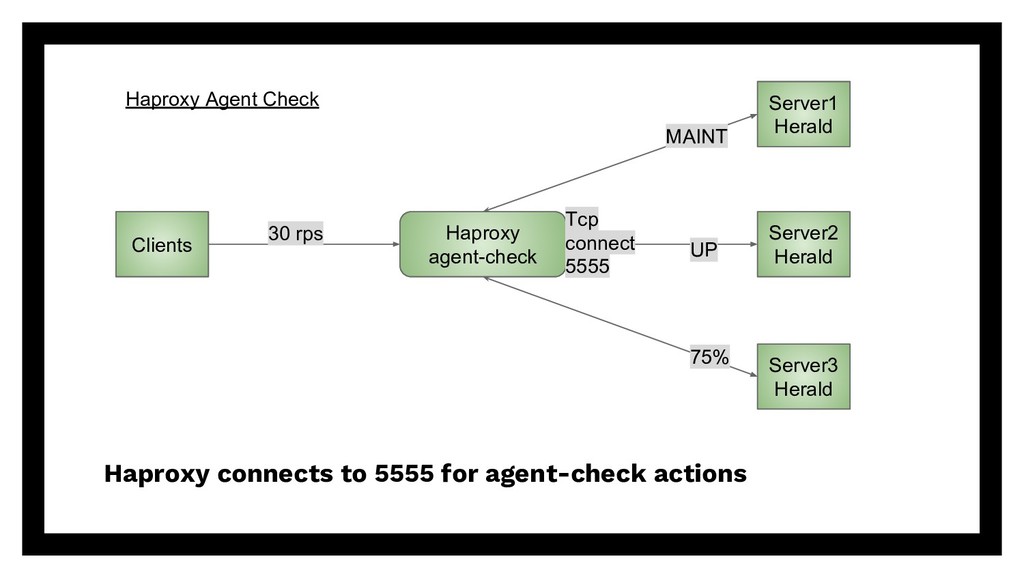
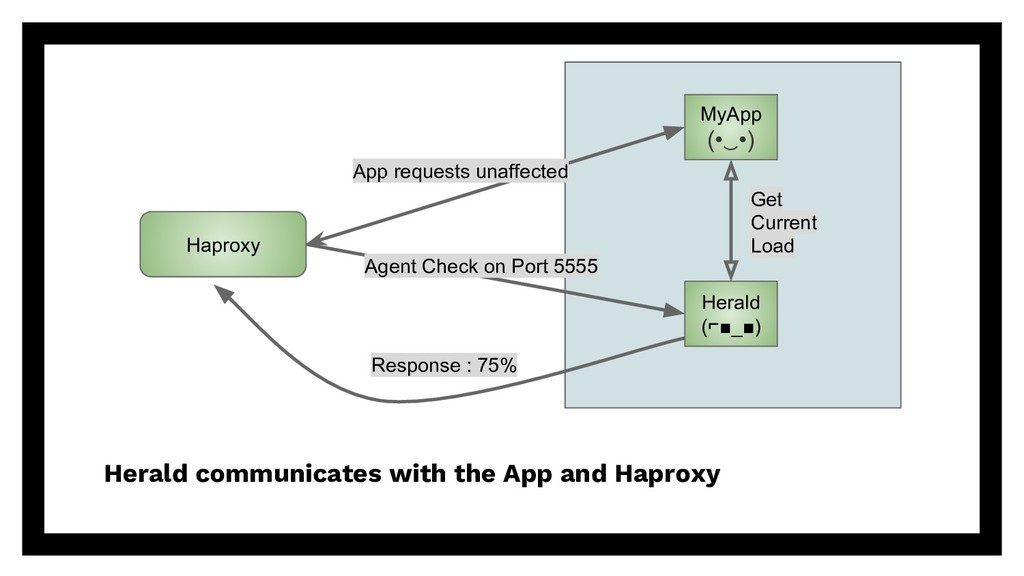
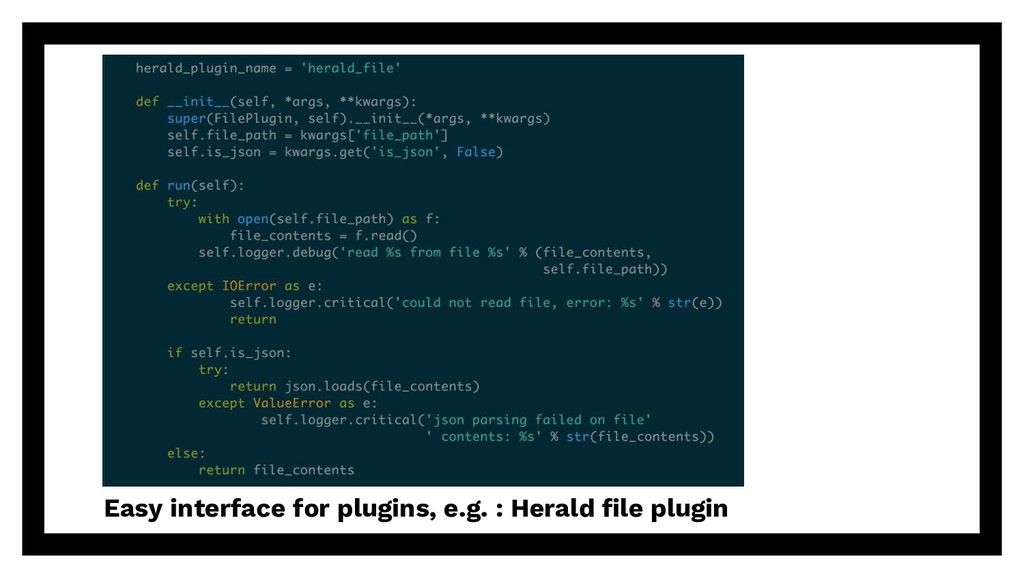
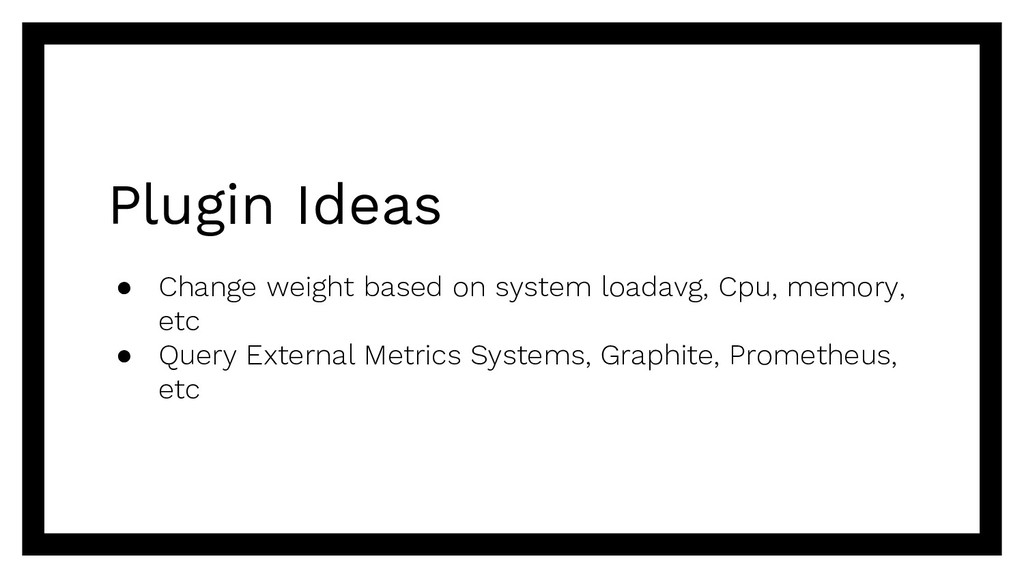
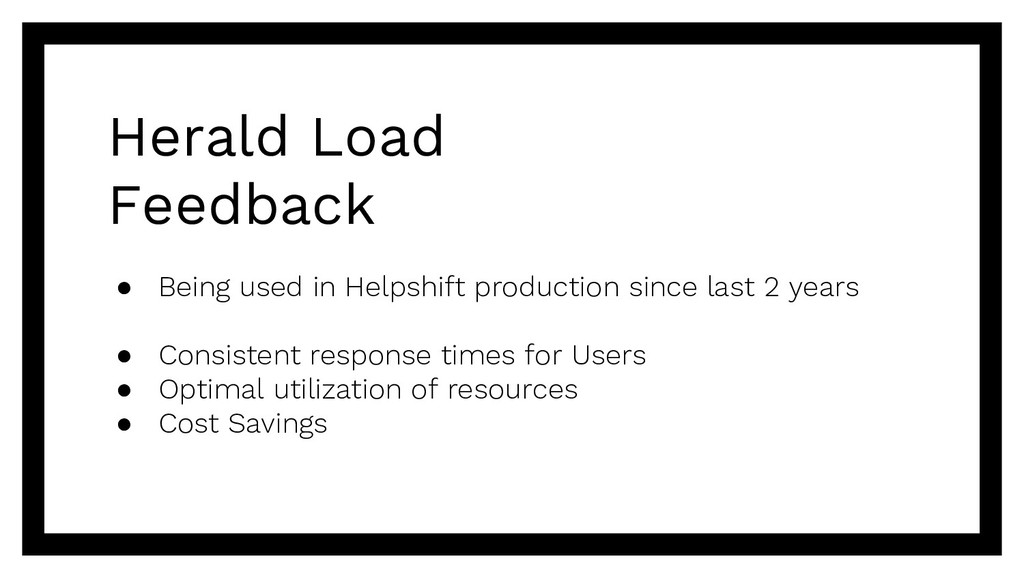
Herald (https://github.com/helpshift/herald) is a haproxy agent we wrote to implement load feedback. This talk will explain the Haproxy load balancing problem we faced, why load feedback was required and how Herald solved the problem.

This should be interesting to folks familiar with load balancers, especially Haproxy.

Raghu Udiyar

May 12, 2018
Tweet

More Decks by Raghu Udiyar

Other Decks in Technology

Transcript

  1. Herald Haproxy agent for load feedback Raghu Udiyar Production Engineering

    Manager @ Helpshift https://github.com/helpshift/herald
  2. Outline • Problem with Haproxy load balancing • What is

    load feedback • How Herald implements load feedback • Herald features overview
  3. Haproxy distributes incoming requests equally to all servers Clients Server1

    Server2 Server3 Haproxy (round-robin) Haproxy Load Balancer 30 rps 10 rps 10 rps 10 rps
  4. Uneven distribution when some requests take longer to serve Clients

    Server1 (•̀o•́)ง Server2 (•‿•) Server3 ( •_•) Haproxy (round-robin) Load imbalance 30 rps 20 rps 6 rps 4 rps
  5. Impact • Performance degradation ◦ Server unable to perform with

    increasing loads ◦ Response time degrades further • Server underutilization
  6. Haproxy Weights Haproxy can assign weights to each backend But

    these are largely static when used by themselves
  7. Haproxy has static “Weights” associated with each server Clients Server1

    Server2 Server3 Haproxy (round-robin) Haproxy Weights 30 rps Weight 100% Weight 20% Weight 50%
  8. Enter Load Feedback • The backend server can send feedback

    to the load balancer • I’m at peak load send me less traffic • I’m free now, please send more!
  9. Servers can send feedback by adjusting the “Weights” Clients Server1

    (•̀o•́)ง Server2 (•‿•) Server3 ( •_•) Haproxy Load Feedback 30 rps 20 rps 6 rps I can do 60%! Change my load to 0%!! I can do 40% more! 4 rps
  10. Feedback with Weights We can do this by dynamically adjusting

    the aforementioned Haproxy server weights
  11. The weights re-adjust the incoming traffic load over time Clients

    Server1 (•̀ᴗ•́)و ̑̑ Server2 (•‿•) Server3 ツ Haproxy Load Feedback 30 rps 12 rps 10 rps Weight 0% Weight 40% 8 rps Weight 60%
  12. Haproxy connects on port 5555 every 2s for commands frontend

    myservice bind *:8080 option tcp-smart-accept default_backend mybackend backend mybackend balance leastconn option httpchk /health-check/ default-server weight 100 agent-port 5555 server be01 10.0.1.132:8080 check agent-check server be02 10.0.1.133:8080 check agent-check server be03 10.0.1.148:8080 check agent-check
  13. Agent-check commands The server on port 5555 must reply to

    the TCP connection with a string that can be : • 75% • MAINT • DOWN • UP, READY
  14. Haproxy connects to 5555 for agent-check actions Clients Server1 Herald

    Server2 Herald Server3 Herald Haproxy agent-check Haproxy Agent Check 30 rps Tcp connect 5555 MAINT UP 75%
  15. Load Feedback Haproxy + Weights + agent-check + Herald Herald

    sits alongside your application to send the load feedback to Haproxy based on application load metrics
  16. Herald Responsibilities • Respond to Haproxy agent-check requests, and •

    Query application load, and calculate the haproxy agent response
  17. Herald communicates with the App and Haproxy Haproxy MyApp (•‿•)

    Herald (⌐▪_▪) Get Current Load Agent Check on Port 5555 App requests unaffected Response : 75%
  18. Application Load Metrics • The App needs to implement a

    interface to query current load (rps, response time, connections, etc) • E.g. ◦ HTTP : GET http://localhost/my-load ◦ FILE: /tmp/myapp_state.json
  19. Example Herald Configuration name: myapp bind: 0.0.0.0 port: 5555 plugins:

    - default_response: noop herald_plugin_name: herald_http interval: 30 is_json: true name: myapp staleness_interval: 120 staleness_response: noop stop_timeout: 60 thresholds: - min_threshold_response: 1 pct: 9000 thresholds_metric: r['requests-per-second'] url: http://localhost:9004/health-check/
  20. Herald communicates with the App and Haproxy Haproxy MyApp (•‿•)

    Herald (⌐▪_▪) Get Current Load Agent Check on Port 5555 App requests unaffected Response : 75%
  21. Herald Production Readiness • Uses Gevent - single threaded, minimal

    resources • Async polling for metrics, with response cache ◦ Smoothens responses to Haproxy • Stale response detection and fallback if app metrics fail for any reason
  22. Check every 30s, and respond with noop if stale after

    120s name: myapp bind: 0.0.0.0 port: 5555 plugins: - default_response: noop herald_plugin_name: herald_http interval: 30 is_json: true name: myapp staleness_interval: 120 staleness_response: noop stop_timeout: 60 thresholds: - min_threshold_response: 1 pct: 9000 thresholds_metric: r['requests-per-second'] url: http://localhost:9004/health-check/
  23. Json parsing and automatic % calculation with pct keyword name:

    myapp bind: 0.0.0.0 port: 5555 plugins: - default_response: noop herald_plugin_name: herald_http interval: 30 is_json: true name: myapp staleness_interval: 120 staleness_response: noop stop_timeout: 60 thresholds: - min_threshold_response: 1 pct: 9000 thresholds_metric: r['requests-per-second'] url: http://localhost:9004/health-check/
  24. Match regex and mark server as up or down name:

    myapp bind: 0.0.0.0 port: 5555 plugins: - default_response: noop herald_plugin_name: herald_http interval: 30 is_json: false name: myapp staleness_interval: 120 staleness_response: noop stop_timeout: 60 patterns: - down: '.*unhealthy.*' - up: '.*healthy.*' url: http://localhost:9004/health-check/
  25. Herald Metric Plugins • Herald supports pluggable metric plugins to

    query application load metric • Built in plugins are : ◦ herald_http ◦ herald_file
  26. Plugin Ideas • Change weight based on system loadavg, Cpu,

    memory, etc • Query External Metrics Systems, Graphite, Prometheus, etc
  27. Herald Load Feedback • Being used in Helpshift production since

    last 2 years • Consistent response times for Users • Optimal utilization of resources • Cost Savings