Upgrade to Pro — share decks privately, control downloads, hide ads and more …

Count-Min Sketch: An efficient probabilistic da...

Count-Min Sketch: An efficient probabilistic data structure

A Count-Min Sketch is a data structure that estimates how often something appears in a large dataset while using very little memory. It relies on a table and hash functions to map items to specific spots in the table. Adding an item increases the values in those spots, and checking an item’s count returns the smallest value from them. While not exact due to possible collisions, it’s efficient and great for approximate counts when precision isn’t critical.

In this talk, we’ll explore:
• What this data structure is
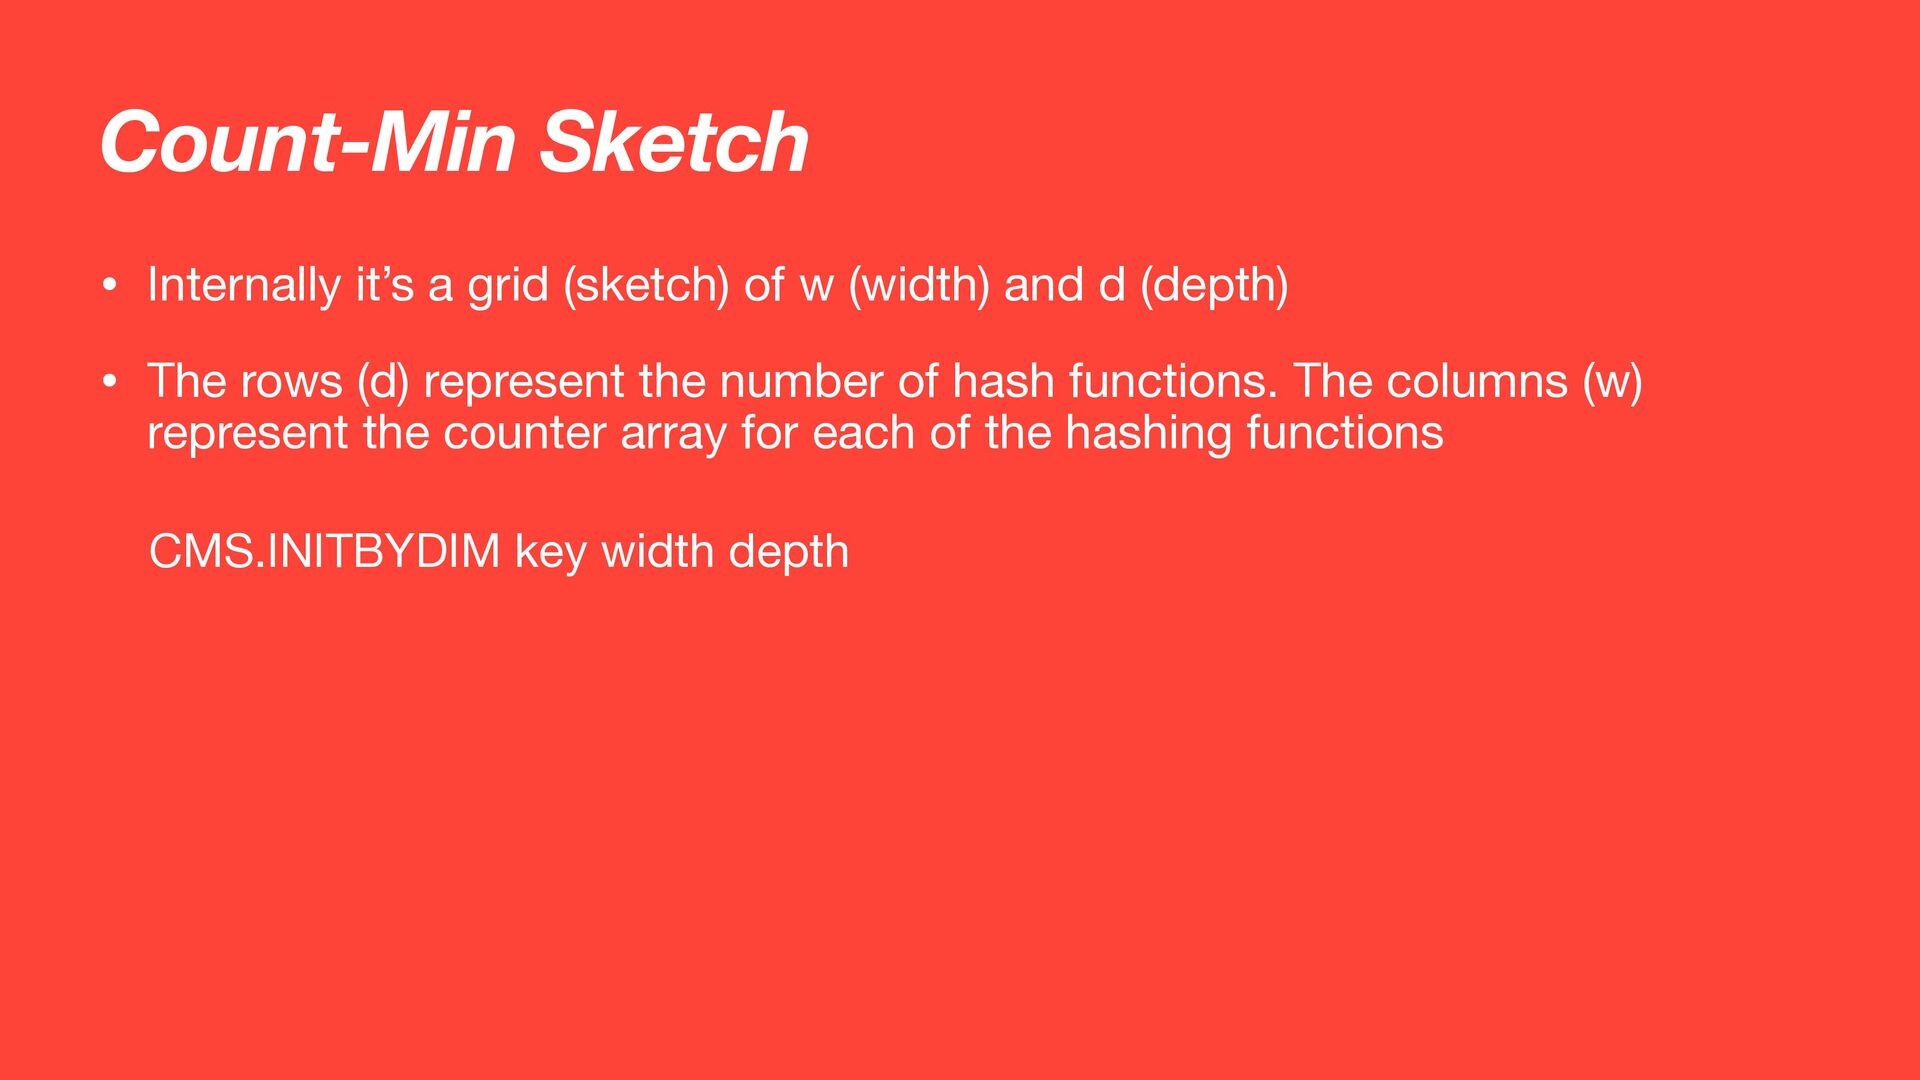
• How it works internally
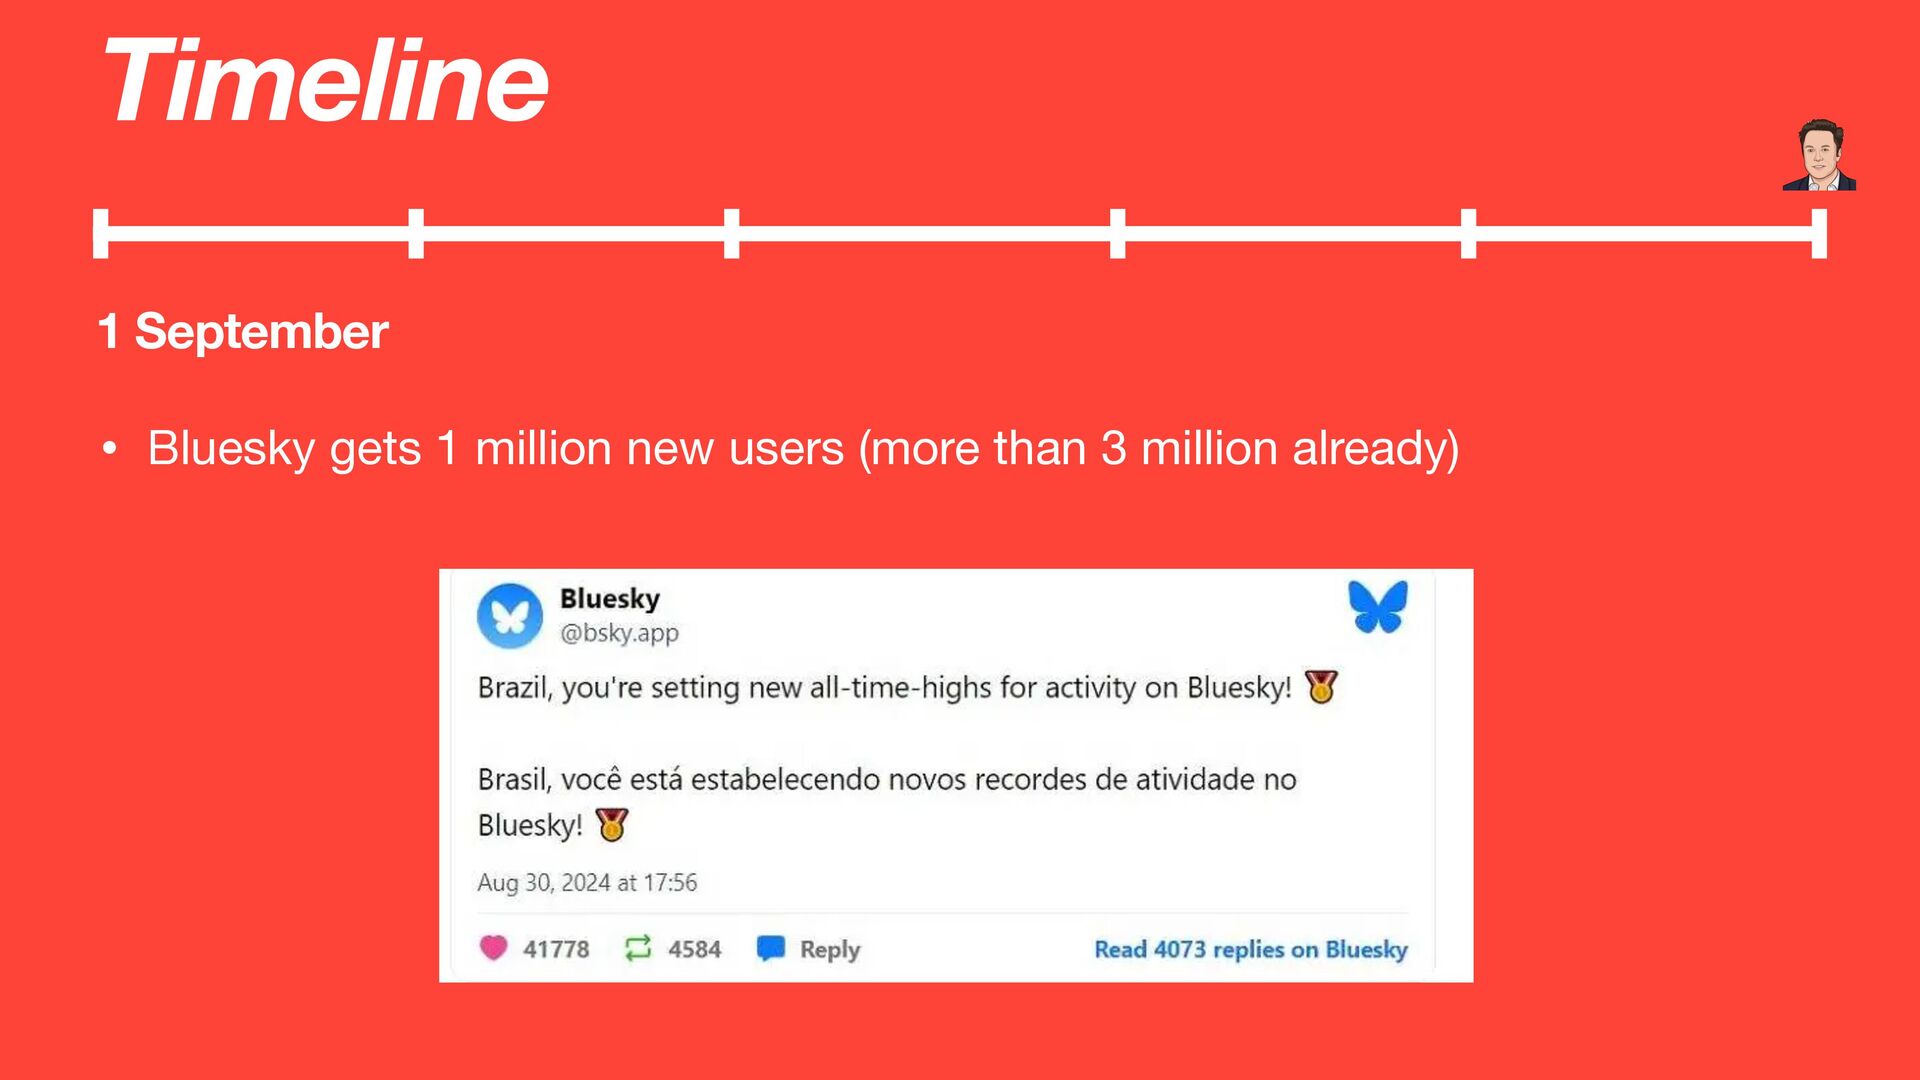
• How I used it to build an efficient version of Trending Topics for Bluesky

By the end of this session, you’ll have a clear understanding of Count-Min Sketches, why they’re valuable for handling large-scale data efficiently, and how you can apply them to solve real-world problems.

Raphael De Lio

December 27, 2024
Tweet

More Decks by Raphael De Lio

Other Decks in Programming

Transcript

  1. Timeline 17 August • According to Musk, Alexandre de Moras

    threatened to arrest the legal representative of Twitter in Brazil. • The threat was a response to Twitter not banning, in secrecy, a number of accounts requested by the Supreme Court of Brazil. • As a result, to protect their sta ff , Twitter closed operations in Brazil.
  2. Timeline 28 August • The Supreme Court, through its own

    pro fi le on Twitter, summoned Elon Musk and ordered him to appoint a legal representative for the company within 24 hours. • If Twitter failed to comply with the decision, it would be suspended.
  3. Timeline 29 August • Alexandre de Moraes determined the freezing

    of fi nancial resources of Starlink in Brazil to ensure the payment of fi nes imposed on Twitter.
  4. Timeline 30 August • Alexandre de Moraes ordered the suspension

    of access to the service in the country. • He also set a fi ne of ~9 thousand dollars to any person 
 or company using a VPN to circumvent the block. • And further ordered the removal of any VPN 
 applications available on the App or Play Store, 
 but this decision was later reversed.
  5. Building my own Trending Topics • Listen to Bluesky’s fi

    rehose • Parse each message and extract hashtags • Count these hashtags • Sort them
  6. Sorted Set • I also want to keep historical data

    so that I can track the evolution of trending topics • I decided that a window of 15 minutes would be good enough • For ~2500 hashtags (15 minutes), it would consume around ~275kb of memory • This translates to (4 * 24 * 275)kb per day (26mb) or ~10gb per year. [if the number of users, messages and frequency of hashtags doesn’t increase] • I wasn’t only thinking of tracking hashtags. I was also thinking of tracking user data such as followers, post counts, blocked data, etc…
  7. Count-Min Sketch • A probablistic Data Structure included in RedisBloom

    • Used to estimate the frequency of elements in a data stream • Operates with space-e ffi ciency, using a fi xed amount of memory regardless of data scale • The advantage of using it is that it may consume way less memory by giving up on accuracy How many times have I been mentioned?
  8. Count-Min Sketch • Internally it’s a grid (sketch) of w

    (width) and d (depth) • The rows (d) represent the number of hash functions. The columns (w) represent the counter array for each of the hashing functions CMS.INITBYDIM key width depth
  9. Count-Min Sketch: Initializing 0 0 0 0 0 0 0

    0 0 0 0 0 0 0 0 CMS.INITBYDIM hashtags 5 3 fi xed size
  10. Count-Min Sketch: Incrementing 0 0 0 0 0 0 0

    0 0 0 0 0 0 0 0 Hash1(“#redis”) % 5 = 2 Hash2(“#redis”) % 5 = 4 Hash3(“#redis”) % 5 = 1 CMS.INCRBY hashtags #redis 1 1 1 1
  11. 0 0 0 0 0 0 0 0 0 0

    0 0 0 0 0 Hash1(“#pets”) % 5 = 0 Hash2(“#pets”) % 5 = 3 Hash3(“#pets”) % 5 = 1 CMS.INCRBY hashtags #pets 1 1 1 1 1 1 2 Count-Min Sketch: Incrementing
  12. 0 0 0 0 0 0 0 0 0 0

    0 0 0 0 0 Hash1(“#cats”) % 5 = 3 Hash2(“#cats”) % 5 = 4 Hash3(“#cats”) % 5 = 0 CMS.INCRBY hashtags #cats 1 1 1 1 1 1 2 1 2 1 Count-Min Sketch: Incrementing
  13. 0 0 0 0 0 0 0 0 0 0

    0 0 0 0 0 Hash1(“#dogs”) % 5 = 2 Hash2(“#dogs”) % 5 = 1 Hash3(“#dogs”) % 5 = 3 CMS.INCRBY hashtags #dogs 1 1 1 1 1 1 2 1 2 1 2 1 1 Count-Min Sketch: Incrementing
  14. Count-Min Sketch: Querying 0 0 0 0 0 0 0

    0 0 0 0 0 0 0 0 Hash1(“#dogs”) % 5 = 2 Hash2(“#dogs”) % 5 = 1 Hash3(“#dogs”) % 5 = 3 CMS.QUERY hashtags #dogs 1 1 1 1 1 2 1 2 1 2 1 1 2 1 1
  15. 0 0 0 0 0 0 0 0 0 0

    0 0 0 0 0 Hash1(“#redis”) % 5 = 2 Hash2(“#redis”) % 5 = 4 Hash3(“#redis”) % 5 = 1 CMS.QUERY hashtags #redis 1 1 1 1 1 2 1 2 1 2 1 1 2 1 1 Count-Min Sketch: Querying 2
  16. Count-Min Sketch: Probability • The width determines the error rate:


    A larger width means more counters to distribute the counts, leading to a lower error rate because there’s less likelihood of collisions in fl ating counts. If we are conservative and say that a counter can get twice the average amount, then the formula to calculate it is: “e = 2/w" • The depth determines the con fi dence in this error rate: (½)^d
 A greater depth means that there are more rows, reducing the likelihood that all rows will simultaneously overestimate due to collisions. The chance a row will overestimate is of 50%, it either will or not. By increasing the number of rows, we decrease this chance: (½)^d For a Sketch of 5/3: • Error rate: 40% • Con fi dence in this error rate: 99.87% 99.87% of the time, the counter will be within 40% of the true value For a Sketch of 2000/10: • Error rate: 0.1% • Con fi dence in this error rate: 99,99% 99.99% of the time, the counter will be within 0.1% of the true value