Upgrade to Pro — share decks privately, control downloads, hide ads and more …

Uncovering Hidden Patterns of Molecular Recognition

Uncovering Hidden Patterns of Molecular Recognition

It happened in 1958 that John Kendrew’s group determined the three-dimensional structure of myoglobin at a resolution of 6 Å. This first view of a protein fold was a breakthrough at that time. Now, more than half a century later, both experimental and computational techniques have substantially improved as well as our understanding of how proteins and ligands interact. Yet, there are many unanswered questions to be addressed and patterns to be uncovered.
For instance, we know that precise molecular recognition is necessary for healthy, biological processes. However, the vast -- almost infinite -- number of combinations and varieties of interfacial shapes of chemical group patterns make this problem especially challenging.
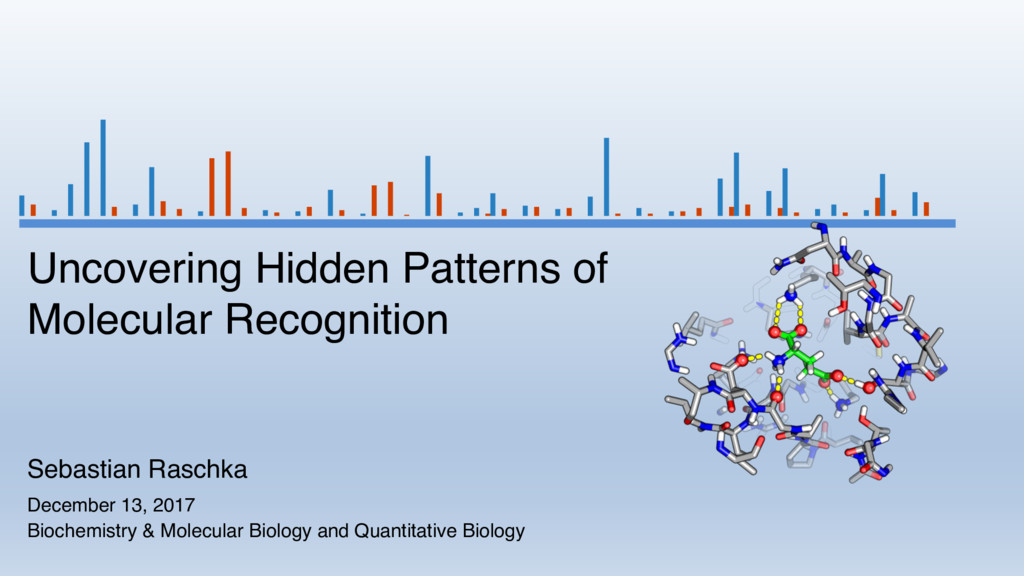
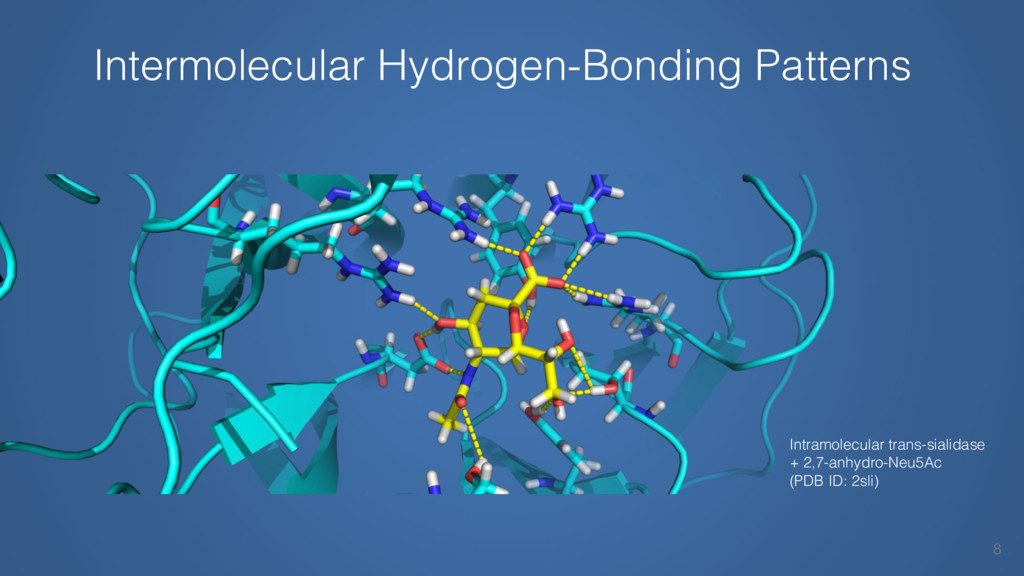
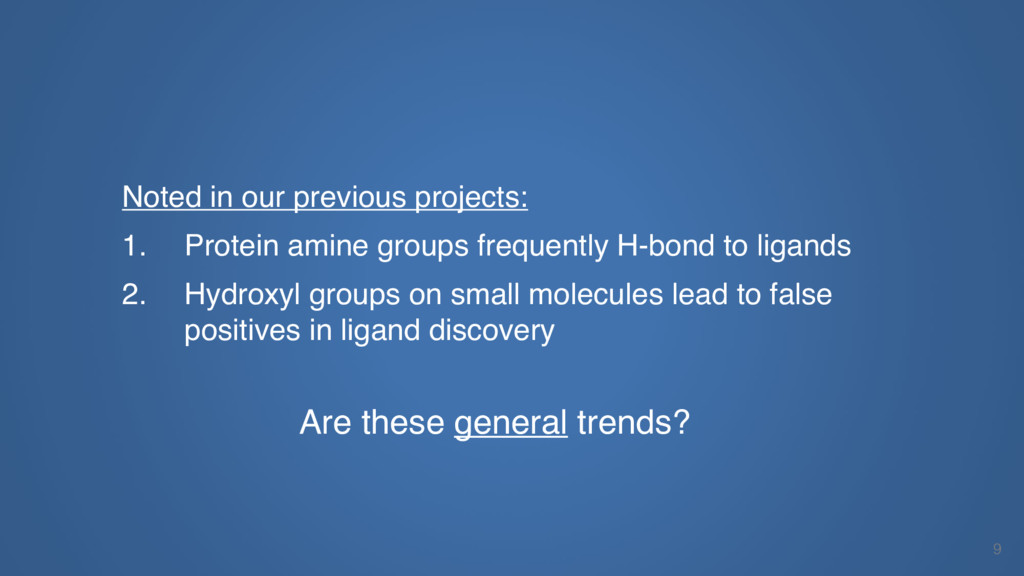
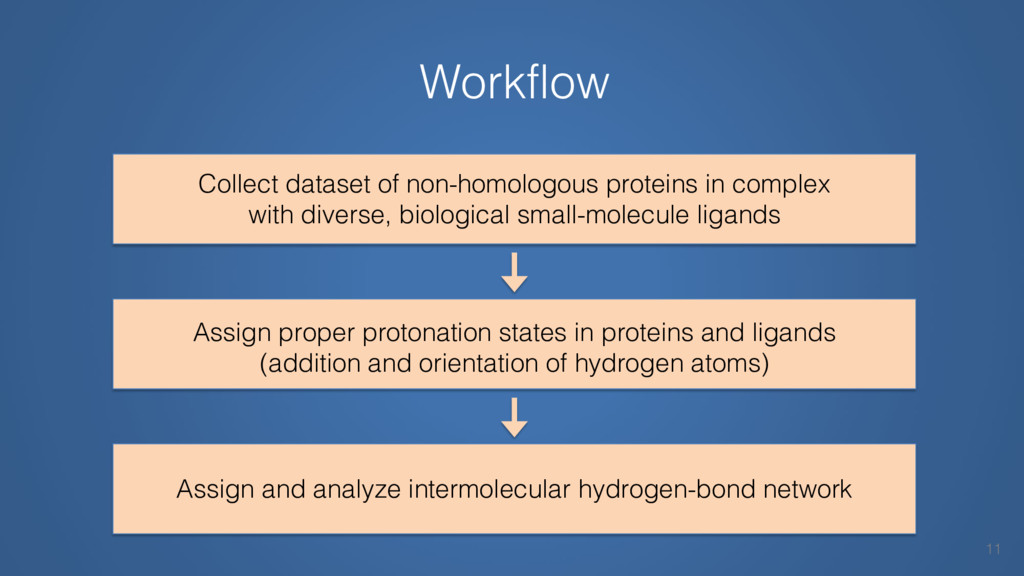
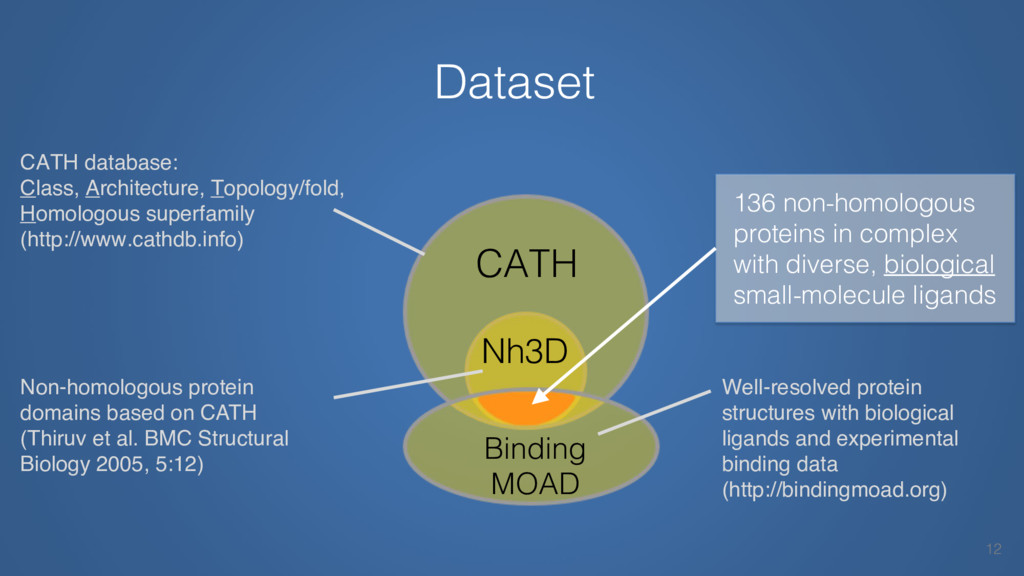
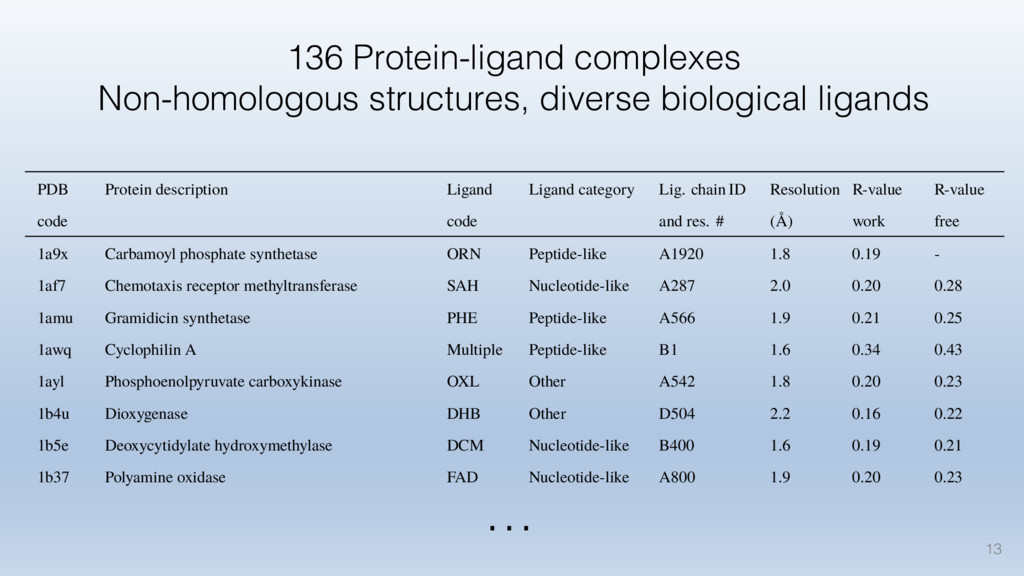
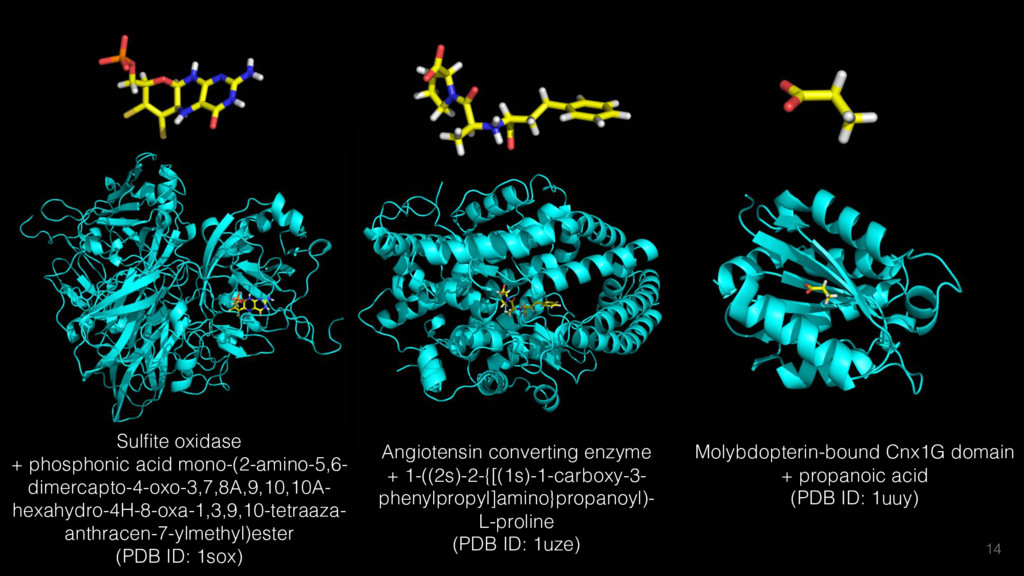
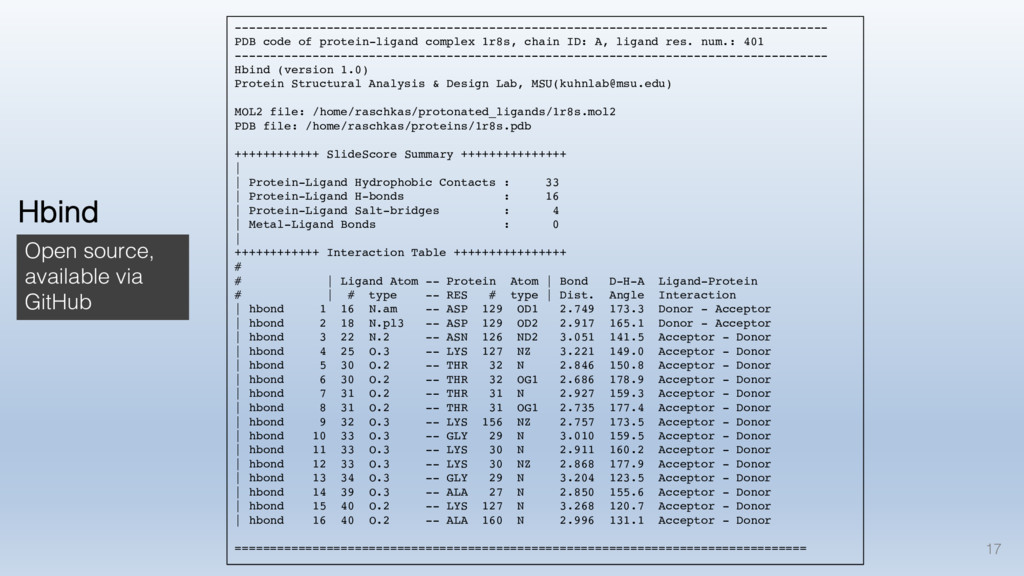
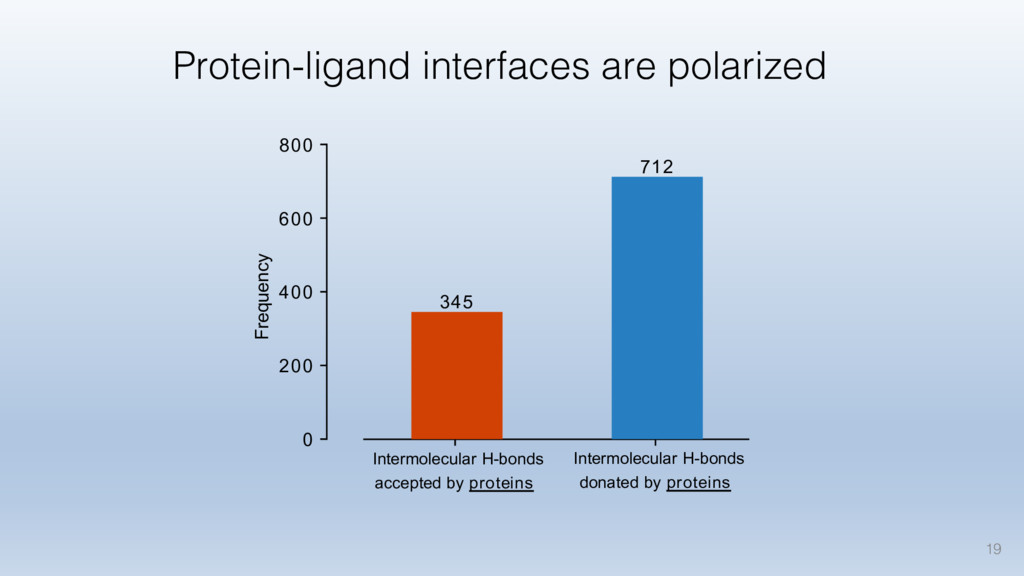
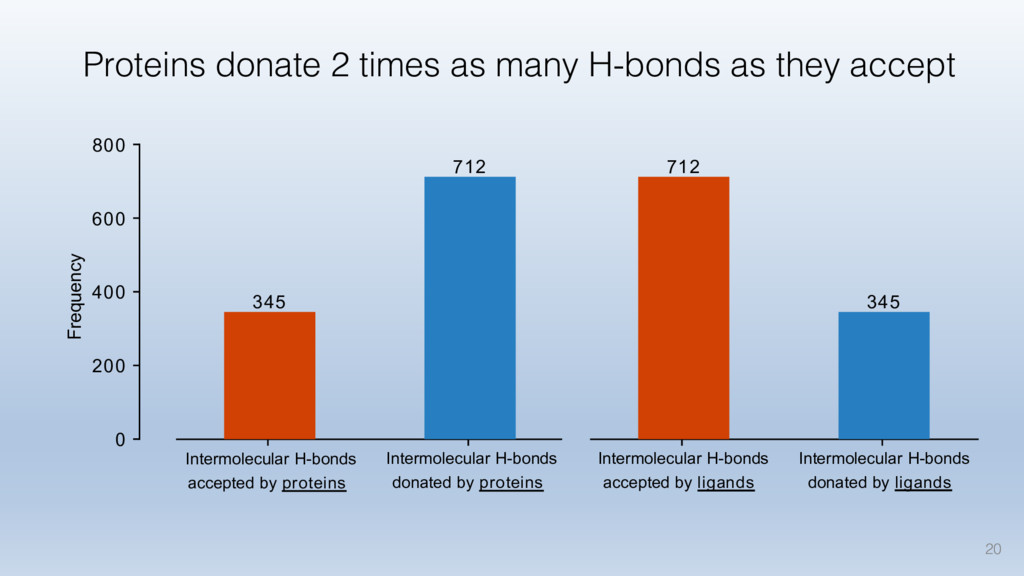
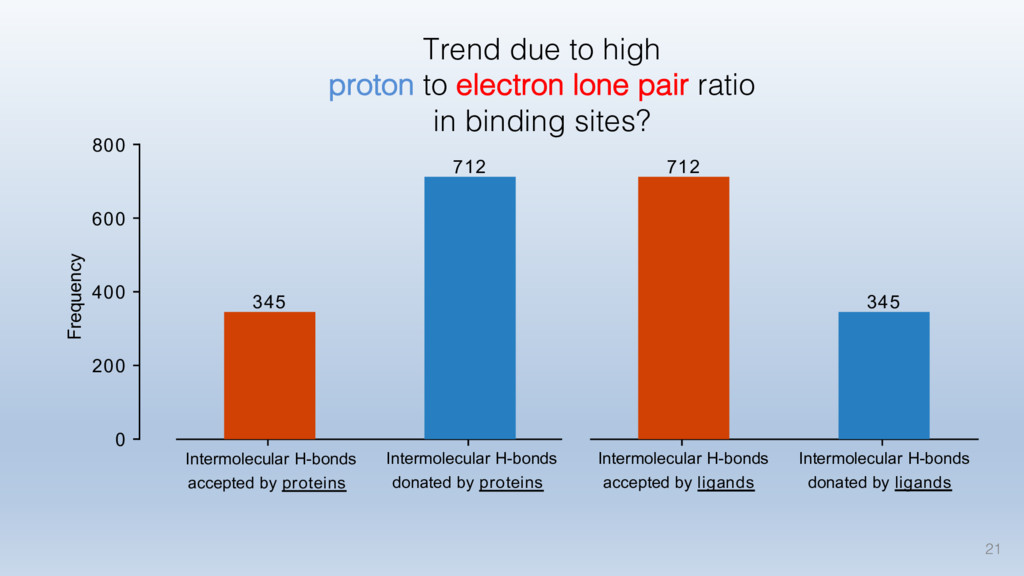
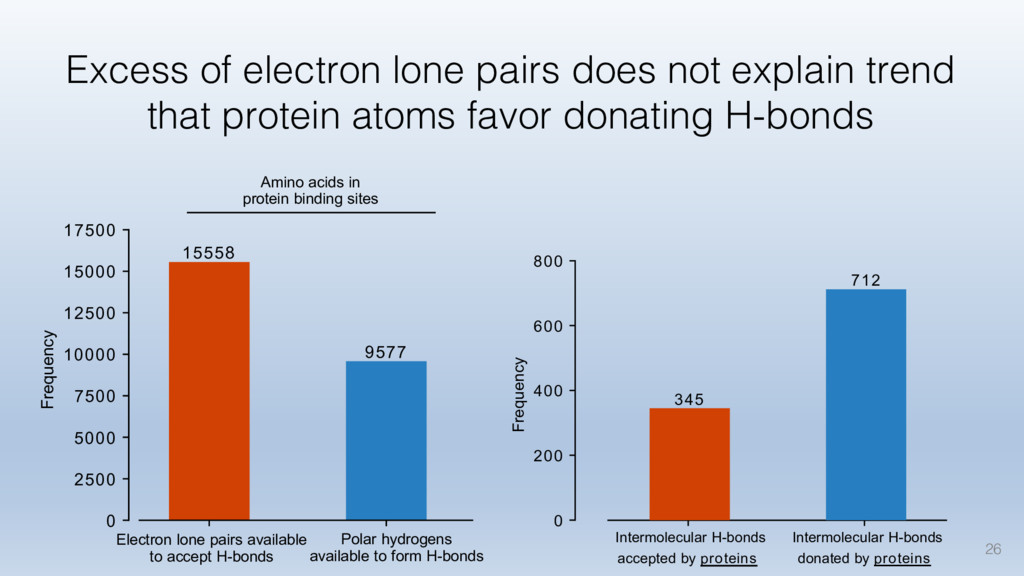
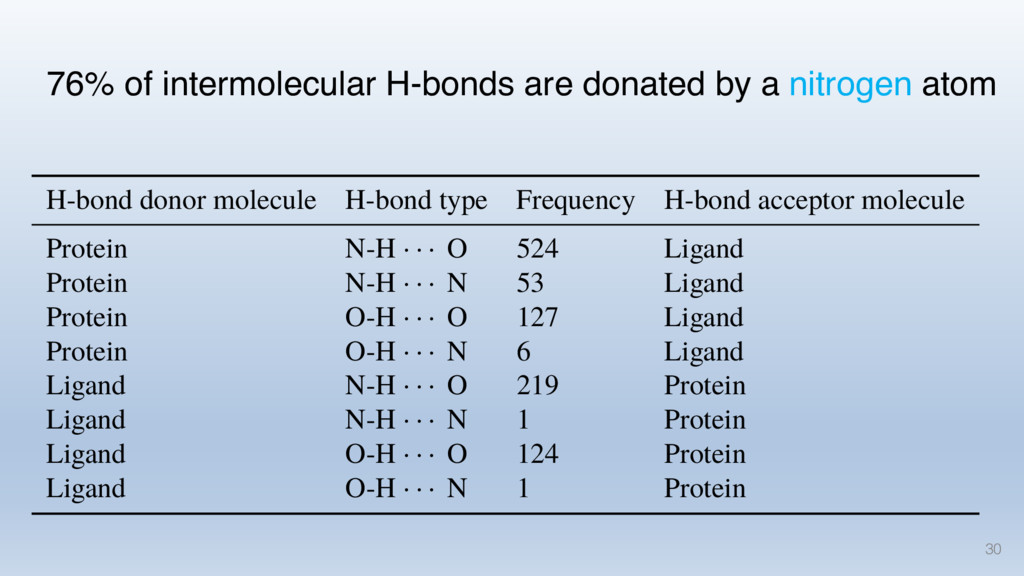
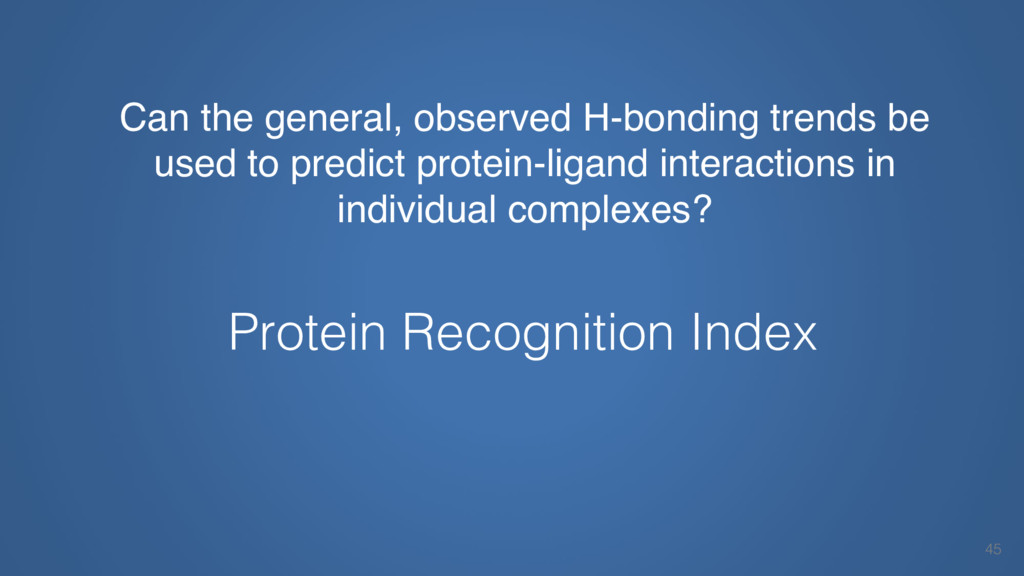
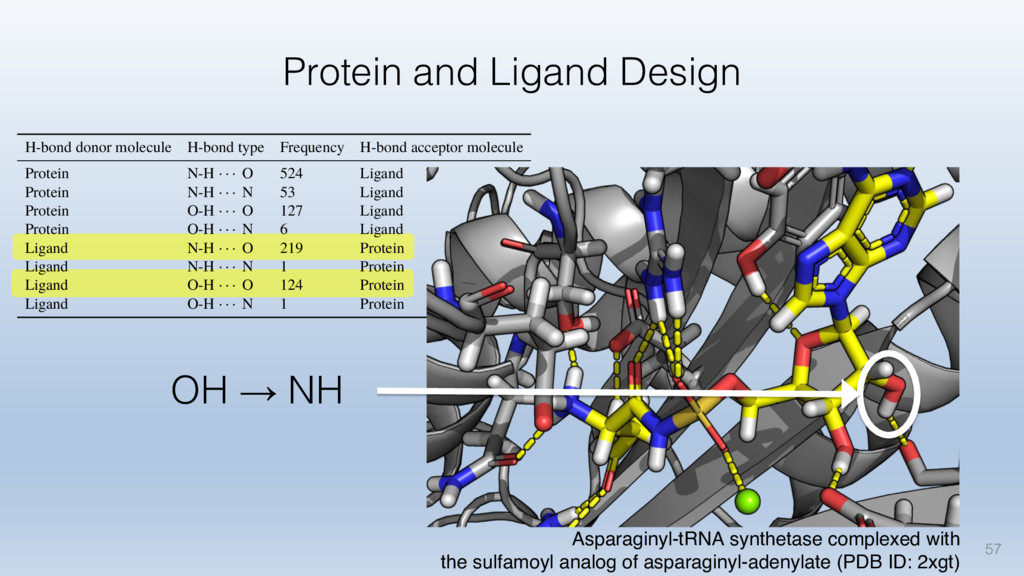
This talk will cover the analysis of a large dataset of non-homologous proteins bound to their biological ligands, to test a hypothesis that arose from observations made throughout different inhibitor discovery projects: "proteins favor donating H-bonds to ligands and avoid using groups with both H-bond donor and acceptor capacity."
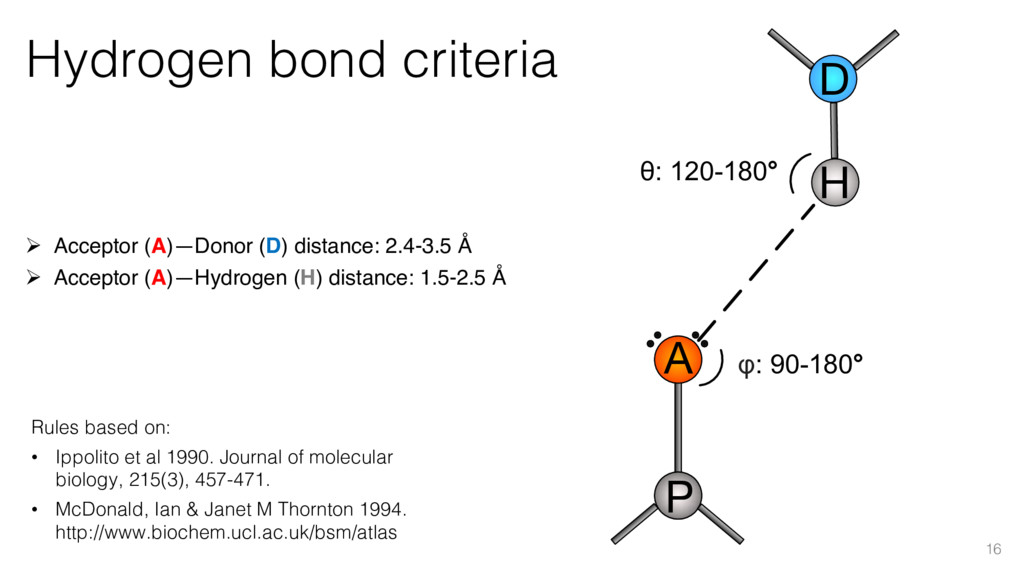
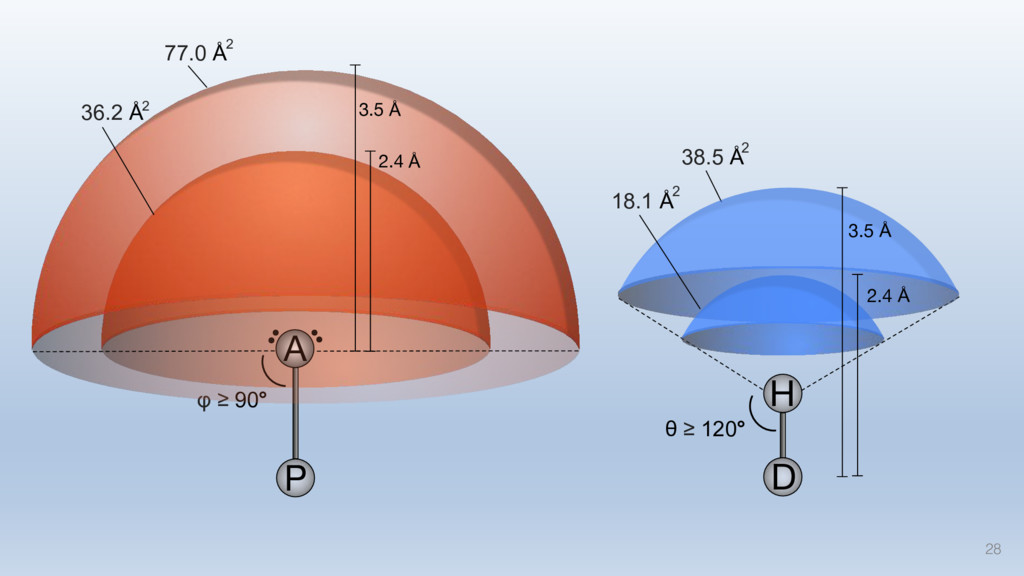
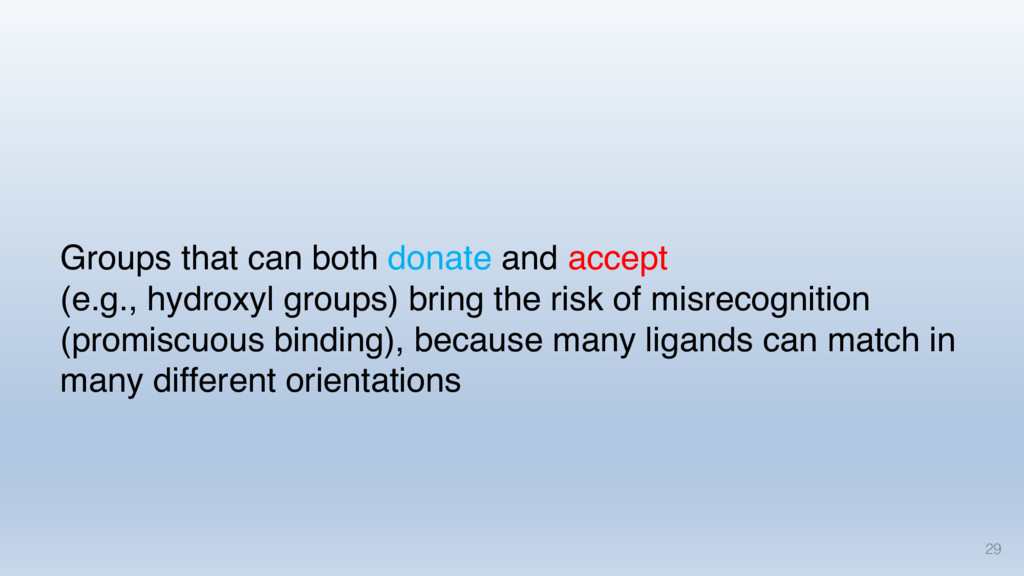
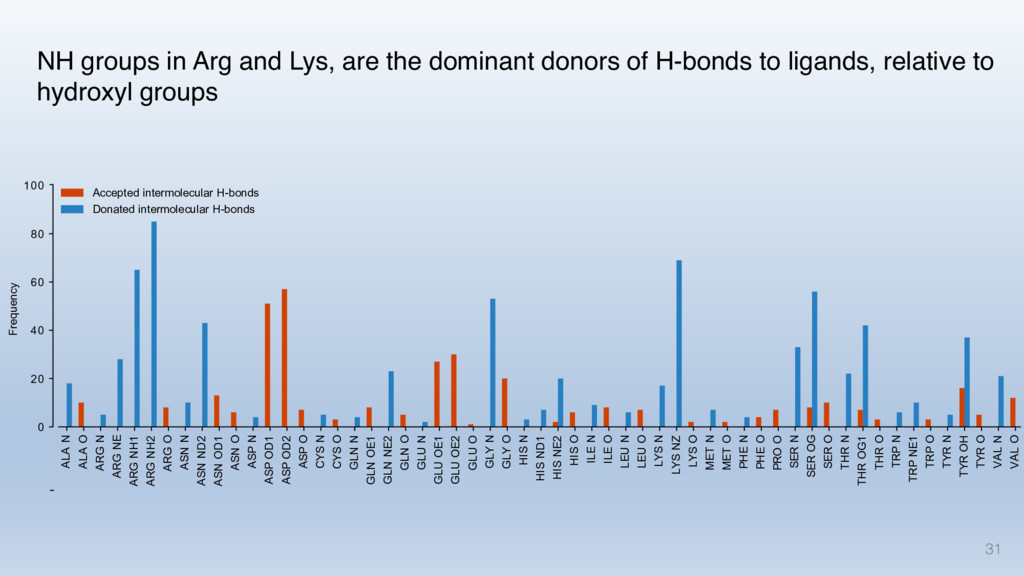
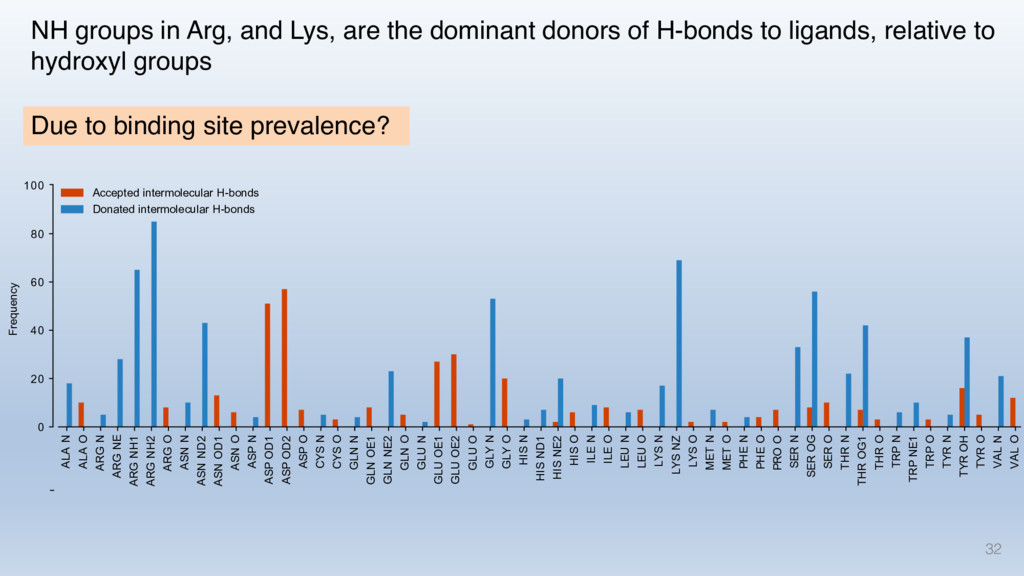
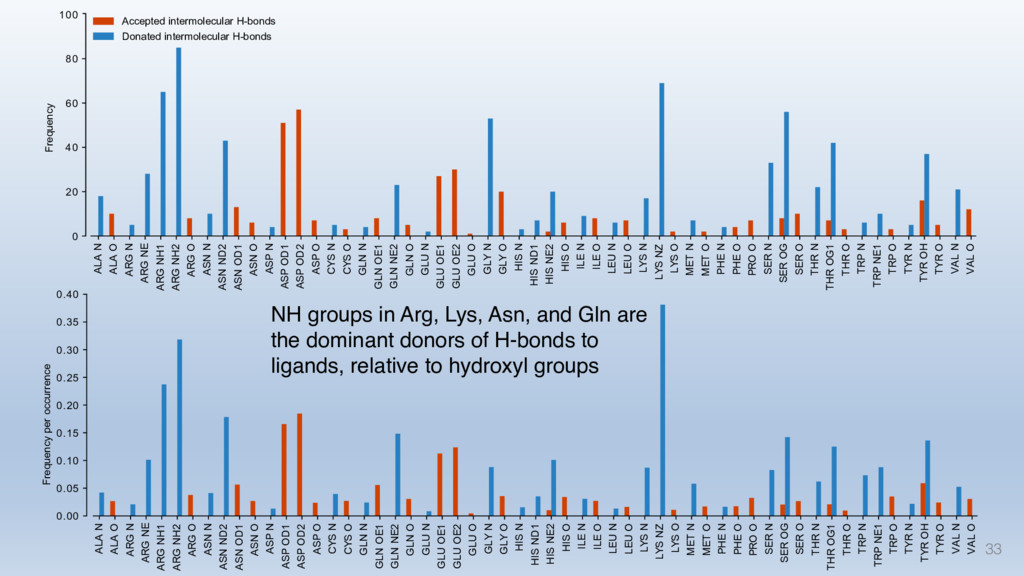
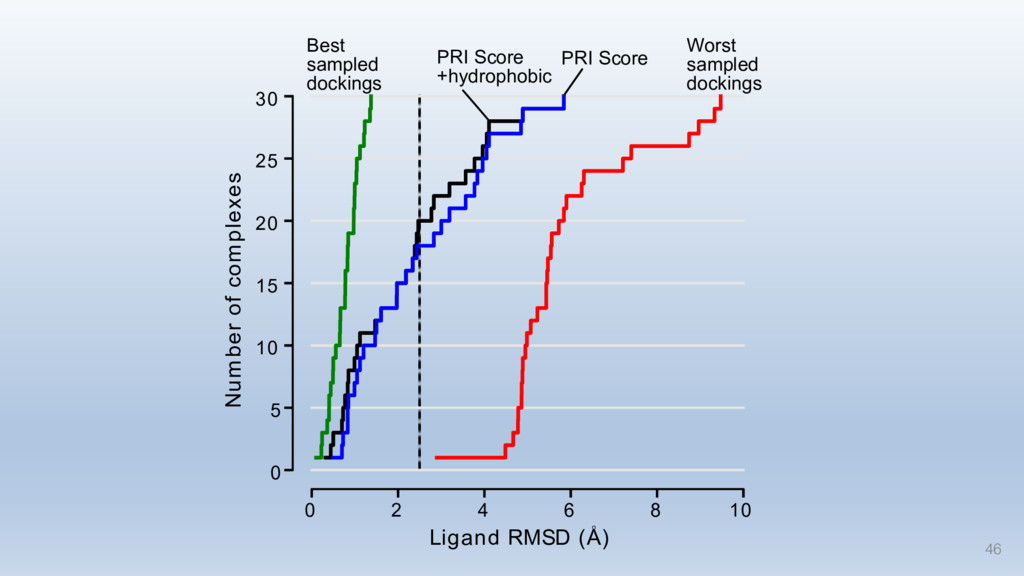
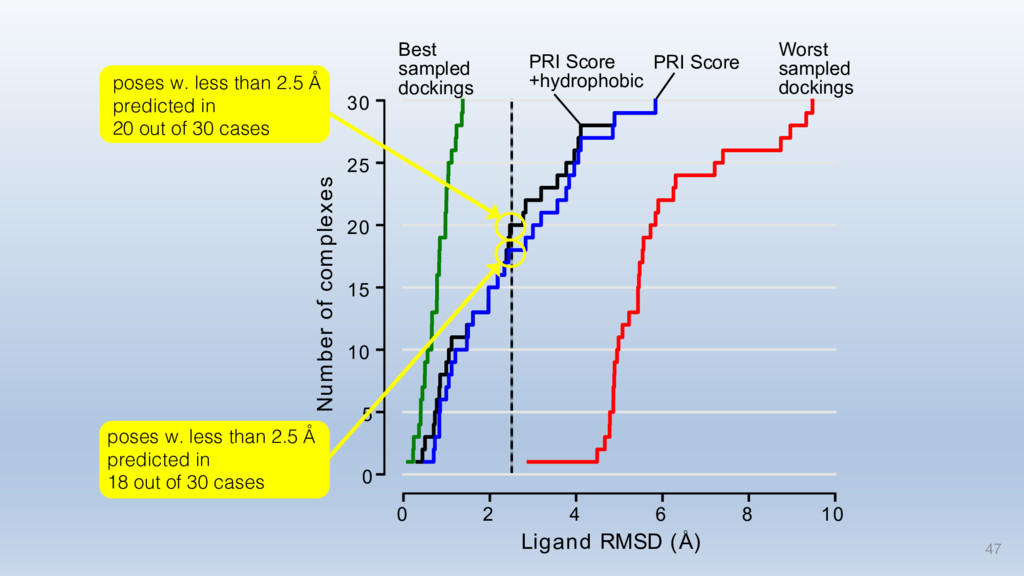
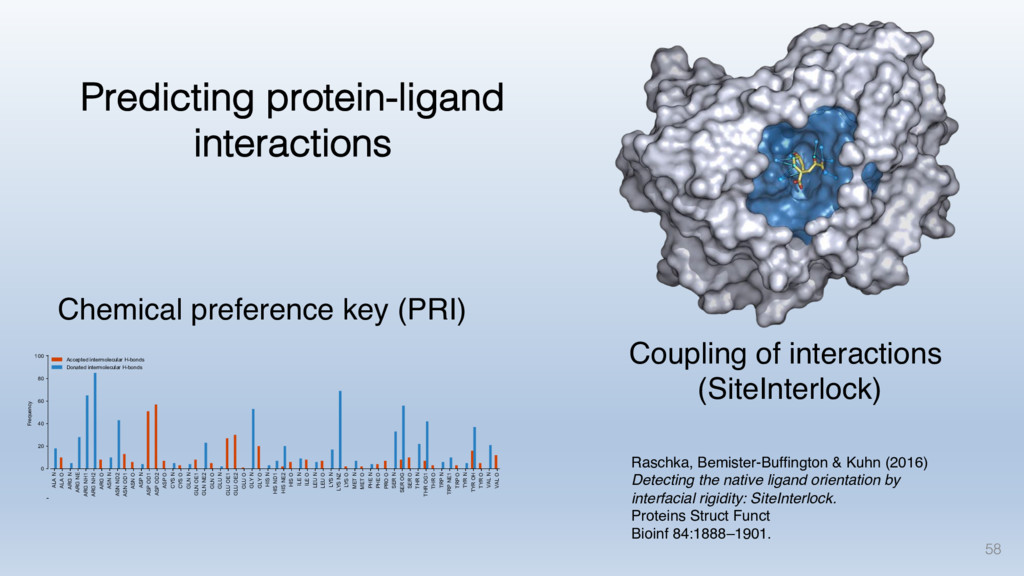
The results reveal clear and strong patterns of chemical group matching preferences for intermolecular hydrogen bonding across a database of non-homologous protein-ligand complexes. It appears that the specificity of ligands is owed to a narrow geometry when forming cognate, intermolecular H-bonds. Hence, both the chemical and geometric constraints are defining a specific hydrogen bonding pattern that is only matched by ligands with the right acceptor-rich key. Further, the results show that a preference key computed based on the patterns of chemical groups participating in H-bonding is sufficient to predict protein-ligand complexes. Finally, the trends observed in this study can guide ligand design and protein mutagenesis in studies of protein-ligand interactions.

Sebastian Raschka

February 08, 2018
Tweet

More Decks by Sebastian Raschka

Other Decks in Science

Transcript

  1. Sebastian Raschka December 13, 2017 Biochemistry & Molecular Biology and

    Quantitative Biology Uncovering Hidden Patterns of Molecular Recognition
  2. 2 SiteInterlock Screenlamp Machine Learning & Chemical Groups 3D Epitope-

    Based Virtual Screening Raschka, Bemister- Buffington & Kuhn (2016) Detecting the native ligand orientation by interfacial rigidity: SiteInterlock. Proteins Struct Funct Bioinf 84:1888–1901. Raschka, Scott, Liu, Gunturu, Huertas, Li & Kuhn (2017) Enabling the hypothesis driven prioritization of ligand candidates in big databases: Screenlamp and its application to GPCR inhibitor discovery. (In revision.) Raschka, Kuhn, Scott, Huertas & Li (2017) Computational Drug Discovery and Design: Automated inference of chemical group discriminants of biological activity from virtual screening data. Springer. (In press.) Raschka, Zeng, Basson & Kuhn (2015-present) 1 2 3 4
  3. 3 isostatic most rigid most flexible Flexibility Index Near-native docking

    pose “Bad” docking pose ite nterlock S I Raschka S, Bemister-Buffington J, Kuhn LA (2016) Detecting the native ligand orientation by interfacial rigidity: SiteInterlock. Proteins: Structure, Function, and Bioinformatics 84:1888–1901 ØNovel insights: Binding site rigidification is a signature of native protein-ligand complex formation ØCaptures the coupling of intermolecular interactions ØCompetitive to state-of-the-art scoring functions for pose prediction; robust (no “very bad” predictions); new information (coupling) https://psa-lab.github.io/siteinterlock/ 1
  4. UETGGPNCOR Raschka, Scott, Liu, Gunturu, Huertas, Li & Kuhn (2017)

    Enabling the hypothesis driven prioritization of ligand candidates in big databases: Screenlamp and its application to GPCR inhibitor discovery. (In revision.) Ø Discovery of a pheromone antagonist that nullifies the GPCR-mediated signaling response in sea lamprey Ø Hypothesis-based virtual screening toolkit for millions of molecules Ø Pioneering aquative invasive species control: Antagonists currently tested in streams Mating pheromone https://psa-lab.github.io/screenlamp/ 2
  5. Machine Learning & Chemical Groups Ø Identification of chemical groups

    in pheromone inhibitors that are important for activity Ø New knowledge to formulate new screening hypotheses and enable ligand design Ø Protocols to determine important chemical groups in other small molecule activity datasets Raschka, Kuhn, Scott, Huertas & Li (2017) Computational Drug Discovery and Design: Automated inference of chemical group discriminants of biological activity from virtual screening data. Springer, 2017. (In press.) https://github.com/psa-lab/predicting-activity-by-machine-learning 3
  6. 6 3D Epitope-Based Virtual Screening ZINC25757351 ZINC13002691 ZINC31501681 Ø Discovery

    of small molecules that can block the interaction between two protein kinases involved in cancer metastasis Ø Novel protocol for blocking protein-protein interactions using 3D ligand-based virtual screening to mimic a protein epitope (does not require structure of the binding partner) Ø Inhibitor candidates from screening >10 million commercially available small molecules currently being tested experimentally (Basson Lab) 4
  7. 7 Protein Recognition Index SiteInterlock Screenlamp Machine Learning & Chemical

    Groups 3D Epitope- Based Virtual Screening Raschka, Bemister- Buffington & Kuhn (2016) Detecting the native ligand orientation by interfacial rigidity: SiteInterlock. Proteins Struct Funct Bioinf 84:1888–1901. Raschka, Scott, Liu, Gunturu, Huertas, Li & Kuhn (2017) Enabling the hypothesis driven prioritization of ligand candidates in big databases: Screenlamp and its application to GPCR inhibitor discovery. (In revision.) Raschka, Kuhn, Scott, Huertas & Li (2017) Computational Drug Discovery and Design: Automated inference of chemical group discriminants of biological activity from virtual screening data. Springer. (In press.) Raschka, Wolf, Bemister- Buffington & Kuhn (2017) Protein-ligand interfaces are polarized: Discovery of a strong trend for intermolecular hydrogen bonds to favor donors on the protein side with implications for predicting and designing ligand complexes. (Submitted.) Raschka, Zeng, Basson & Kuhn (2015-present) 1 2 3 4 5
  8. 9 Noted in our previous projects: Protein amine groups frequently

    H 1. -bond to ligands Hydroxyl groups on small molecules lead to false 2. positives in ligand discovery Are these general trends?
  9. 11 Workflow Collect dataset of non-homologous proteins in complex with

    diverse, biological small-molecule ligands Assign proper protonation states in proteins and ligands (addition and orientation of hydrogen atoms) Assign and analyze intermolecular hydrogen-bond network
  10. 12 Dataset CATH Nh3D Binding MOAD CATH database: Class, Architecture,

    Topology/fold, Homologous superfamily (http://www.cathdb.info) Non-homologous protein domains based on CATH (Thiruv et al. BMC Structural Biology 2005, 5:12) Well-resolved protein structures with biological ligands and experimental binding data (http://bindingmoad.org) 136 non-homologous proteins in complex with diverse, biological small-molecule ligands
  11. 13 problematic in ligand fitting or resolution according to the

    Iridium quality analysis of protein-ligand fitting and refinement (Warren et al., 2012). Table 2.1: List of all 136 protein-ligand complexes evaluated in this study. PDB code Protein description Ligand code Ligand category Lig. chain ID and res. # Resolution (Å) R-value work R-value free 1a9x Carbamoyl phosphate synthetase ORN Peptide-like A1920 1.8 0.19 - 1af7 Chemotaxis receptor methyltransferase SAH Nucleotide-like A287 2.0 0.20 0.28 1amu Gramidicin synthetase PHE Peptide-like A566 1.9 0.21 0.25 1awq Cyclophilin A Multiple Peptide-like B1 1.6 0.34 0.43 1ayl Phosphoenolpyruvate carboxykinase OXL Other A542 1.8 0.20 0.23 1b4u Dioxygenase DHB Other D504 2.2 0.16 0.22 1b5e Deoxycytidylate hydroxymethylase DCM Nucleotide-like B400 1.6 0.19 0.21 1b37 Polyamine oxidase FAD Nucleotide-like A800 1.9 0.20 0.23 1bgv Glutamate dehydrogenase GLU Peptide-like A501 1.9 0.17 - Continued on next page 136 Protein-ligand complexes Non-homologous structures, diverse biological ligands …
  12. 14 Molybdopterin-bound Cnx1G domain + propanoic acid (PDB ID: 1uuy)

    Sulfite oxidase + phosphonic acid mono-(2-amino-5,6- dimercapto-4-oxo-3,7,8A,9,10,10A- hexahydro-4H-8-oxa-1,3,9,10-tetraaza- anthracen-7-ylmethyl)ester (PDB ID: 1sox) Angiotensin converting enzyme + 1-((2s)-2-{[(1s)-1-carboxy-3- phenylpropyl]amino}propanoyl)- L-proline (PDB ID: 1uze)
  13. 15 Protonation State Assignment Obtain structure from PDB Protonate complex

    with Yasara OptHyd + YAMBER force field Compare with quantum mechanical computation (OpenEye MolCharge + AM1-BCC force field) Compare with protonation state def. by chemical experts in literature Glutamate dehydrogenase + glutamic acid (PDB ID: 1bgv)
  14. 16 Rules based on: • Ippolito et al 1990. Journal

    of molecular biology, 215(3), 457-471. • McDonald, Ian & Janet M Thornton 1994. http://www.biochem.ucl.ac.uk/bsm/atlas Ø Acceptor (A)—Donor (D) distance: 2.4-3.5 Å Ø Acceptor (A)—Hydrogen (H) distance: 1.5-2.5 Å Hydrogen bond criteria H D P A P A φ: 90-180° θ: 120-180° H D A A
  15. 17 Open source, available via GitHub ------------------------------------------------------------------------------------ PDB code of

    protein-ligand complex 1r8s, chain ID: A, ligand res. num.: 401 ------------------------------------------------------------------------------------ Hbind (version 1.0) Protein Structural Analysis & Design Lab, MSU([email protected]) MOL2 file: /home/raschkas/protonated_ligands/1r8s.mol2 PDB file: /home/raschkas/proteins/1r8s.pdb ++++++++++++ SlideScore Summary +++++++++++++++ | | Protein-Ligand Hydrophobic Contacts : 33 | Protein-Ligand H-bonds : 16 | Protein-Ligand Salt-bridges : 4 | Metal-Ligand Bonds : 0 | ++++++++++++ Interaction Table ++++++++++++++++ # # | Ligand Atom -- Protein Atom | Bond D-H-A Ligand-Protein # | # type -- RES # type | Dist. Angle Interaction | hbond 1 16 N.am -- ASP 129 OD1 2.749 173.3 Donor - Acceptor | hbond 2 18 N.pl3 -- ASP 129 OD2 2.917 165.1 Donor - Acceptor | hbond 3 22 N.2 -- ASN 126 ND2 3.051 141.5 Acceptor - Donor | hbond 4 25 O.3 -- LYS 127 NZ 3.221 149.0 Acceptor - Donor | hbond 5 30 O.2 -- THR 32 N 2.846 150.8 Acceptor - Donor | hbond 6 30 O.2 -- THR 32 OG1 2.686 178.9 Acceptor - Donor | hbond 7 31 O.2 -- THR 31 N 2.927 159.3 Acceptor - Donor | hbond 8 31 O.2 -- THR 31 OG1 2.735 177.4 Acceptor - Donor | hbond 9 32 O.3 -- LYS 156 NZ 2.757 173.5 Acceptor - Donor | hbond 10 33 O.3 -- GLY 29 N 3.010 159.5 Acceptor - Donor | hbond 11 33 O.3 -- LYS 30 N 2.911 160.2 Acceptor - Donor | hbond 12 33 O.3 -- LYS 30 NZ 2.868 177.9 Acceptor - Donor | hbond 13 34 O.3 -- GLY 29 N 3.204 123.5 Acceptor - Donor | hbond 14 39 O.3 -- ALA 27 N 2.850 155.6 Acceptor - Donor | hbond 15 40 O.2 -- LYS 127 N 3.268 120.7 Acceptor - Donor | hbond 16 40 O.2 -- ALA 160 N 2.996 131.1 Acceptor - Donor ================================================================================= Hbind
  16. 18 Workflow Collect dataset of non-homologous proteins in complex with

    diverse, biological small-molecule ligands Assign proper protonation states in proteins and ligands (addition and orientation of hydrogen atoms) Assign and analyze intermolecular hydrogen-bond network
  17. 19 ecular H-bonds d by ligands Intermolecular H-bonds donated by

    ligands Intermolecular H-bonds accepted by proteins Intermolecular H-bonds donated by proteins 712 345 345 712 Intermolecular H-bonds accepted by ligands Intermolecular H-bonds donated by ligands 0 200 400 600 800 Frequency Intermolecular H-bonds accepted by proteins Interm dona 712 345 345 Protein-ligand interfaces are polarized
  18. 20 olecular H-bonds ted by ligands Intermolecular H-bonds accepted by

    proteins Intermolecular H-bonds donated by proteins 345 345 712 Intermolecular H-bonds accepted by ligands Intermolecular H-bonds donated by ligands 0 200 400 600 800 Frequency Intermolecular H-bonds accepted by proteins Intermolecular H-bonds donated by proteins 712 345 345 712 Intermolecular H-bonds accepted by ligands Intermolecular H-bonds donated by ligands 0 200 400 600 800 Frequency 712 345 Proteins donate 2 times as many H-bonds as they accept
  19. olecular H-bonds ted by ligands Intermolecular H-bonds accepted by proteins

    Intermolecular H-bonds donated by proteins 345 345 712 Intermolecular H-bonds accepted by ligands Intermolecular H-bonds donated by ligands 0 200 400 600 800 Frequency Intermolecular H-bonds accepted by proteins Intermolecular H-bonds donated by proteins 712 345 345 712 Intermolecular H-bonds accepted by ligands Intermolecular H-bonds donated by ligands 0 200 400 600 800 Frequency 712 345 21 Trend due to high proton to electron lone pair ratio in binding sites?
  20. 23 2 H & 2 LP 1 H & 2

    LP 2 H & 2 LP 1 H & 2 LP 1 H & 2 LP … Protons and electron lone pairs on amino acid side chains : : : : : : : : : :
  21. 25 Excess of electron lone pairs does not explain trend

    that protein atoms favor donating H-bonds Electron lone pairs available to accept H-bonds Amino acids in protein binding sites Polar hydrogens available to form H-bonds 0 2500 5000 7500 10000 12500 15000 17500 Frequency 15558 9577
  22. 26 Excess of electron lone pairs does not explain trend

    that protein atoms favor donating H-bonds Intermolecular H-bonds accepted by ligands Intermolecular H-bonds donated by ligands 0 200 400 600 800 Frequency Intermolecular H-bonds accepted by proteins Intermolecular H-bonds donated by proteins 712 345 345 712 Intermolecular H-bonds accepted by ligands Intermolecular H-bonds donated by ligands 0 200 400 600 800 Frequency Intermo accepte 712 345 Electron lone pairs available to accept H-bonds Amino acids in protein binding sites Polar hydrogens available to form H-bonds 0 2500 5000 7500 10000 12500 15000 17500 Frequency 15558 9577
  23. 28 A φ ≥ 90° 77.0 Å2 P 36.2 Å2

    2.4 Å 3.5 Å θ ≥ 120° D 38.5 Å2 18.1 Å2 2.4 Å H 3.5 Å
  24. 29 Groups that can both donate and accept (e.g., hydroxyl

    groups) bring the risk of misrecognition (promiscuous binding), because many ligands can match in many different orientations
  25. 30 76% of intermolecular H-bonds are donated by a nitrogen

    atom le 2.2: Intermolecular NH versus OH hydrogen bond donor frequencies for oxygen and nitrog ptors. H-bond donor molecule H-bond type Frequency H-bond acceptor molecule Protein N-H · · · O 524 Ligand Protein N-H · · · N 53 Ligand Protein O-H · · · O 127 Ligand Protein O-H · · · N 6 Ligand Ligand N-H · · · O 219 Protein Ligand N-H · · · N 1 Protein Ligand O-H · · · O 124 Protein Ligand O-H · · · N 1 Protein
  26. 31 NH groups in Arg and Lys, are the dominant

    donors of H-bonds to ligands, relative to hydroxyl groups ALA N ALA O ARG N ARG NE ARG NH1 ARG NH2 ARG O ASN N ASN ND2 ASN OD1 ASN O ASP N ASP OD1 ASP OD2 ASP O CYS N CYS O GLN N GLN OE1 GLN NE2 GLN O GLU N GLU OE1 GLU OE2 GLU O GLY N GLY O HIS N HIS ND1 HIS NE2 HIS O ILE N ILE O LEU N LEU O LYS N LYS NZ LYS O MET N MET O PHE N PHE O PRO O SER N SER OG SER O THR N THR OG1 THR O TRP N TRP NE1 TRP O TYR N TYR OH TYR O VAL N VAL O 0 20 40 60 80 100 Frequency Accepted intermolecular H-bonds Donated intermolecular H-bonds
  27. 32 NH groups in Arg, and Lys, are the dominant

    donors of H-bonds to ligands, relative to hydroxyl groups ALA N ALA O ARG N ARG NE ARG NH1 ARG NH2 ARG O ASN N ASN ND2 ASN OD1 ASN O ASP N ASP OD1 ASP OD2 ASP O CYS N CYS O GLN N GLN OE1 GLN NE2 GLN O GLU N GLU OE1 GLU OE2 GLU O GLY N GLY O HIS N HIS ND1 HIS NE2 HIS O ILE N ILE O LEU N LEU O LYS N LYS NZ LYS O MET N MET O PHE N PHE O PRO O SER N SER OG SER O THR N THR OG1 THR O TRP N TRP NE1 TRP O TYR N TYR OH TYR O VAL N VAL O 0 20 40 60 80 100 Frequency Accepted intermolecular H-bonds Donated intermolecular H-bonds Due to binding site prevalence?
  28. 33 ALA N ALA O ARG N ARG NE ARG

    NH1 ARG NH2 ARG O ASN N ASN ND2 ASN OD1 ASN O ASP N ASP OD1 ASP OD2 ASP O CYS N CYS O GLN N GLN OE1 GLN NE2 GLN O GLU N GLU OE1 GLU OE2 GLU O GLY N GLY O HIS N HIS ND1 HIS NE2 HIS O ILE N ILE O LEU N LEU O LYS N LYS NZ LYS O MET N MET O PHE N PHE O PRO O SER N SER OG SER O THR N THR OG1 THR O TRP N TRP NE1 TRP O TYR N TYR OH TYR O VAL N VAL O 0.00 0.05 0.10 0.15 0.20 0.25 0.30 0.35 0.40 Frequency per occurrence ALA N ALA O ARG N ARG NE ARG NH1 ARG NH2 ARG O ASN N ASN ND2 ASN OD1 ASN O ASP N ASP OD1 ASP OD2 ASP O CYS N CYS O GLN N GLN OE1 GLN NE2 GLN O GLU N GLU OE1 GLU OE2 GLU O GLY N GLY O HIS N HIS ND1 HIS NE2 HIS O ILE N ILE O LEU N LEU O LYS N LYS NZ LYS O MET N MET O PHE N PHE O PRO O SER N SER OG SER O THR N THR OG1 THR O TRP N TRP NE1 TRP O TYR N TYR OH TYR O VAL N VAL O 0 20 40 60 80 100 Frequency Accepted intermolecular H-bonds Donated intermolecular H-bonds NH groups in Arg, Lys, Asn, and Gln are the dominant donors of H-bonds to ligands, relative to hydroxyl groups
  29. 34 Protein Recognition Index (PRI) Can the observed H-bonding trends

    be used to predict protein-ligand interactions?
  30. 38 19 holo & 11 apo structures for docking, not

    overlapping with 136 complexes Raschka S, Bemister-Buffington J, Kuhn LA (2016) Detecting the native ligand orientation by interfacial rigidity: SiteInterlock. Proteins Struct Funct Bioinf 84:1888–1901.
  31. Subset of docking poses sampled for scoring (sampled protein side-

    chains not shown) Glutathione s-transferase + modified glutathione inhibitor (PDB ID: 10gs)
  32. 2.8 Å RMSD 1.0 Å RMSD Crystal Pose Crystal structure

    of the complex between carboxypeptidase A and the biproduct analog inhibitor L-benzylsuccinate (PDB code: 1cbx)
  33. 2.8 Å RMSD 1.0 Å RMSD Crystal Pose Crystal structure

    of the complex between carboxypeptidase A and the biproduct analog inhibitor L-benzylsuccinate (PDB code: 1cbx) 1 1’ 2 3 3’ 2’
  34. 45 Protein Recognition Index Can the general, observed H-bonding trends

    be used to predict protein-ligand interactions in individual complexes?
  35. 46 0 2 4 6 8 10 Ligand RMSD (A)

    0 5 10 15 20 25 30 Number of complexes Best sampled dockings PRI Score PRI Score +hydrophobic Worst sampled dockings o
  36. 47 0 2 4 6 8 10 Ligand RMSD (A)

    0 5 10 15 20 25 30 Number of complexes Best sampled dockings PRI Score PRI Score +hydrophobic Worst sampled dockings o poses w. less than 2.5 Å predicted in 18 out of 30 cases poses w. less than 2.5 Å predicted in 20 out of 30 cases
  37. 48 H-bond interaction statistics accumulated across 136 structures capture the

    essential molecular recognition features that occur within individual structures sufficiently well enough to discriminate native interactions
  38. 49 1. No more than 5 hydrogen bond donors 2.

    No more than 10 hydrogen bond acceptors 3. A molecular mass less than 500 daltons 4. An octanol-water partition coefficient log P not greater than 5 Comparison to Lipinski’s rule of five for orally active drugs Violation results in poor absorption or permeability Lipinski CA, Lombardo F, Dominy BW, Feeney PJ (1997) Experimental and computa1onal approaches to es1mate solubility and permeability in drug discovery and development se8ngs. Adv Drug Deliv Rev 23:3–25.
  39. 50 1. No more than 5 hydrogen bond donors 2.

    No more than 10 hydrogen bond acceptors 3. A molecular mass less than 500 daltons 4. An octanol-water partition coefficient log P not greater than 5 * All numbers are multiples of 5 (origin of the name) Comparison to Lipinski’s rule of five for orally active drugs Violation results in poor absorption or permeability
  40. 51 Comparison to Lipinski’s rule of five for orally active

    drugs Analysis of interactions (rather than physicochemical • properties of ligands) Twice as many H • -bonds being accepted by ligands as donated • N-H donors are favored over O-H donors High preference for certain amino acid side chains • (Arg, Lys) Protein Recognition Index predictive of how a ligand • interacts
  41. 53 Conclusions o Protein-ligand interfaces are polarized: proteins donate twice

    as many H-bonds as they accept o H-bond donors and N-H over O-H groups are preferred, allowing for higher ligand selectivity o Lys, Arg, Glu, and Asp (charged amino acids) are preferred in intermolecular H-bonds o A chemical preference key (PRI) provides chemical insights for predicting protein-ligand complexes
  42. 54 Conclusions o Protein-ligand interfaces are polarized: proteins donate twice

    as many H-bonds as they accept o H-bond donors and N-H over O-H groups are preferred, allowing for higher ligand selectivity o Lys, Arg, Glu, and Asp (charged amino acids) are preferred in intermolecular H-bonds o A chemical preference key (PRI) provides chemical insights for predicting protein-ligand complexes Both Hbind and PRI software will be made available (open source)
  43. le 2.2: Intermolecular NH versus OH hydrogen bond donor frequencies

    for oxygen and nitrogen ptors. H-bond donor molecule H-bond type Frequency H-bond acceptor molecule Protein N-H · · · O 524 Ligand Protein N-H · · · N 53 Ligand Protein O-H · · · O 127 Ligand Protein O-H · · · N 6 Ligand Ligand N-H · · · O 219 Protein Ligand N-H · · · N 1 Protein Ligand O-H · · · O 124 Protein Ligand O-H · · · N 1 Protein 2 Can the observed trends in interfacial polarity, with H-bonds tending to be formed by donors on the protein side of the interface interacting with acceptors on the ligand side, be explained by the prevalence of binding-site protons versus lone pairs? nswer this question, the binding site was defined as all protein residues with at least one heavy m within 9 Å of a ligand heavy atom. This set of potentially interacting atoms is typically d for interfacial analysis or scoring. All the previously mentioned criteria were then applied to tify intermolecular H-bonds, namely, meeting the 2.4-3.5 Å range for donor-acceptor distance satisfying both the donor-H-acceptor and preacceptor-acceptor-H angular criteria. An example 56 Protein and Ligand Design Asparaginyl-tRNA synthetase complexed with the sulfamoyl analog of asparaginyl-adenylate (PDB ID: 2xgt)
  44. le 2.2: Intermolecular NH versus OH hydrogen bond donor frequencies

    for oxygen and nitrogen ptors. H-bond donor molecule H-bond type Frequency H-bond acceptor molecule Protein N-H · · · O 524 Ligand Protein N-H · · · N 53 Ligand Protein O-H · · · O 127 Ligand Protein O-H · · · N 6 Ligand Ligand N-H · · · O 219 Protein Ligand N-H · · · N 1 Protein Ligand O-H · · · O 124 Protein Ligand O-H · · · N 1 Protein 2 Can the observed trends in interfacial polarity, with H-bonds tending to be formed by donors on the protein side of the interface interacting with acceptors on the ligand side, be explained by the prevalence of binding-site protons versus lone pairs? nswer this question, the binding site was defined as all protein residues with at least one heavy m within 9 Å of a ligand heavy atom. This set of potentially interacting atoms is typically d for interfacial analysis or scoring. All the previously mentioned criteria were then applied to tify intermolecular H-bonds, namely, meeting the 2.4-3.5 Å range for donor-acceptor distance satisfying both the donor-H-acceptor and preacceptor-acceptor-H angular criteria. An example Asparaginyl-tRNA synthetase complexed with the sulfamoyl analog of asparaginyl-adenylate (PDB ID: 2xgt) 57 Protein and Ligand Design OH → NH
  45. 58 Raschka, Bemister-Buffington & Kuhn (2016) Detecting the native ligand

    orientation by interfacial rigidity: SiteInterlock. Proteins Struct Funct Bioinf 84:1888–1901. ALA N ALA O ARG N ARG NE ARG NH1 ARG NH2 ARG O ASN N ASN ND2 ASN OD1 ASN O ASP N ASP OD1 ASP OD2 ASP O CYS N CYS O GLN N GLN OE1 GLN NE2 GLN O GLU N GLU OE1 GLU OE2 GLU O GLY N GLY O HIS N HIS ND1 HIS NE2 HIS O ILE N ILE O LEU N LEU O LYS N LYS NZ LYS O MET N MET O PHE N PHE O PRO O SER N SER OG SER O THR N THR OG1 THR O TRP N TRP NE1 TRP O TYR N TYR OH TYR O VAL N VAL O 0 20 40 60 80 100 Frequency Accepted intermolecular H-bonds Donated intermolecular H-bonds Chemical preference key (PRI) Coupling of interactions (SiteInterlock) Predicting protein-ligand interactions
  46. 59 Hotspots in Protein-Protein Binding Sites N.J. Agrawal et al.

    / FEBS Letters 588 (2014) 326–333 331 Figure adapted from Agrawal NJ, Helk B, Trout BL (2014). FEBS Lett 588:326–333. doi:10.1016/j.febslet.2013.11.004 Experimentally determined hotspot residues in IL-13
  47. 60 Acknowledgements Guidance Committee Dr. David Arnosti Dr. Titus Brown

    Dr. Michael Feig Dr. Jian Hu Dr. Cheryl Kerfeld Dr. Leslie Kuhn (Mentor) Kuhn Lab Joe Bemister-Buffington Jiaxing Chen Santosh Gunturu John Johnston Dr. Nan Liu Alex Wolf Collaborators (Screenlamp) Dr. Mar Huertas Dr. Weiming Li Anne Scott Graduate Programs and BMB Staff Dr. Michael Garavito Dr. Jon Kaguni Dr. John LaPres Jessica Lawrence Jeannine Lee Becky Conat Mansel Kaillathe (Pappan) Padmanabhan iPRoBe Lab Dr. Vahid Mirjalili Dr. Arun Ross
  48. 61 SiteInterlock Screenlamp Machine Learning & Chemical Groups 3D Epitope-

    Based Virtual Screening Raschka, Bemister- Buffington & Kuhn (2016) Detecting the native ligand orientation by interfacial rigidity: SiteInterlock. Proteins Struct Funct Bioinf 84:1888–1901. Raschka, Scott, Liu, Gunturu, Huertas, Li & Kuhn (2017) Enabling the hypothesis driven prioritization of ligand candidates in big databases: Screenlamp and its application to GPCR inhibitor discovery. (In revision.) Raschka, Kuhn, Scott, Huertas & Li (2017) Computational Drug Discovery and Design: Automated inference of chemical group discriminants of biological activity from virtual screening data. Springer. (In press.) Raschka, Wolf, Bemister- Buffington & Kuhn (2017) Protein-ligand interfaces are polarized: Discovery of a strong trend for intermolecular hydrogen bonds to favor donors on the protein side with implications for predicting and designing ligand complexes. (Submitted.) Raschka, Zeng, Basson & Kuhn (2015-present) 1 2 3 4 5 Protein Recognition Index