Upgrade to Pro — share decks privately, control downloads, hide ads and more …

Lizard developer explanation

Lizard developer explanation

Explanation of the background of Lizard geographic websites.

Reinout van Rees

March 28, 2012
Tweet

More Decks by Reinout van Rees

Other Decks in Technology

Transcript

  1. Lizard: geographic websites for water management Reinout van Rees Lizard

    is an open source system for making geographic water management websites.
  2. Geografic info website A geographic information website has a way

    to browse and select the data, a map and graphs and so.
  3. “Apps”: data sources Lizard is structured with plugins: applications. Every

    app can have a separate data source. Excel files, netcdf, WMS, shapefiles, FEWS databases: basically everything.
  4. Workspace + map Once selected, an item moves into the

    “workspace”, basically a collection of layers. The workspace is visualized on the map.
  5. Graph popup Clicking on the map gives you a graph

    (or something else, this is configurable per app).
  6. Technologies •Python •Django •Mapnik •Matplotlib •Gdal •Pyproj •Jquery •Openlayers (or

    leaflet) •Blueprint css (or bootstrap) Lots and lots and lots of re-use of open source libraries.
  7. Mapnik •Openstreetmap’s rendering engine •Points, lines, grids •WMS standard •PNG

    output Mapnik for rendering our own maps. We also use geoserver for some layers.
  8. Matplotlib •Graph library •Can do everything •Others easier, but with

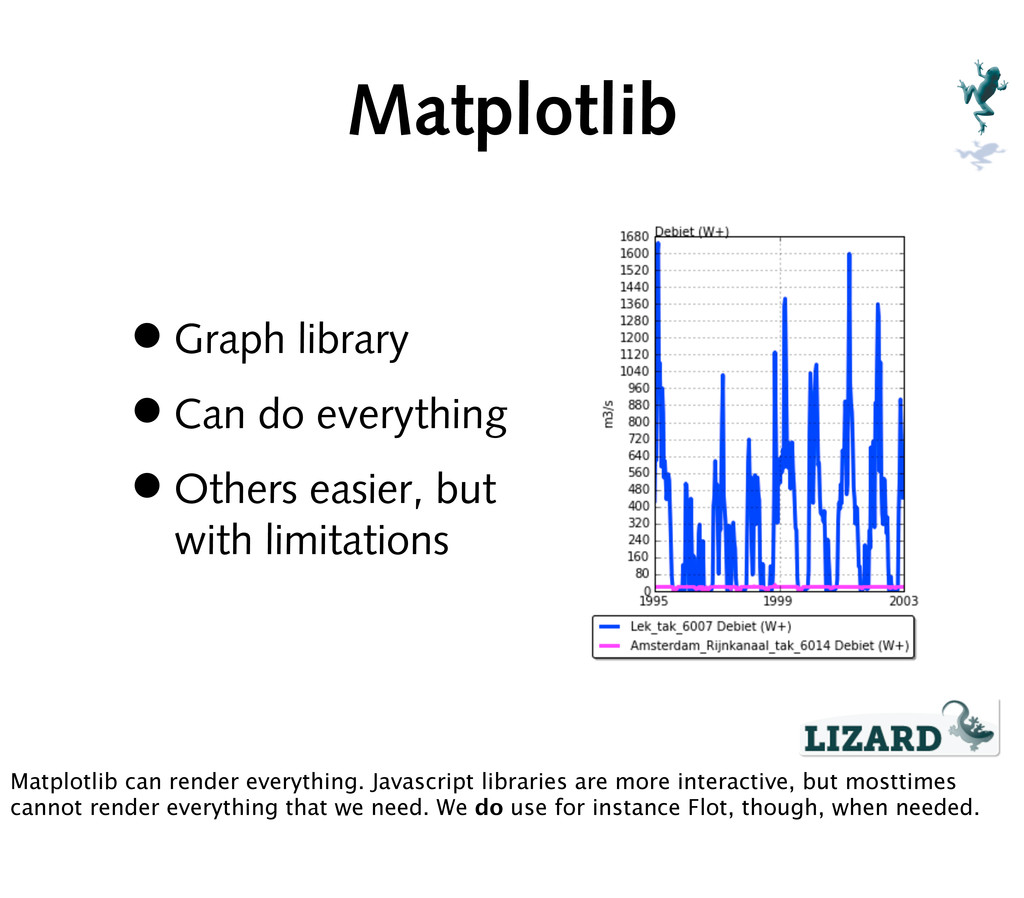
    limitations Matplotlib can render everything. Javascript libraries are more interactive, but mosttimes cannot render everything that we need. We do use for instance Flot, though, when needed.
  9. Client side •Jquery •Openlayers/leaflet •Blueprint css framework (or twitter bootstrap)

    We try to be light-weight on the client side. And we support IE7+ (and the rest, of course).
  10. Layered software structure • Core: splitting everything up • Lizard-ui:

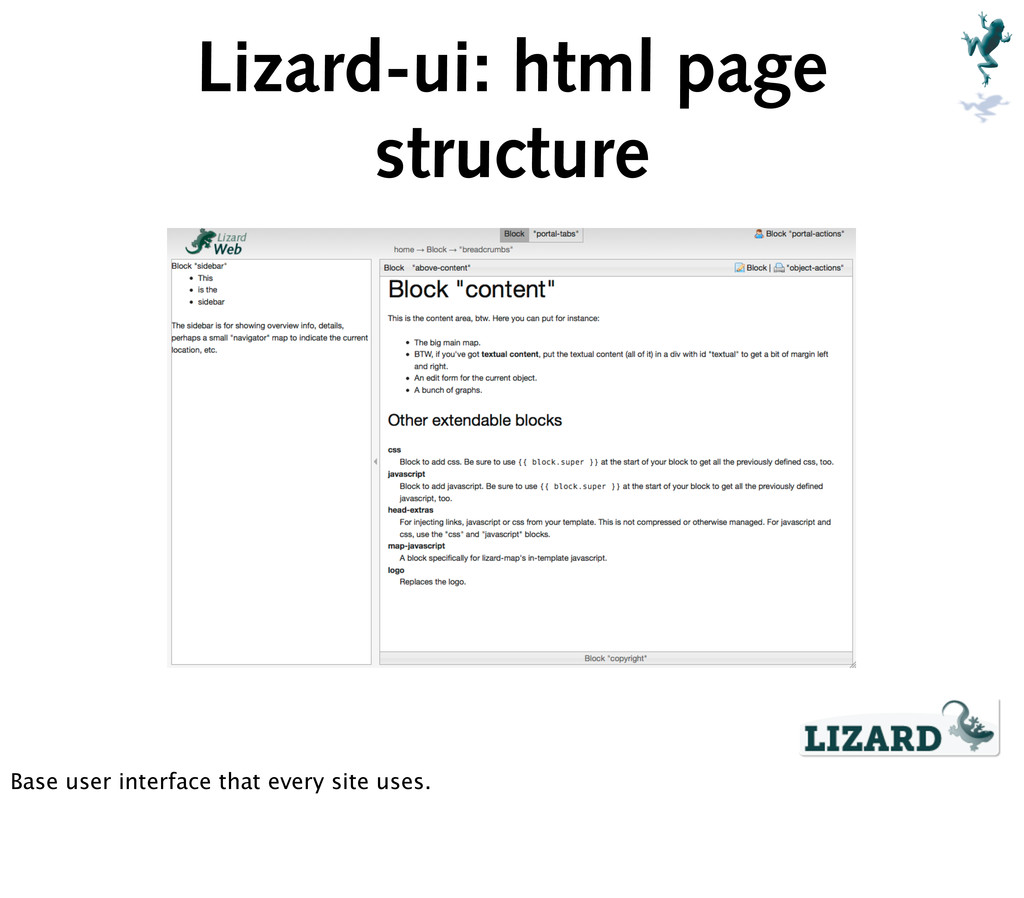
    html page structure • Lizard-map: maps + plugin mechanism • Lizard-xyz plugins: data sources Lizard’s biggest advantage: the pluggable core. Works like a charm (but it could use a tad more documentation and some cleanup).
  11. Lizard-map: map core • Workspace • Map visualisation • Basic

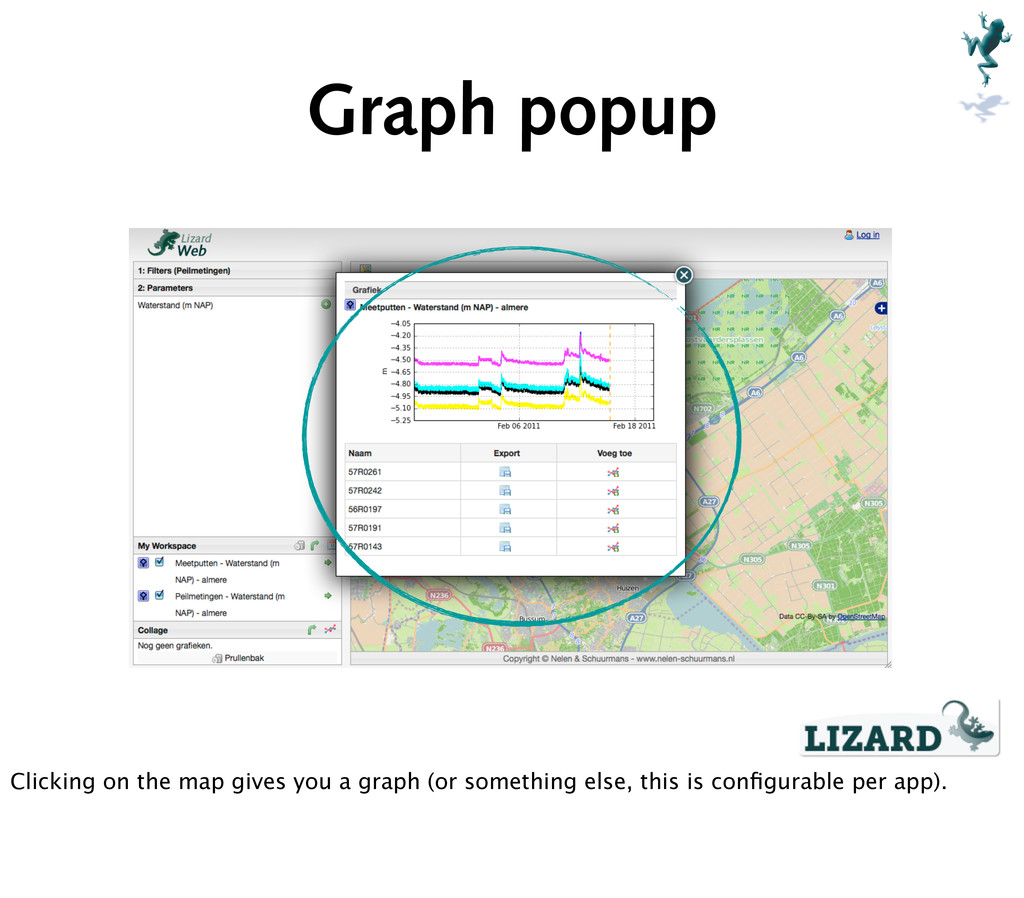
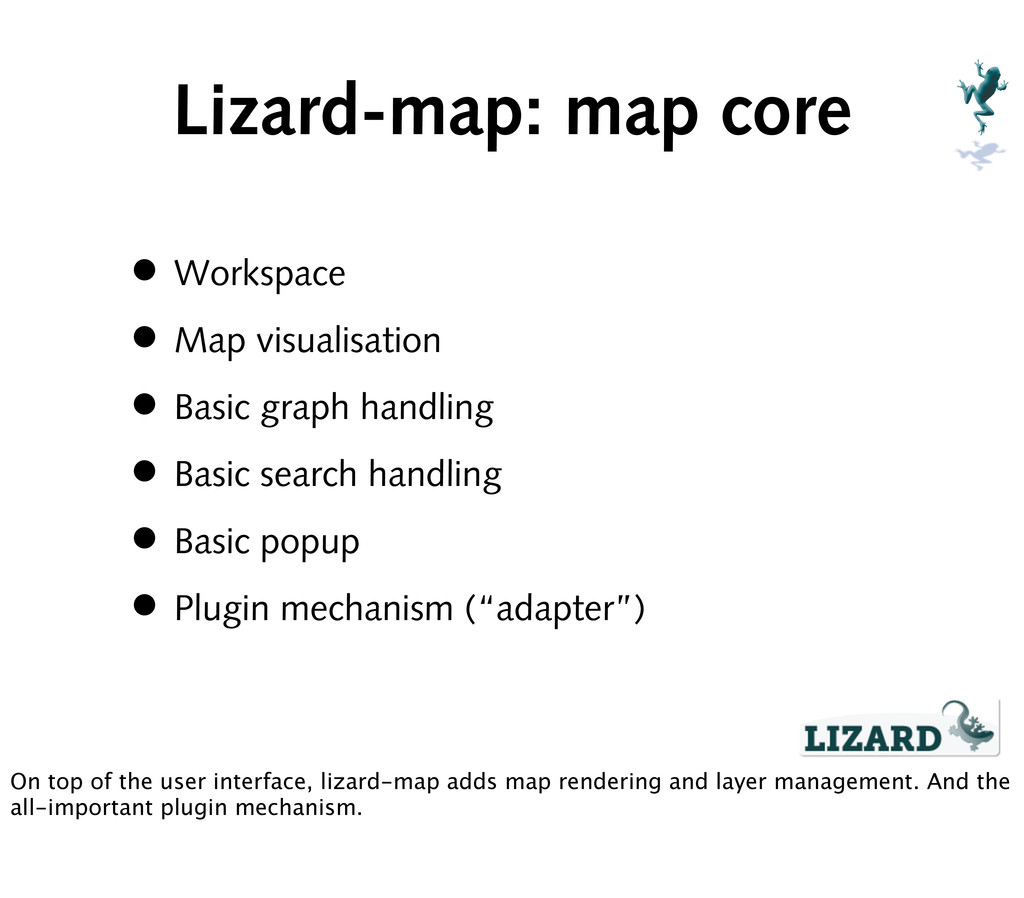
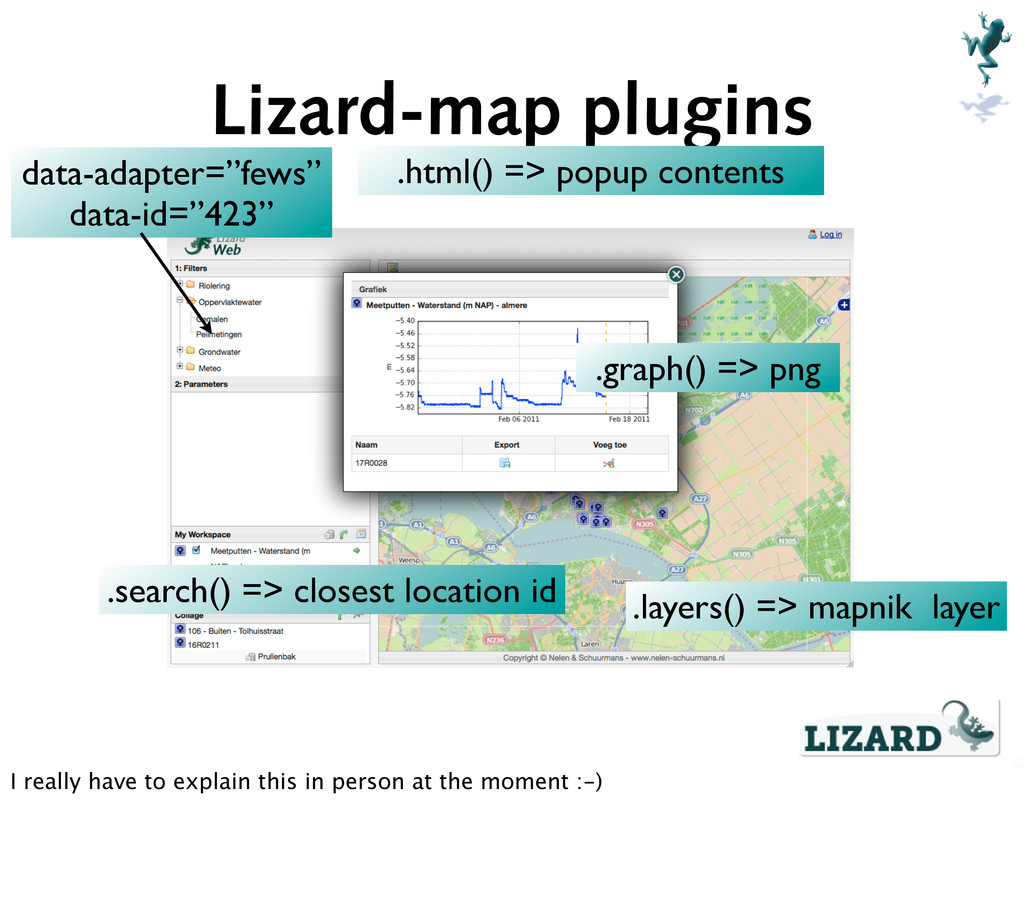
    graph handling • Basic search handling • Basic popup • Plugin mechanism (“adapter”) On top of the user interface, lizard-map adds map rendering and layer management. And the all-important plugin mechanism.
  12. Lizard-map plugins data-adapter=”fews” data-id=”423” .layers() => mapnik layer .search() =>

    closest location id .html() => popup contents .graph() => png I really have to explain this in person at the moment :-)
  13. Integration possibilities •WMS service •Map + legend •Easy, quick, out

    of the box •Existing plugin (shapefile, FEWS) •Your API + small custom plugin •Full custom Python/Django plugin If you want to use Lizard or want to integrate with it, the base option is to use WMS. Works like a charm and it is easy to integrate. Option two is to use one of the existing plugins. Option three is an API and a small custom plugin. Option four is to make a custom plugin; this gives the most power, but you need to be fluent with Python/Django (or you need someone who is).
  14. Pointers •Lizard.org (and in Dutch: lizard.net) •github.com/lizardsystem •doc.lizardsystem.nl Basically, just

    visit http://lizard.org/ for pointers to github, videos and documentation!