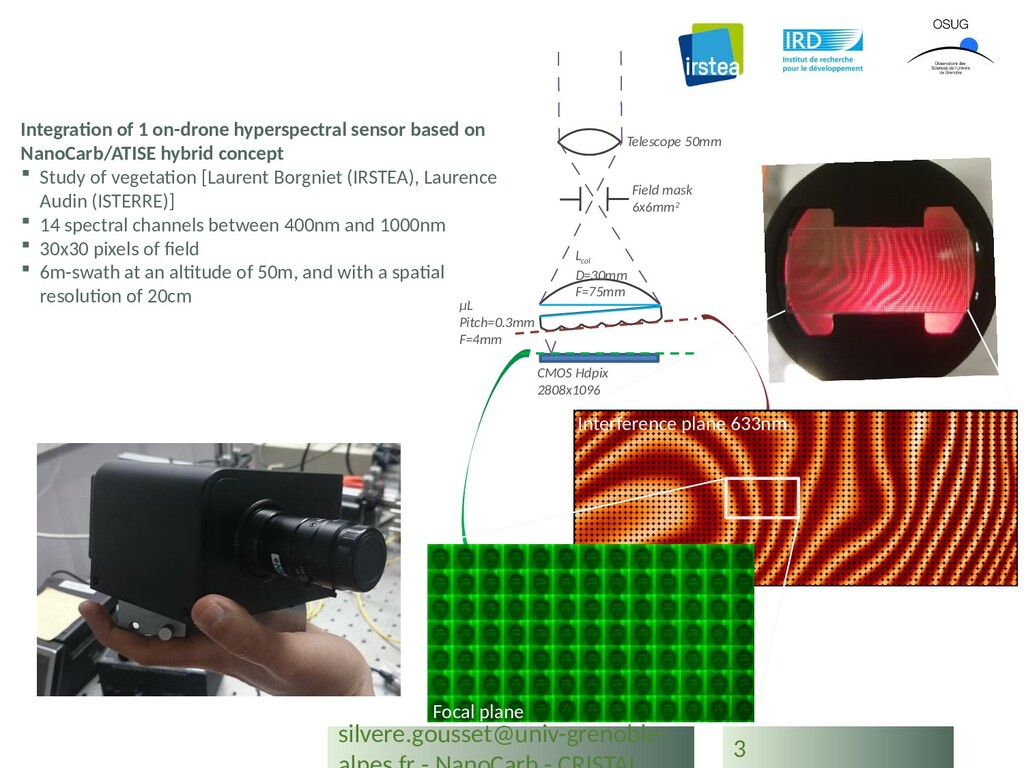
6x6mm2 L col D=30mm F=75mm µL Pitch=0.3mm F=4mm CMOS Hdpix 2808x1096 Integration of 1 on-drone hyperspectral sensor based on NanoCarb/ATISE hybrid concept Study of vegetation [Laurent Borgniet (IRSTEA), Laurence Audin (ISTERRE)] 14 spectral channels between 400nm and 1000nm 30x30 pixels of field 6m-swath at an altitude of 50m, and with a spatial resolution of 20cm Focal plane
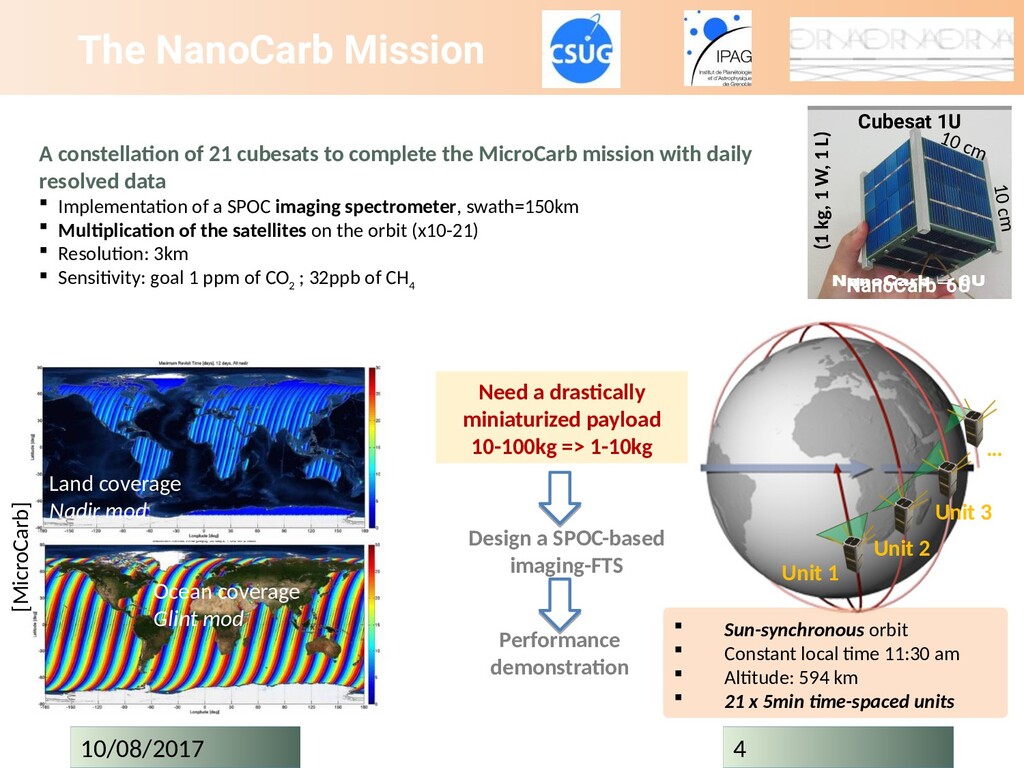
10 cm NanoCarb 6U The NanoCarb Mission Unit 1 Unit 2 Unit 3 … Sun-synchronous orbit Constant local time 11:30 am Altitude: 594 km 21 x 5min time-spaced units A constellation of 21 cubesats to complete the MicroCarb mission with daily resolved data Implementation of a SPOC imaging spectrometer, swath=150km Multiplication of the satellites on the orbit (x10-21) Resolution: 3km Sensitivity: goal 1 ppm of CO 2 ; 32ppb of CH 4 Land coverage Nadir mod Ocean coverage Glint mod [MicroCarb] Need a drastically miniaturized payload 10-100kg => 1-10kg Design a SPOC-based imaging-FTS Performance demonstration 10/08/2017 4
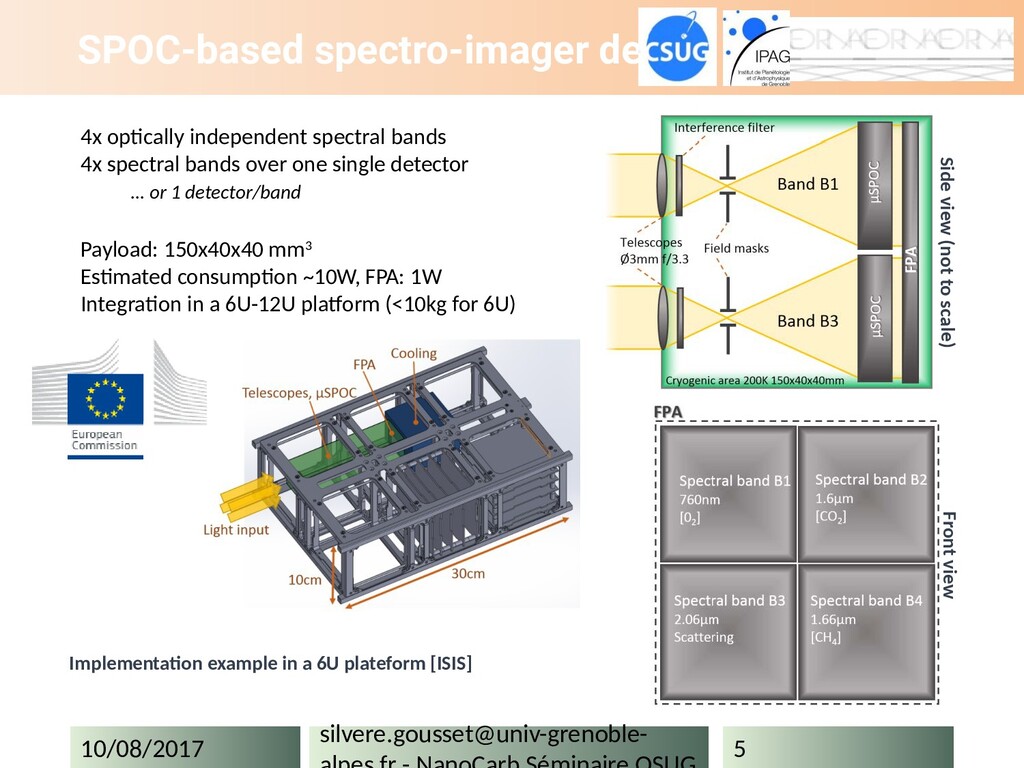
4x optically independent spectral bands 4x spectral bands over one single detector … or 1 detector/band Payload: 150x40x40 mm3 Estimated consumption ~10W, FPA: 1W Integration in a 6U-12U platform (<10kg for 6U) Implementation example in a 6U plateform [ISIS] 10/08/2017 silvere.gousset@univ-grenoble- 5
s e r S p e c t r u m A n a l y z e r W a v e l e n g t h M e t e r B r a g g I n t e r r o g a t o r R a m a n A n a l y z e r Laser characterization Process analytics Structure monitoring ProCellics™
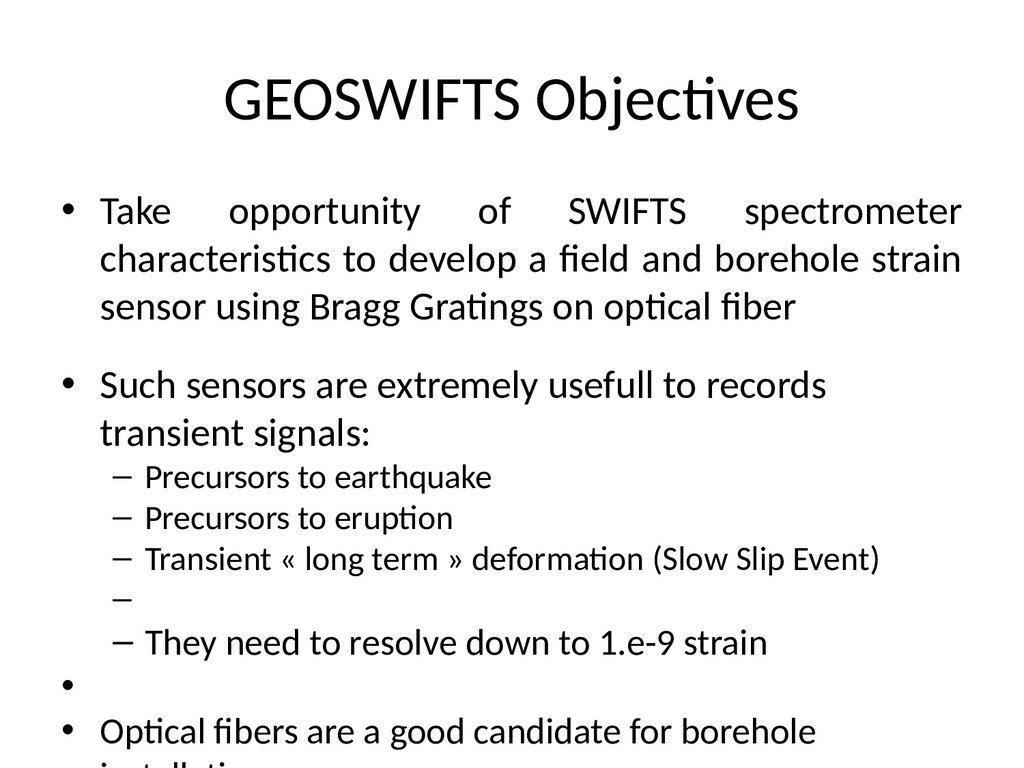
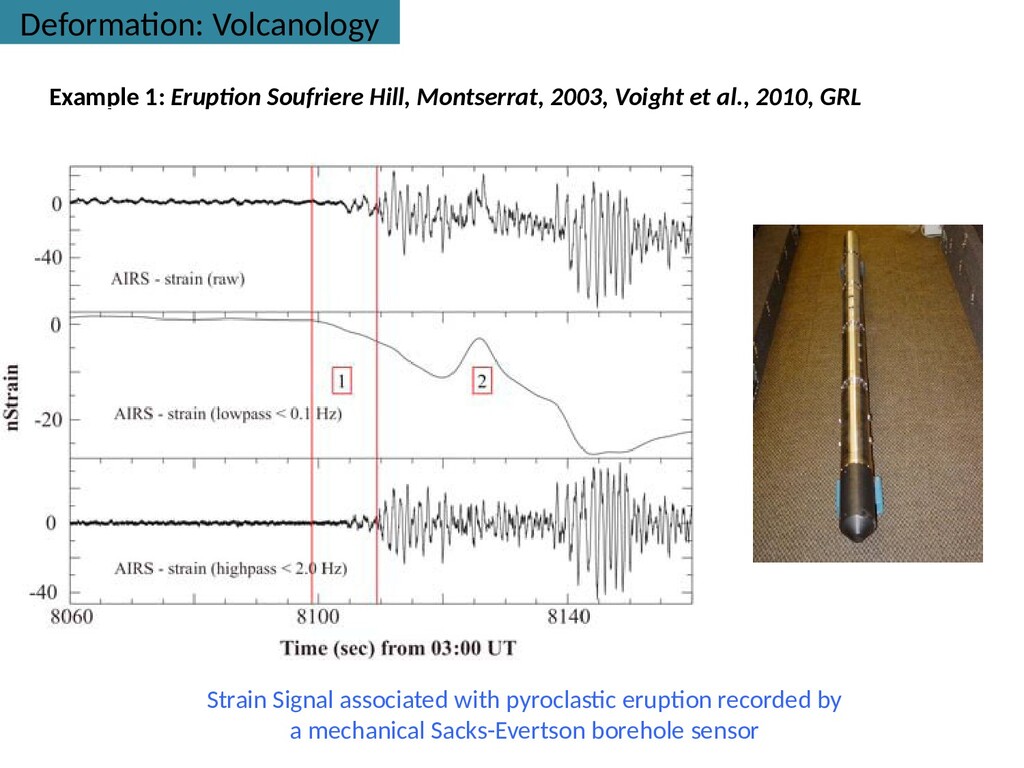
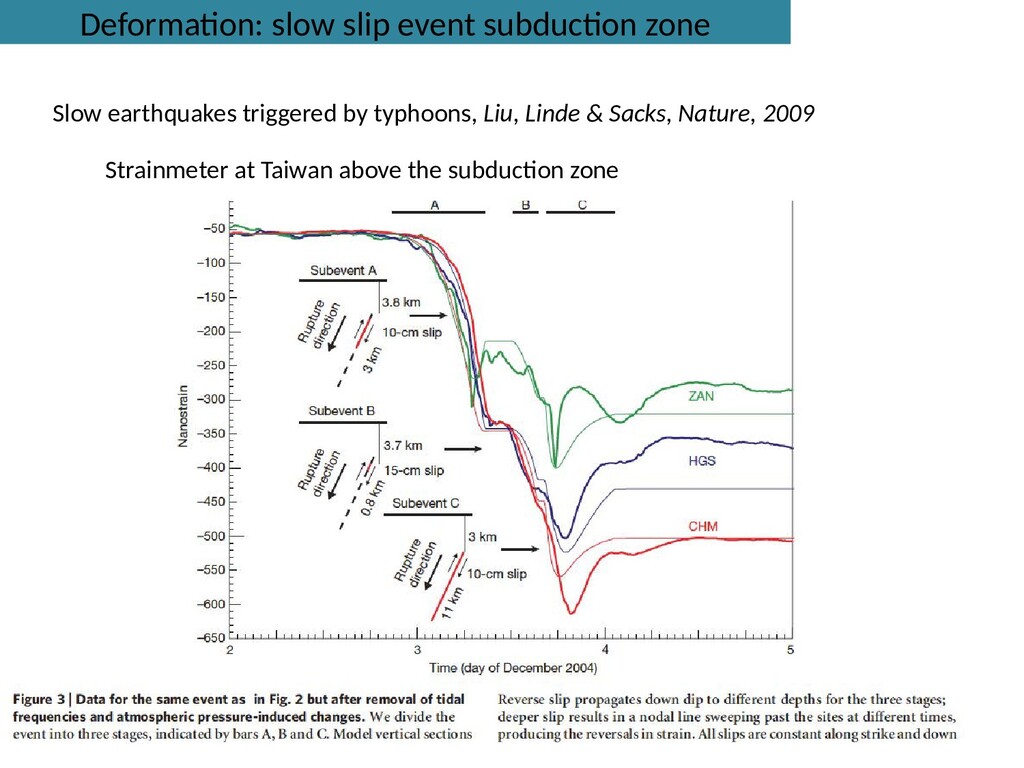
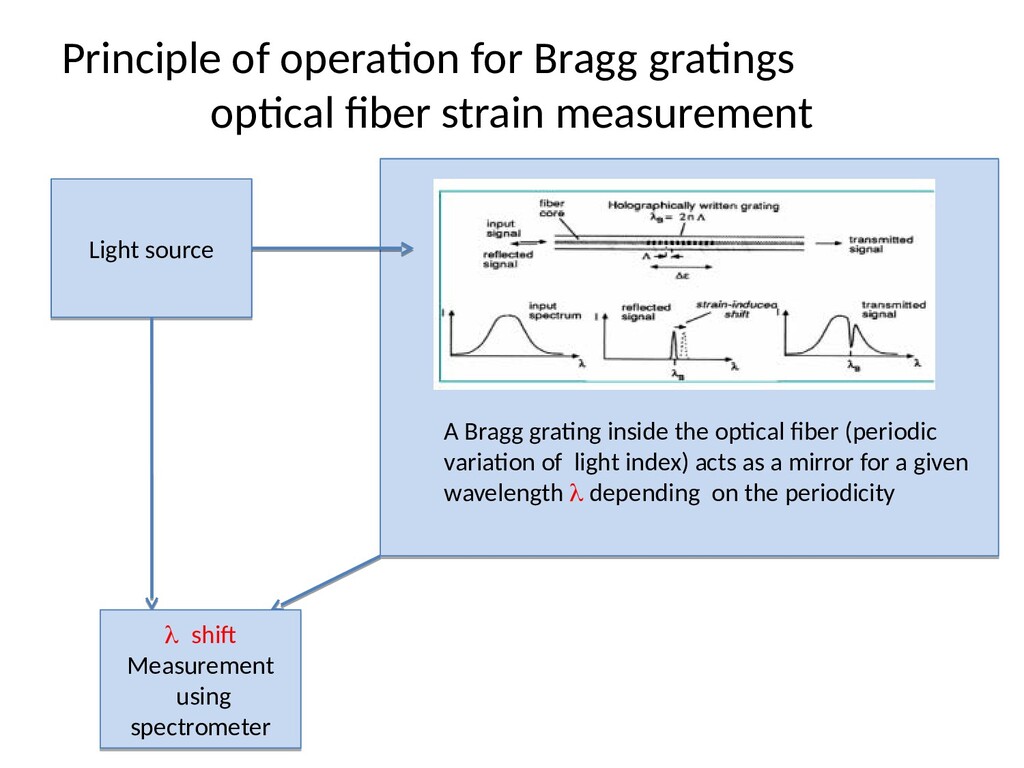
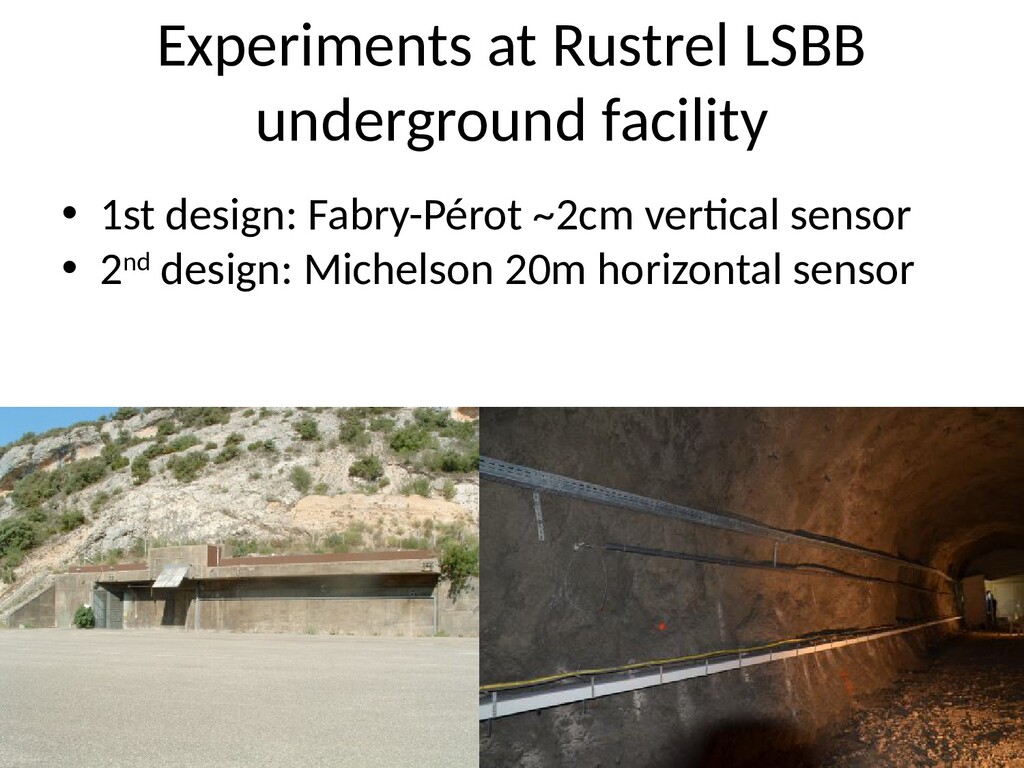
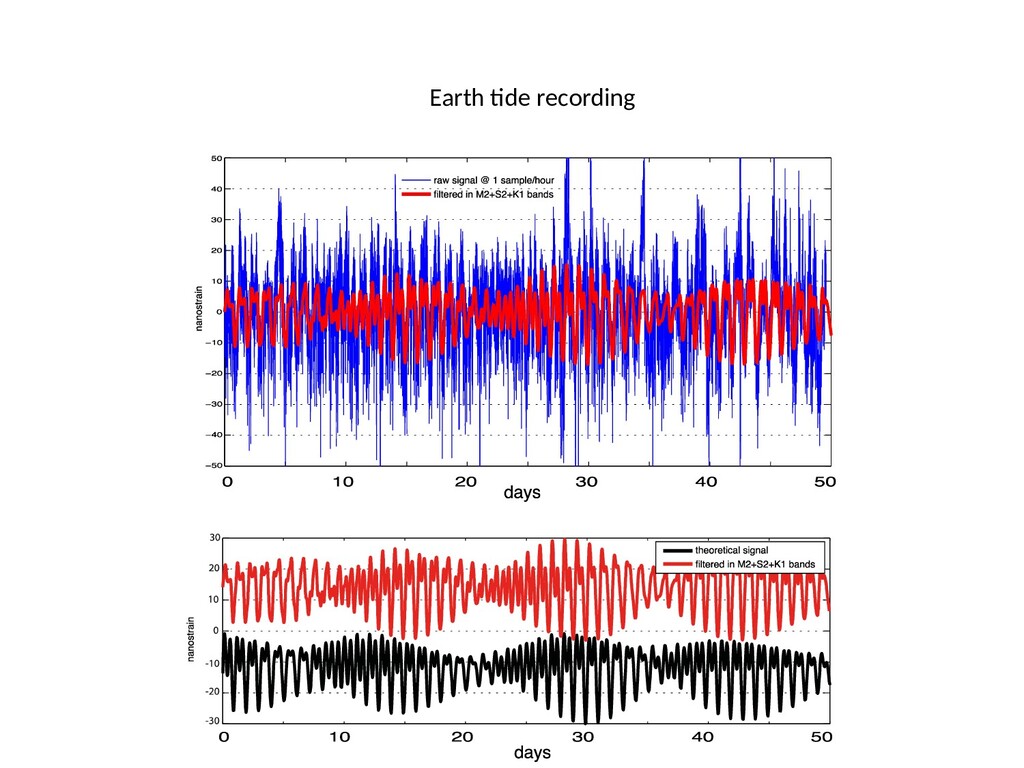
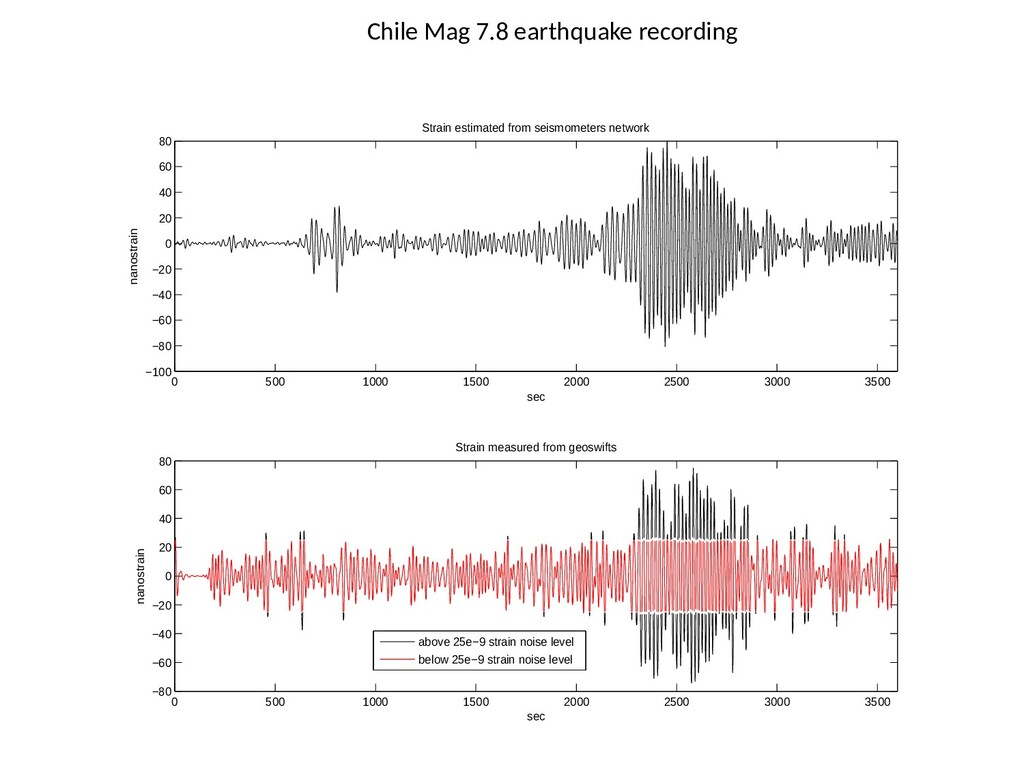
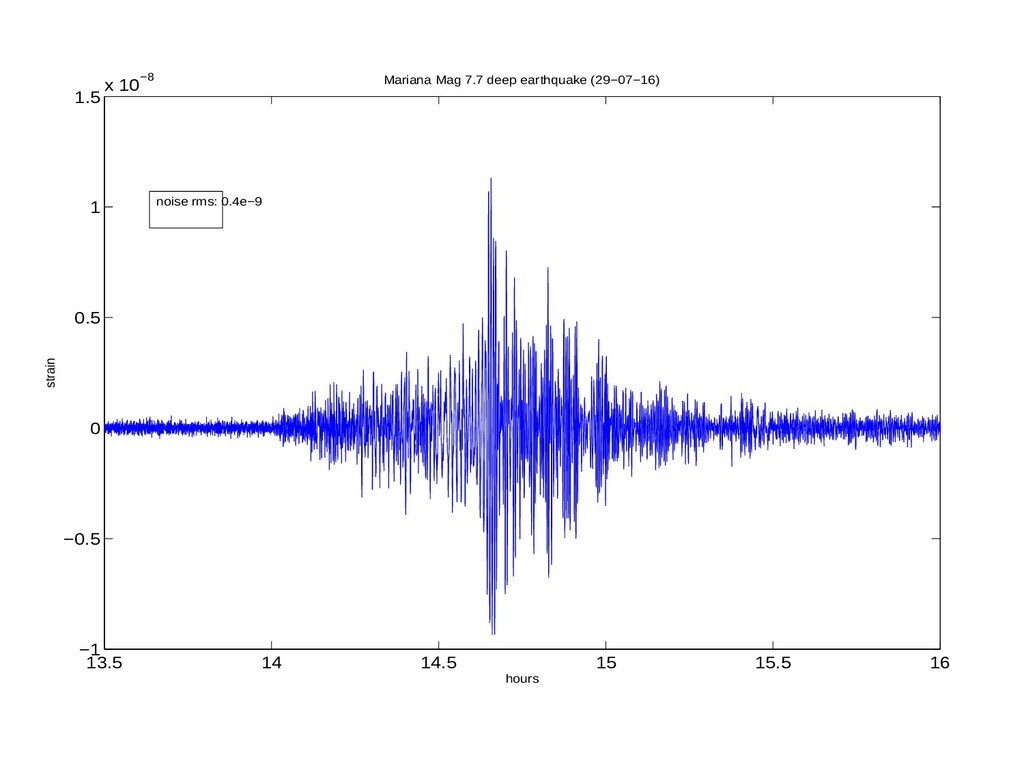
develop a field and borehole strain sensor using Bragg Gratings on optical fiber • Such sensors are extremely usefull to records transient signals: – Precursors to earthquake – Precursors to eruption – Transient « long term » deformation (Slow Slip Event) – – They need to resolve down to 1.e-9 strain • • Optical fibers are a good candidate for borehole
A Bragg grating inside the optical fiber (periodic variation of light index) acts as a mirror for a given wavelength l depending on the periodicity Light source Light source l shif Measurement using spectrometer l shif Measurement using spectrometer
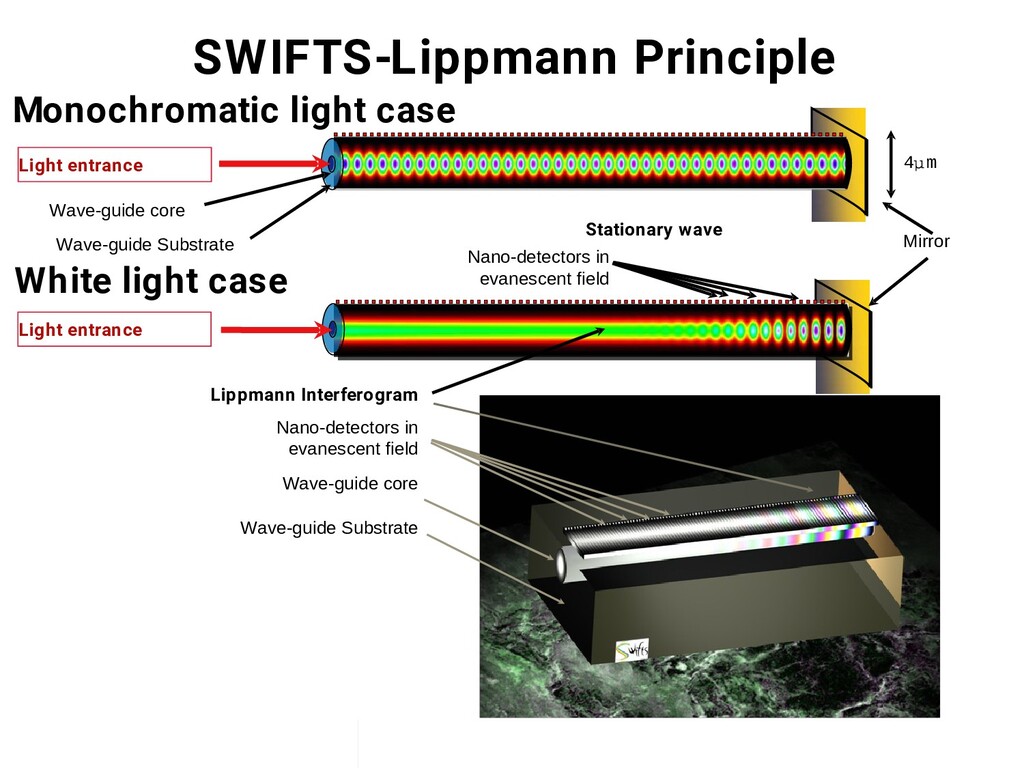
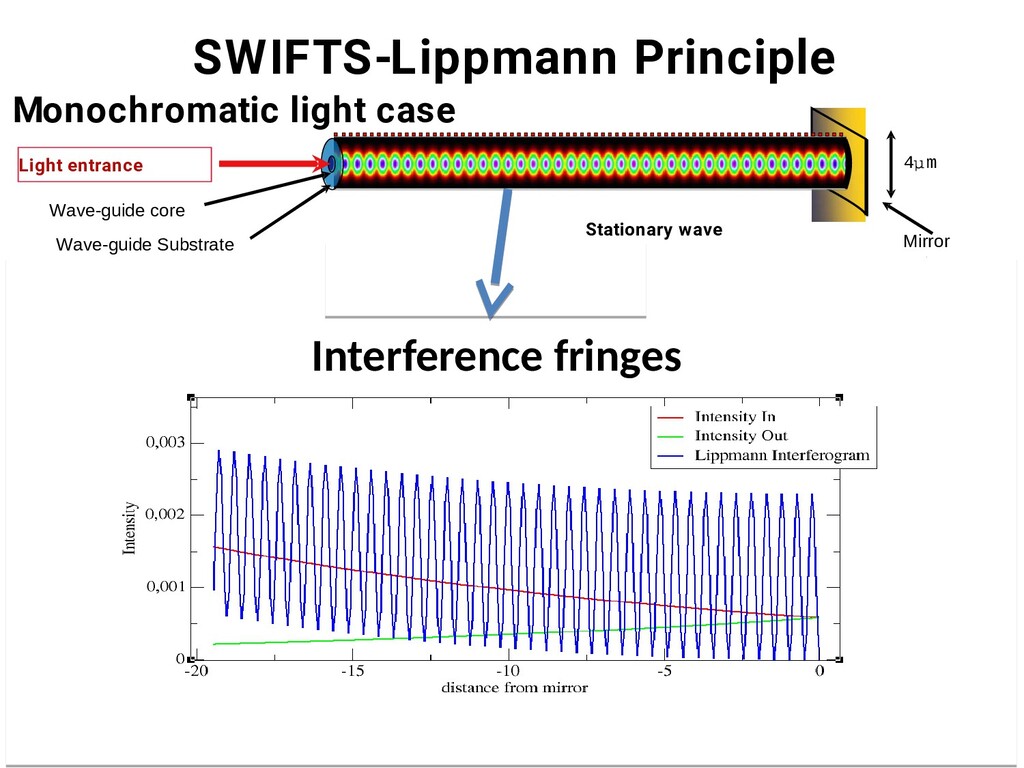
core Wave-guide Substrate Nano-detectors in evanescent field Stationary wave Lippmann Interferogram Monochromatic light case White light case Wave-guide core Wave-guide Substrate Nano-detectors in evanescent field Light entrance Mirror 4 m Light entrance
core Wave-guide Substrate Nano-detectors in evanescent field Stationary wave Lippmann Interferogram Monochromatic light case White light case Wave-guide core Wave-guide Substrate Nano-detectors in evanescent field Light entrance Mirror 4 m Light entrance Interference fringes
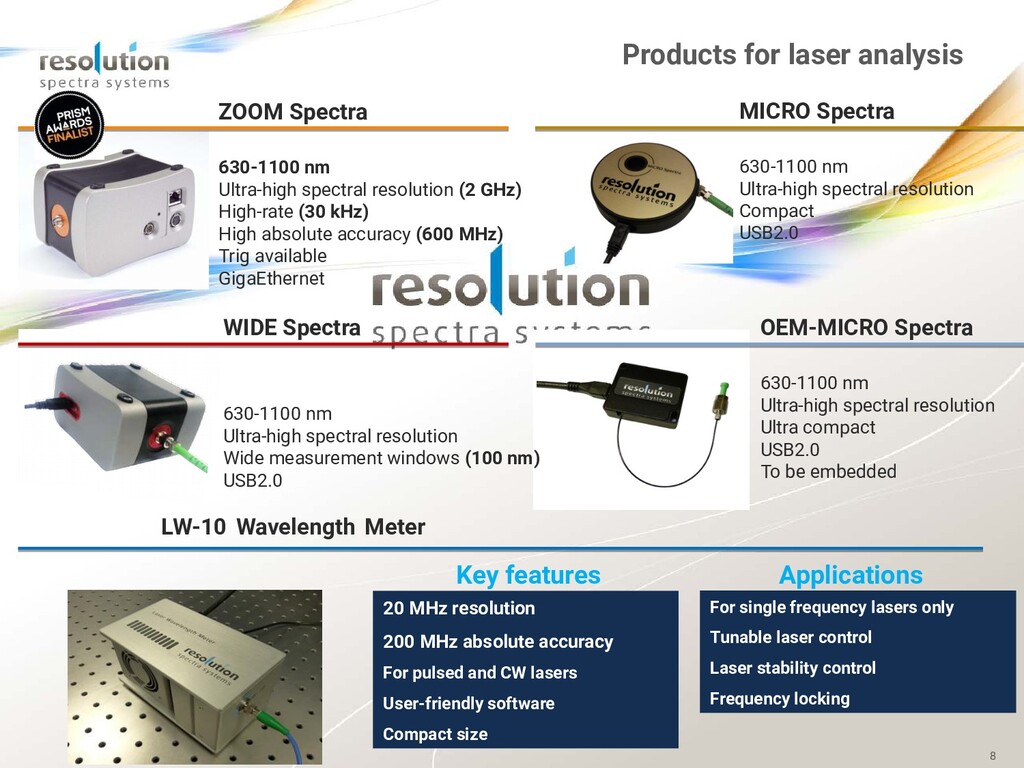
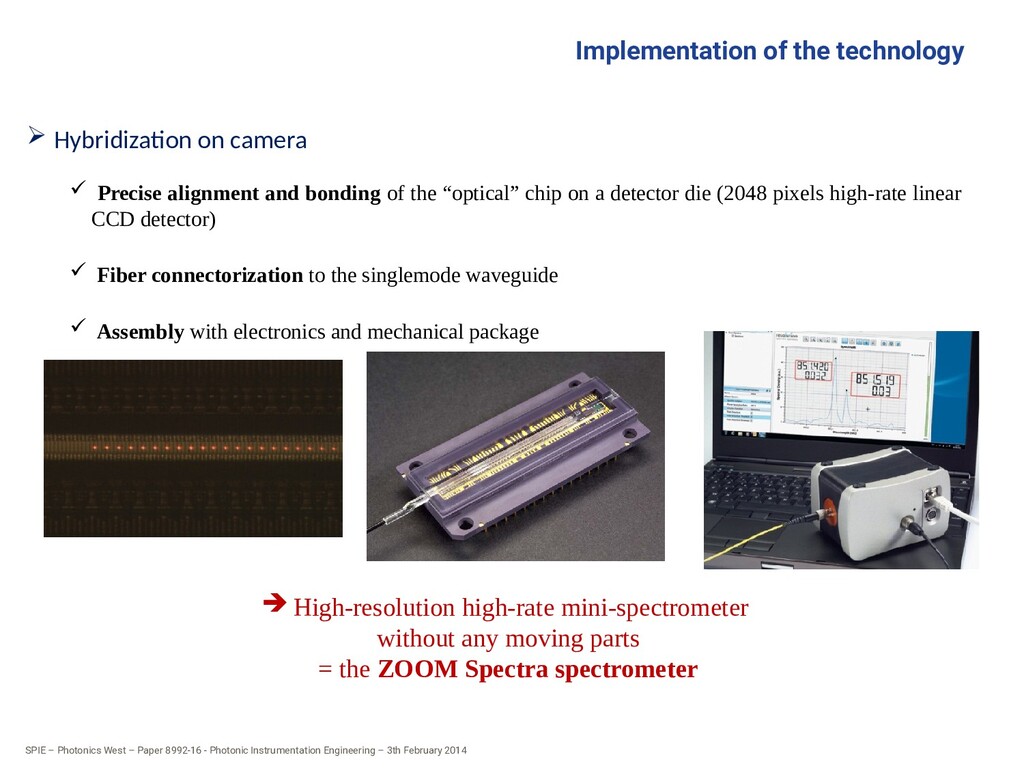
Engineering – 3th February 2014 Implementation of the technology Hybridization on camera Precise alignment and bonding of the “optical” chip on a detector die (2048 pixels high-rate linear CCD detector) Fiber connectorization to the singlemode waveguide Assembly with electronics and mechanical package High-resolution high-rate mini-spectrometer without any moving parts = the ZOOM Spectra spectrometer
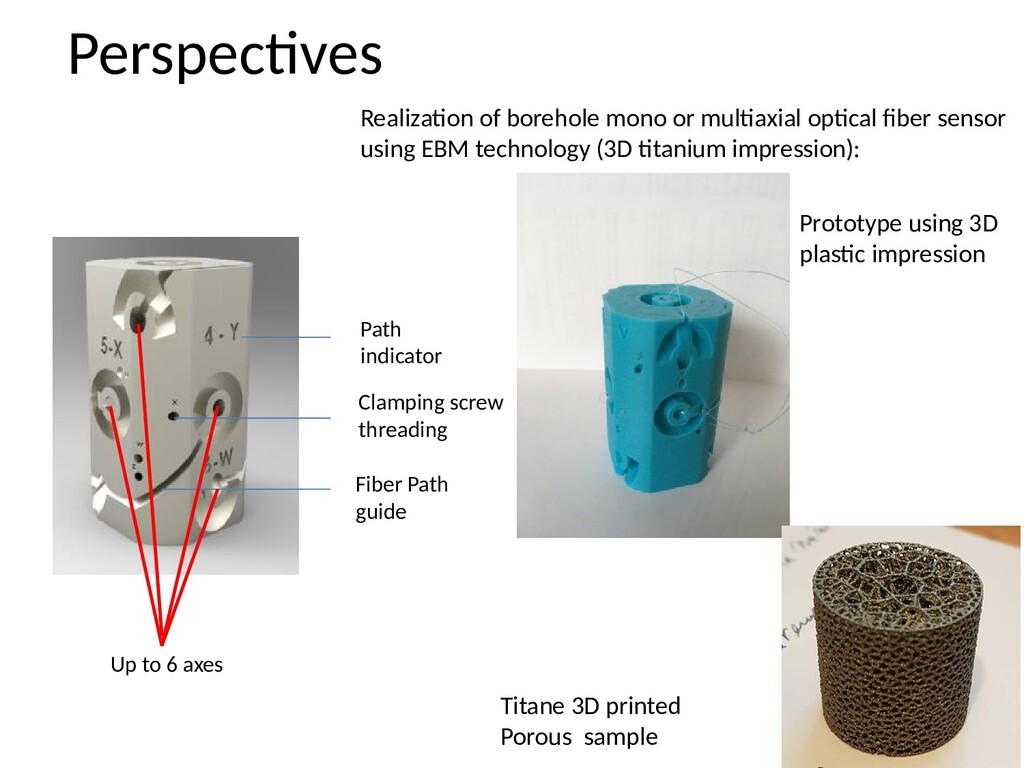
using EBM technology (3D titanium impression): Path indicator Fiber Path guide Up to 6 axes Clamping screw threading Prototype using 3D plastic impression Titane 3D printed Porous sample
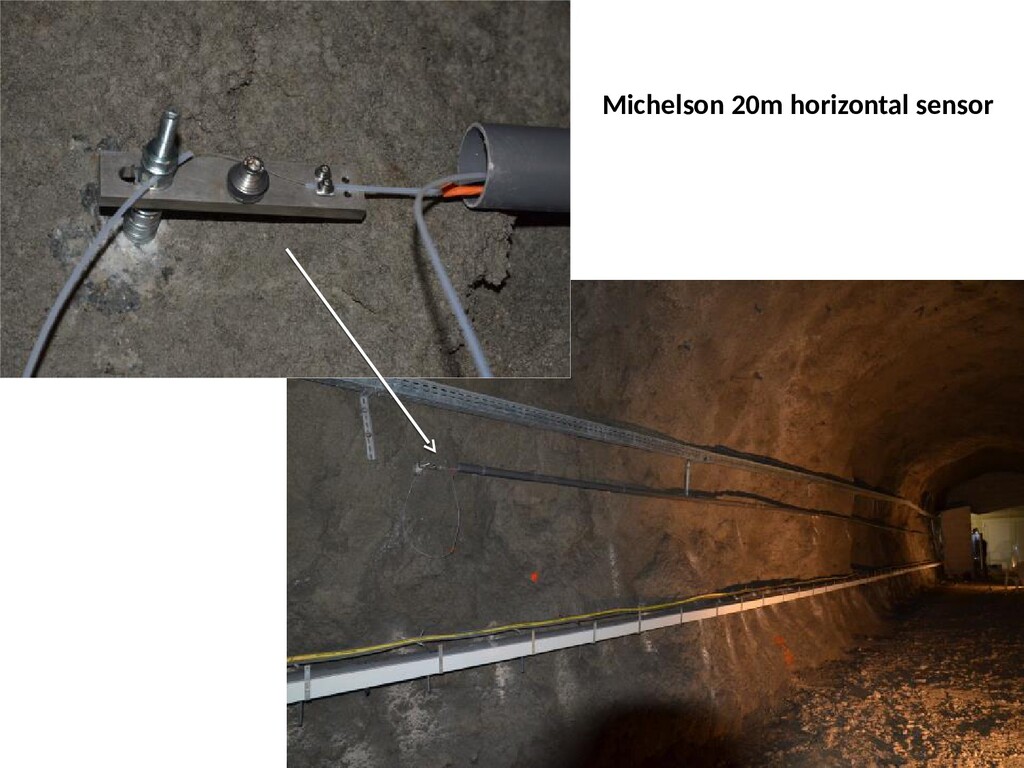
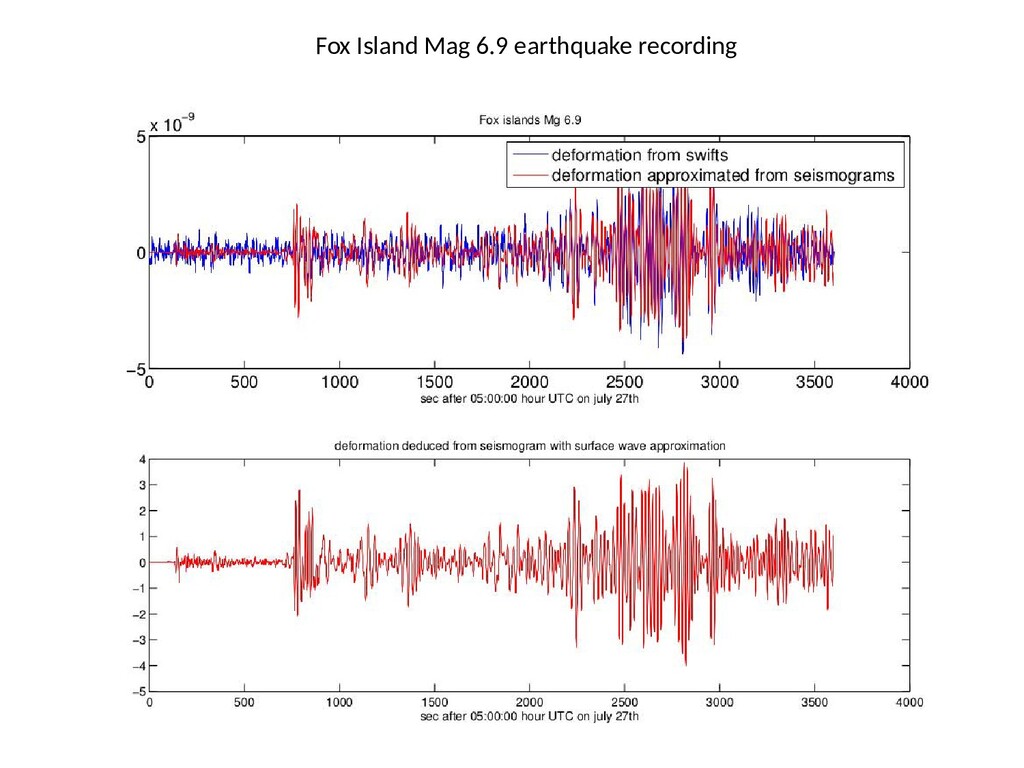
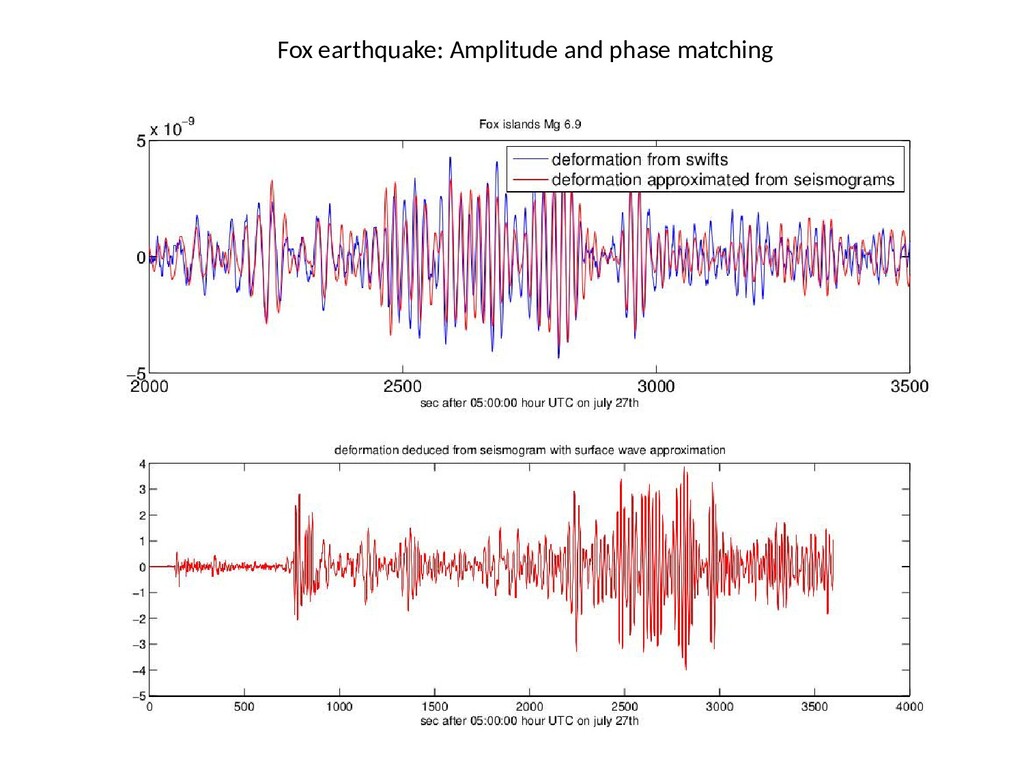
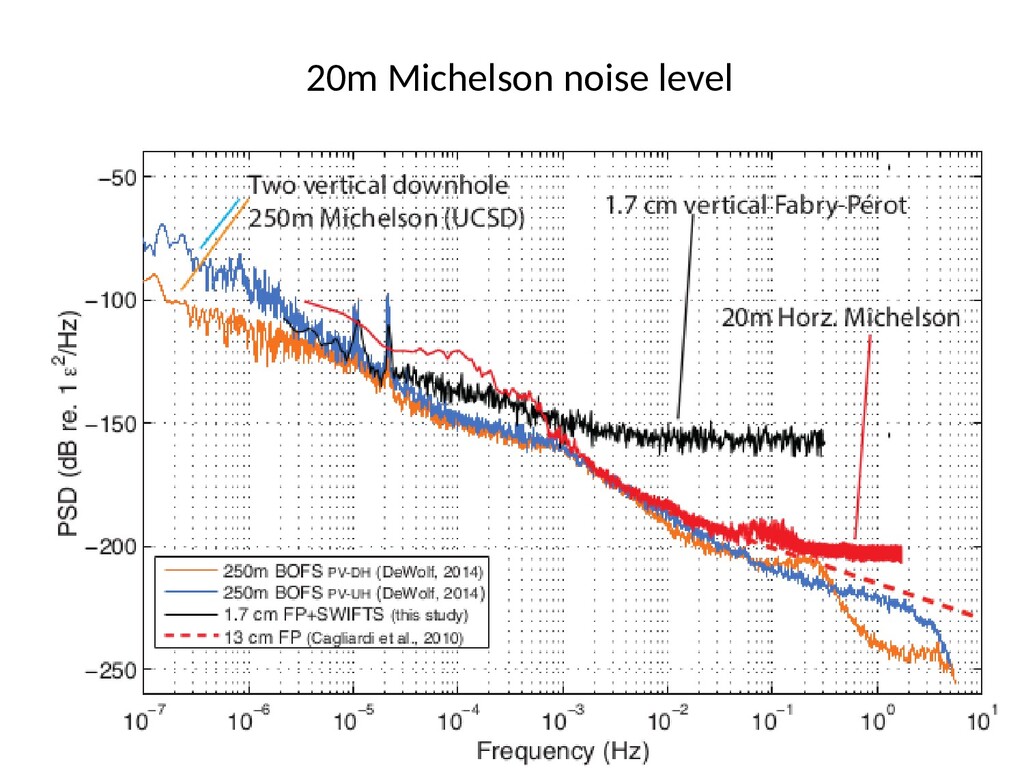
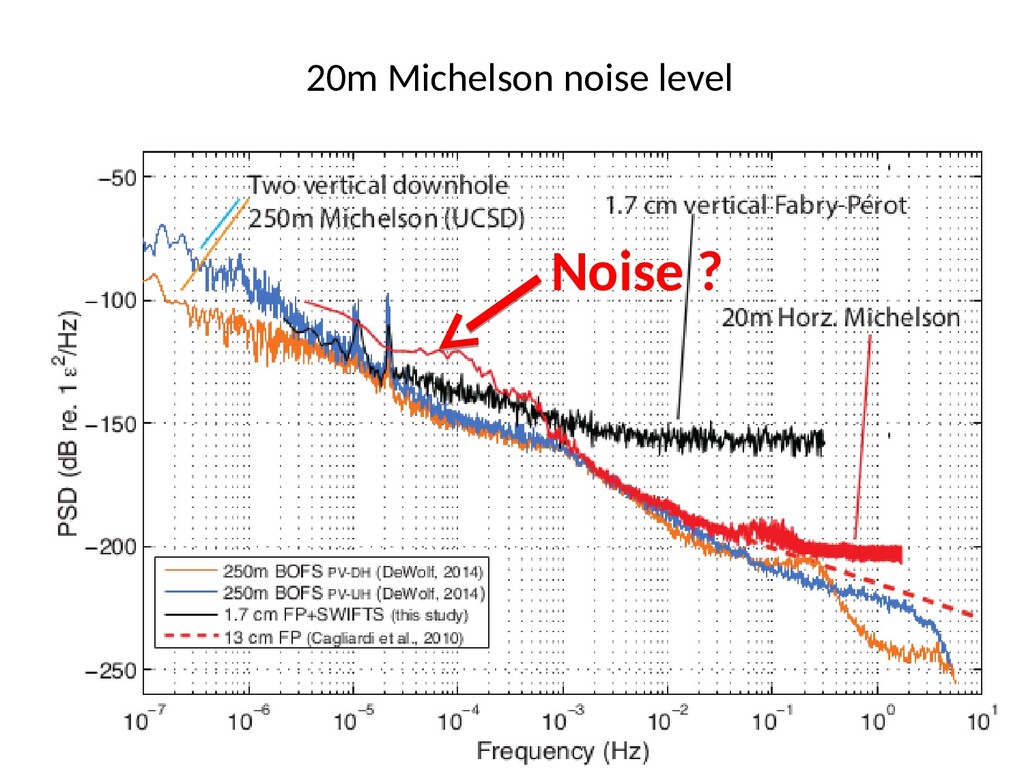
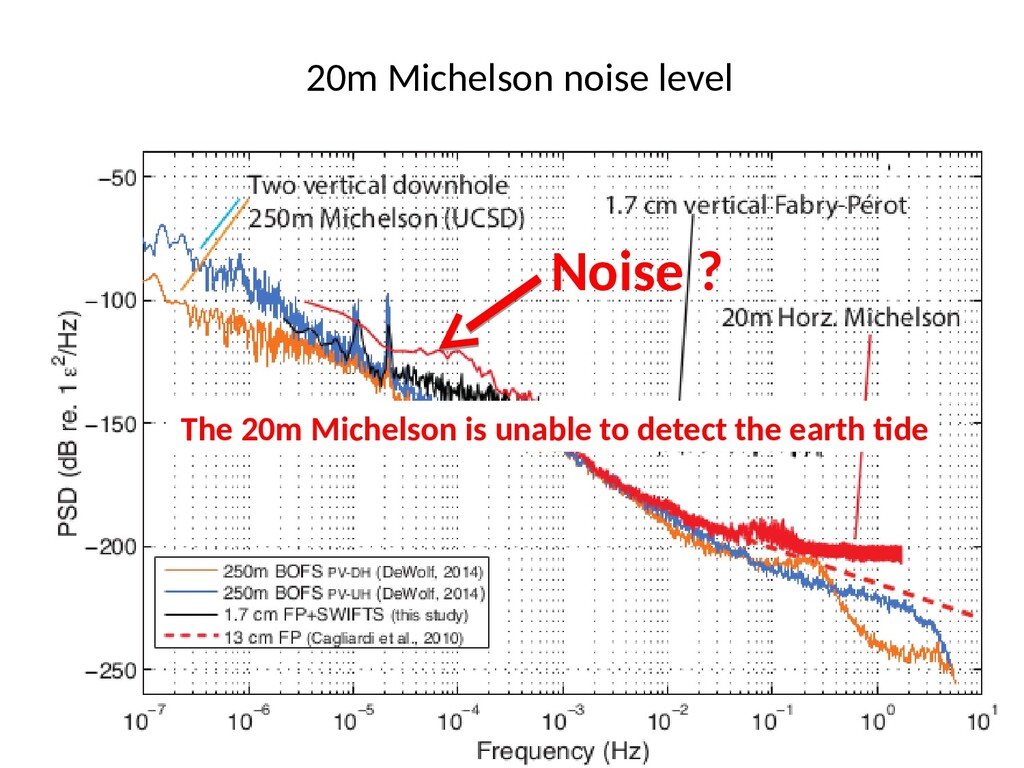
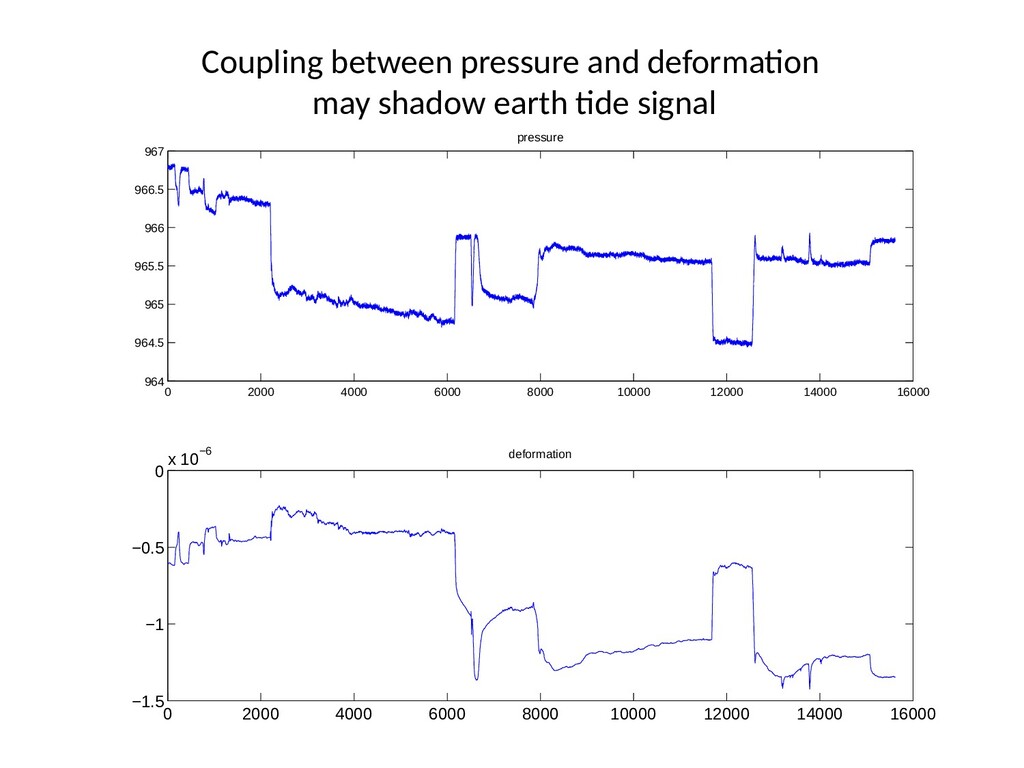
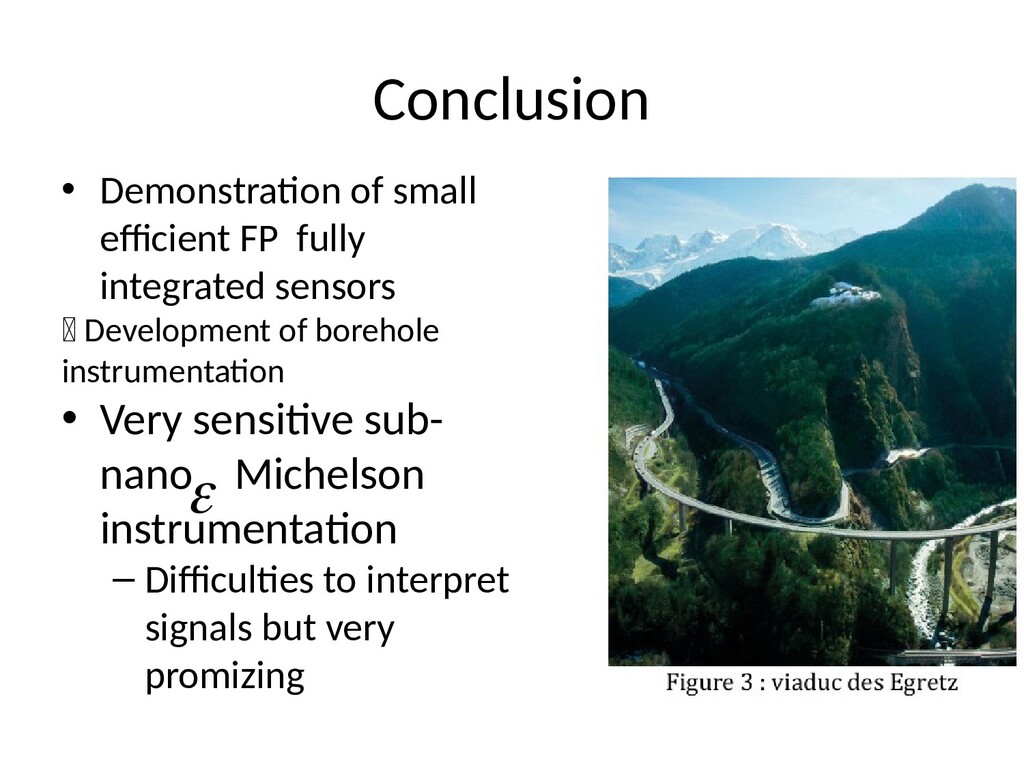
Development of borehole instrumentation • Very sensitive sub- nano Michelson instrumentation – Difficulties to interpret signals but very promizing e