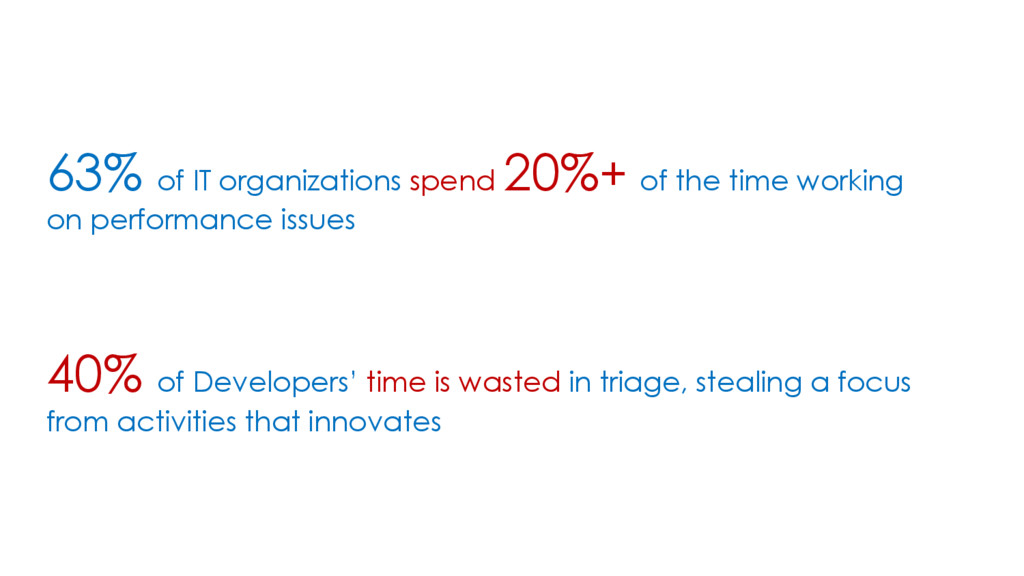
of the time working on performance issues Inability to Innovate 40% of Developers’ time is wasted in triage, stealing a focus from activities that innovates
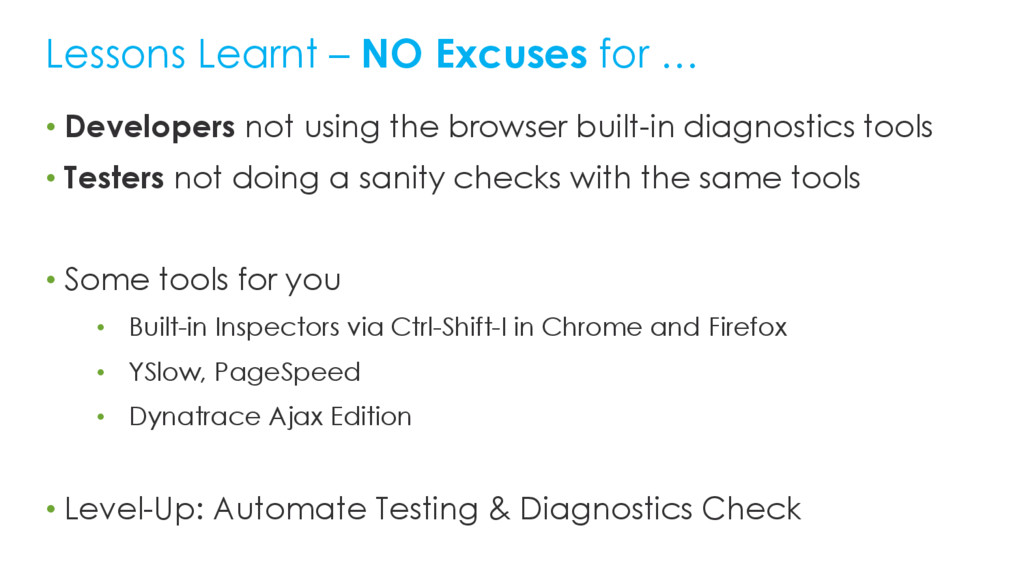
Testers not doing a sanity checks with the same tools • Some tools for you • Built-in Inspectors via Ctrl-Shift-I in Chrome and Firefox • YSlow, PageSpeed • Dynatrace Ajax Edition • Level-Up: Automate Testing & Diagnostics Check Lessons Learnt – NO Excuses for …
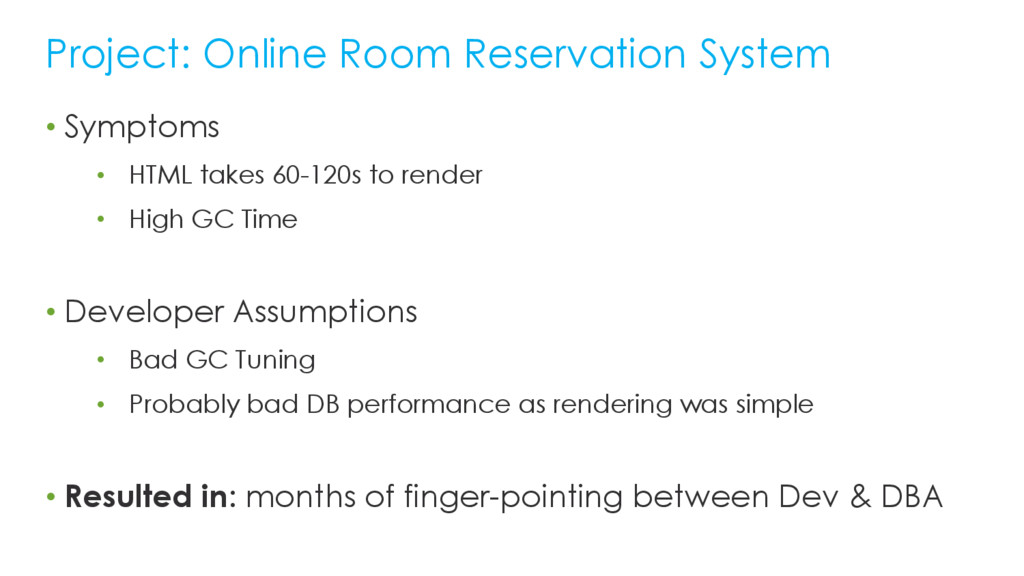
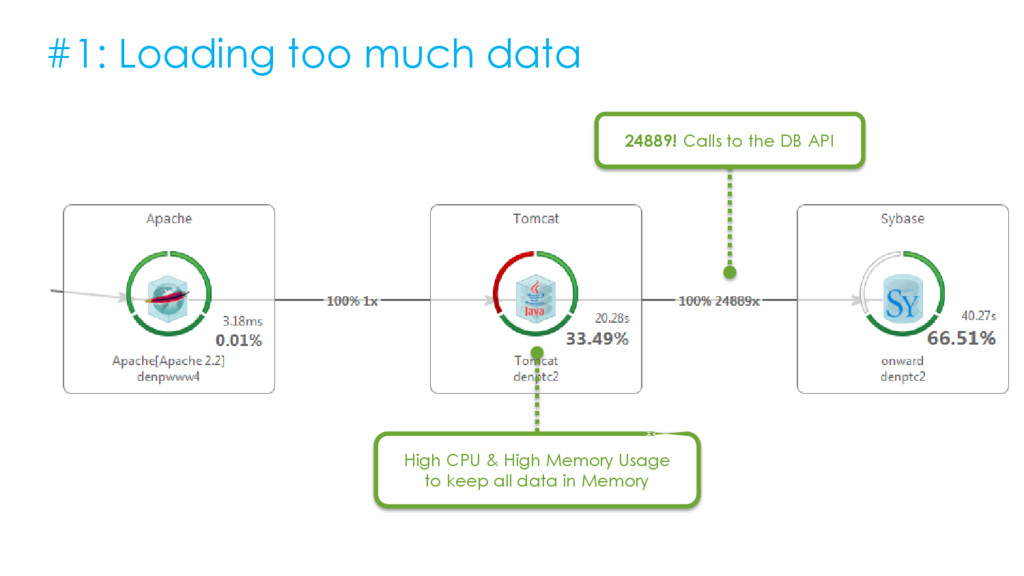
GC Time • Developer Assumptions • Bad GC Tuning • Probably bad DB performance as rendering was simple • Resulted in: months of finger-pointing between Dev & DBA Project: Online Room Reservation System
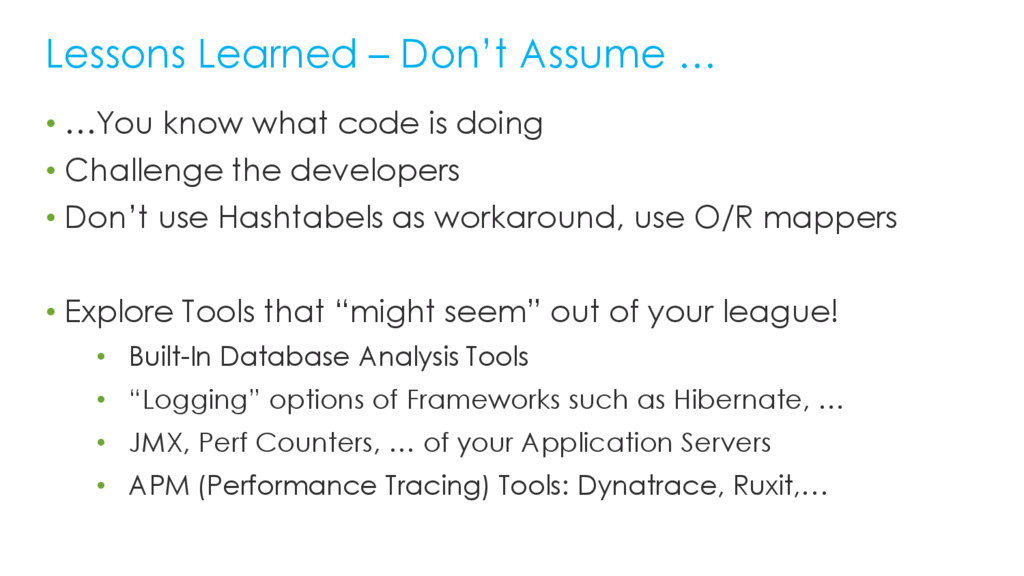
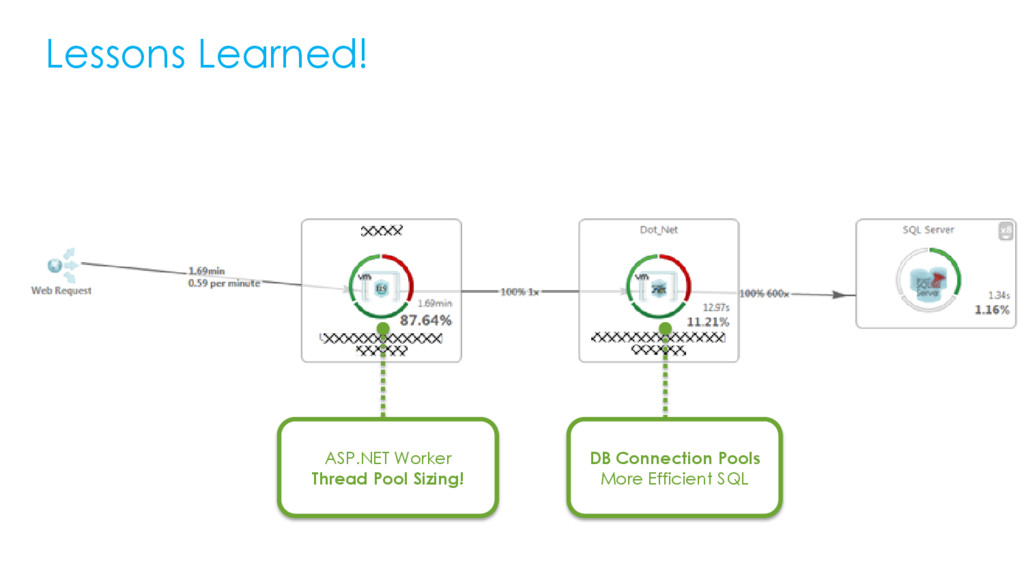
developers • Don’t use Hashtabels as workaround, use O/R mappers • Explore Tools that “might seem” out of your league! • Built-In Database Analysis Tools • “Logging” options of Frameworks such as Hibernate, … • JMX, Perf Counters, … of your Application Servers • APM (Performance Tracing) Tools: Dynatrace, Ruxit,… Lessons Learned – Don’t Assume …
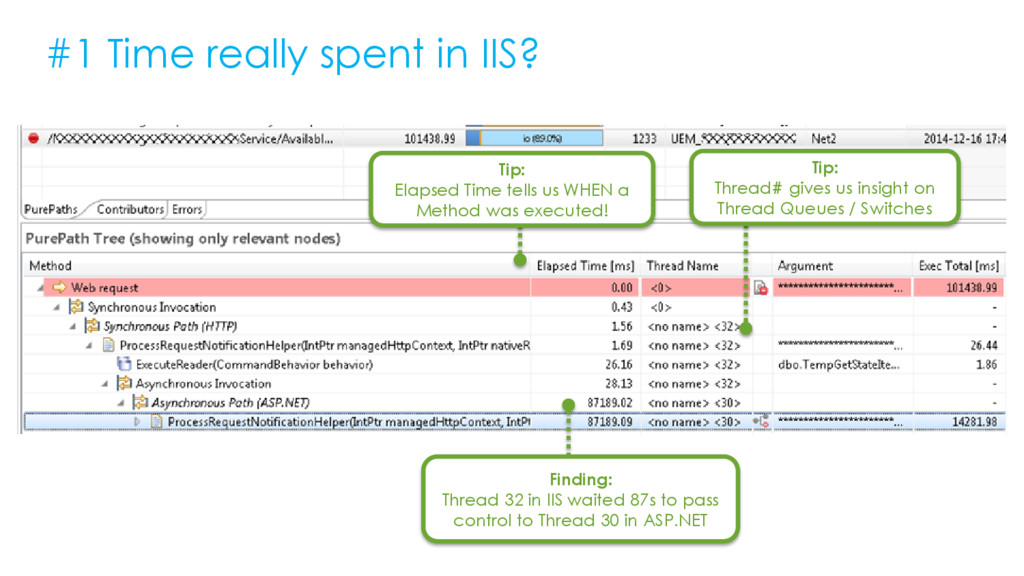
us WHEN a Method was executed! Tip: Thread# gives us insight on Thread Queues / Switches Finding: Thread 32 in IIS waited 87s to pass control to Thread 30 in ASP.NET
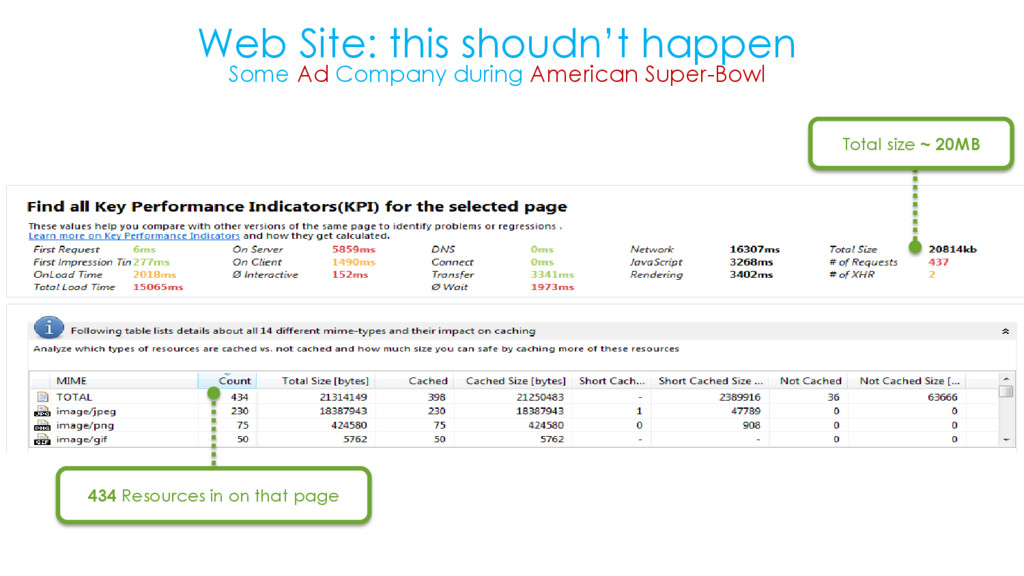
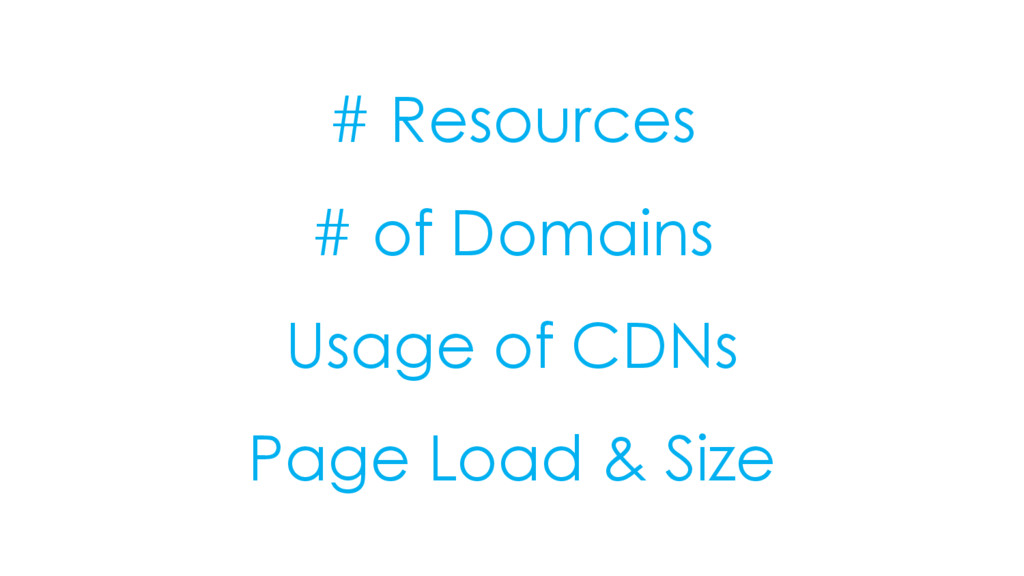
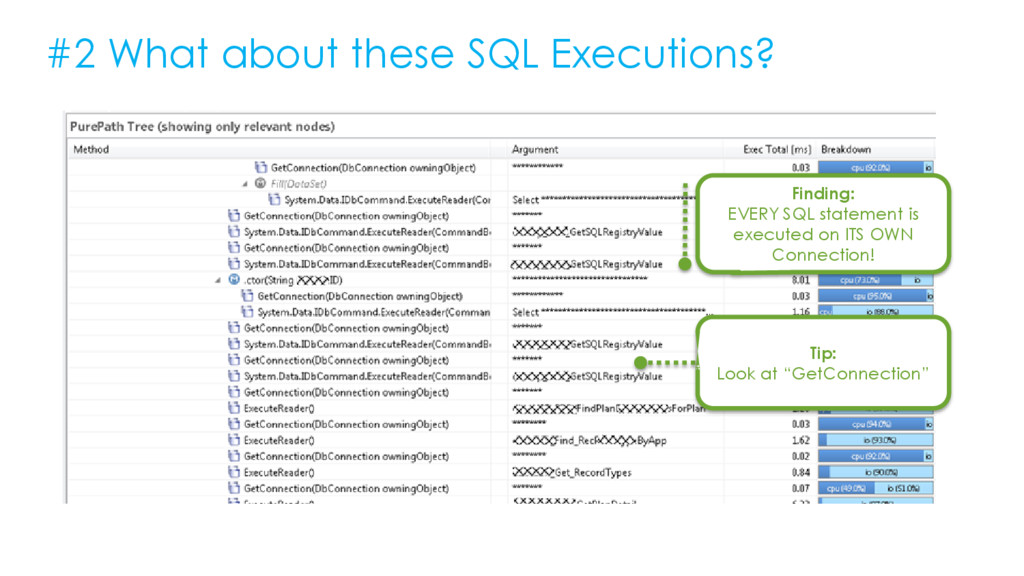
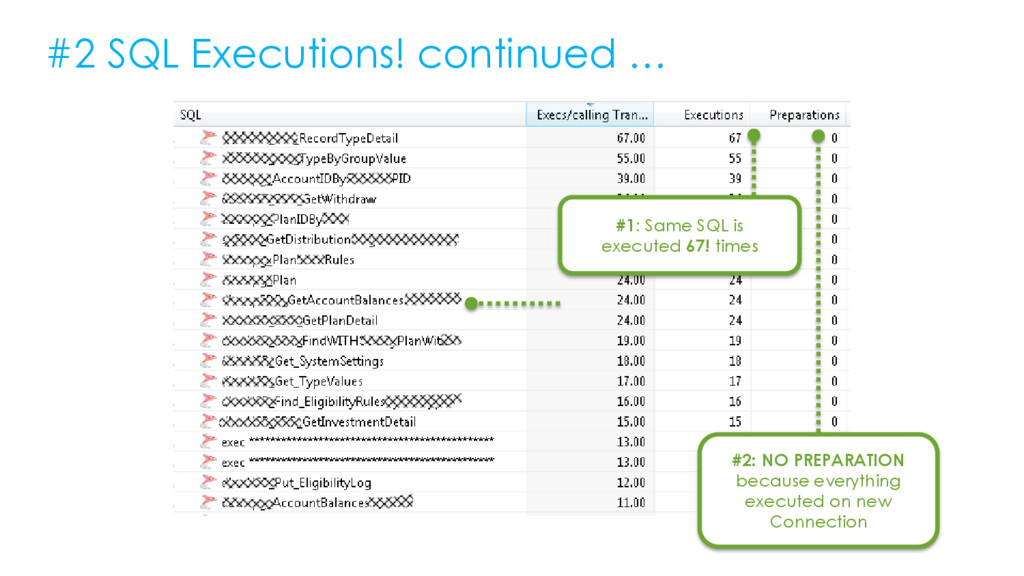
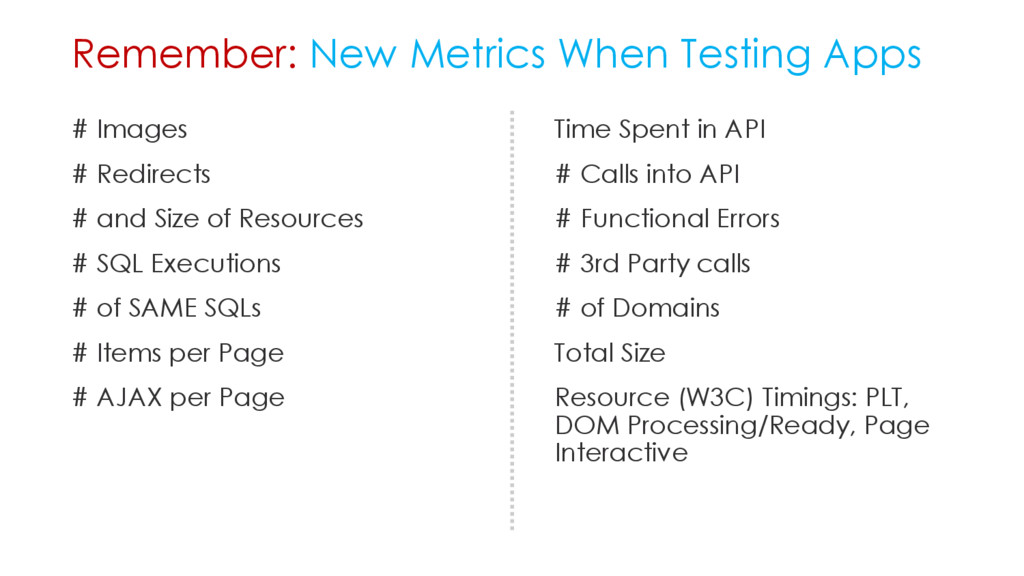
SQL Executions # of SAME SQLs # Items per Page # AJAX per Page Remember: New Metrics When Testing Apps Time Spent in API # Calls into API # Functional Errors # 3rd Party calls # of Domains Total Size Resource (W3C) Timings: PLT, DOM Processing/Ready, Page Interactive
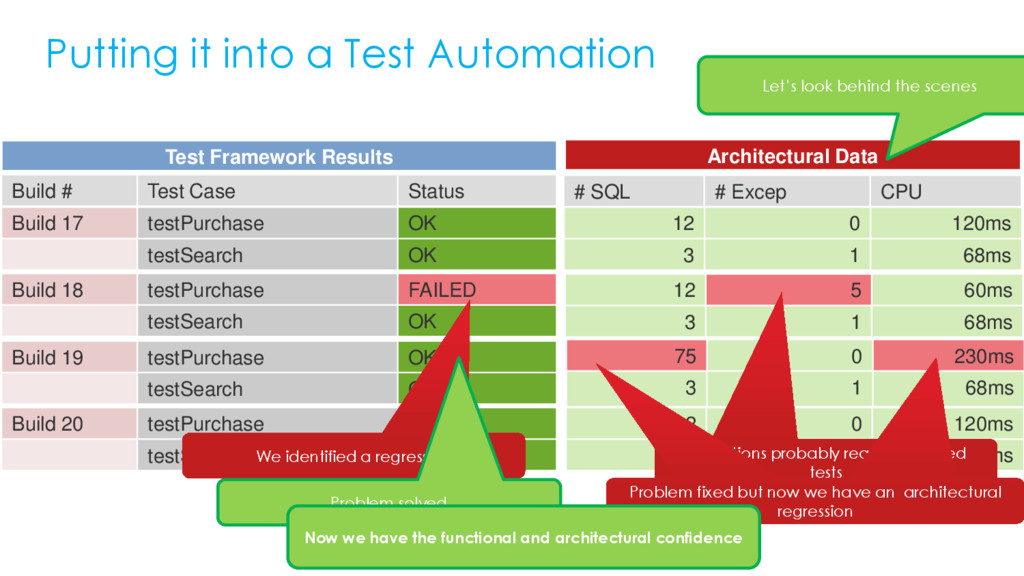
1 68ms Build 20 testPurchase OK testSearch OK Build 17 testPurchase OK testSearch OK Build 18 testPurchase FAILED testSearch OK Build 19 testPurchase OK testSearch OK Build # Test Case Status # SQL # Excep CPU 12 0 120ms 3 1 68ms 12 5 60ms 3 1 68ms 75 0 230ms 3 1 68ms Test Framework Results Architectural Data We identified a regression Problem solved Exceptions probably reason for failed tests Problem fixed but now we have an architectural regression Problem fixed but now we have an architectural regression Now we have the functional and architectural confidence Let’s look behind the scenes
![Avoiding software fails Few metrics to improve application reliability [email protected]](https://files.speakerdeck.com/presentations/7026057f09f946f0871199f48cfbc55a/slide_0.jpg)