in a room forced to hear my voice, there are better alternatives available. You could start here1, with a workshop presented by Mike Bostock himself. 1http://bost.ocks.org/mike/d3/workshop/
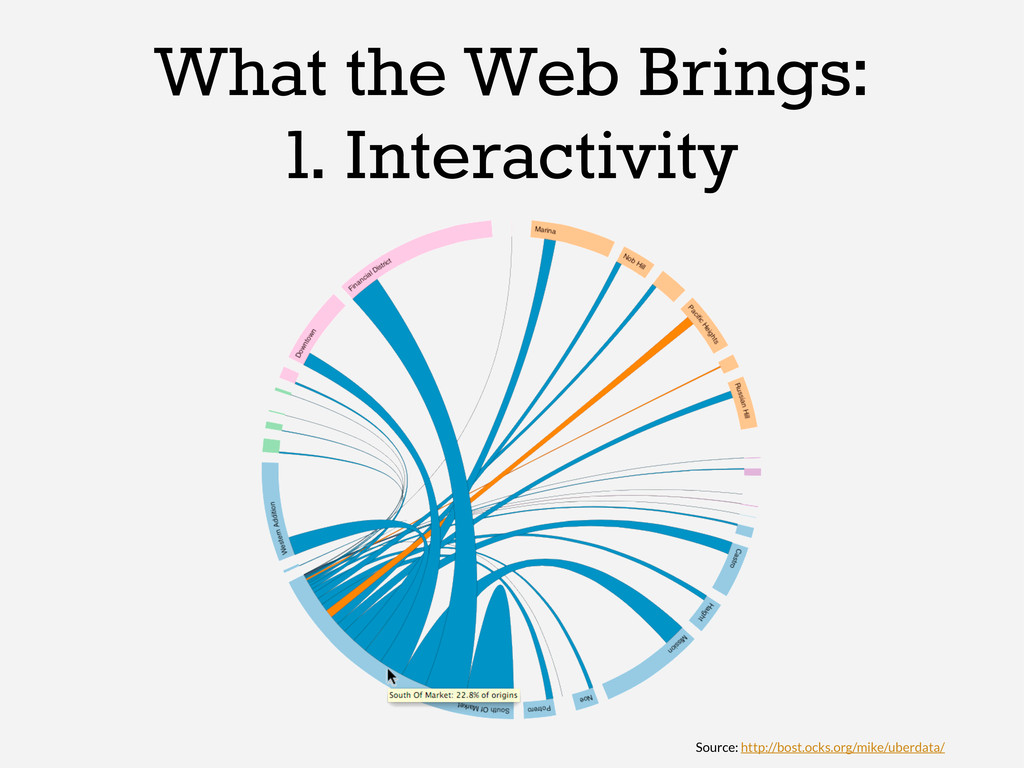
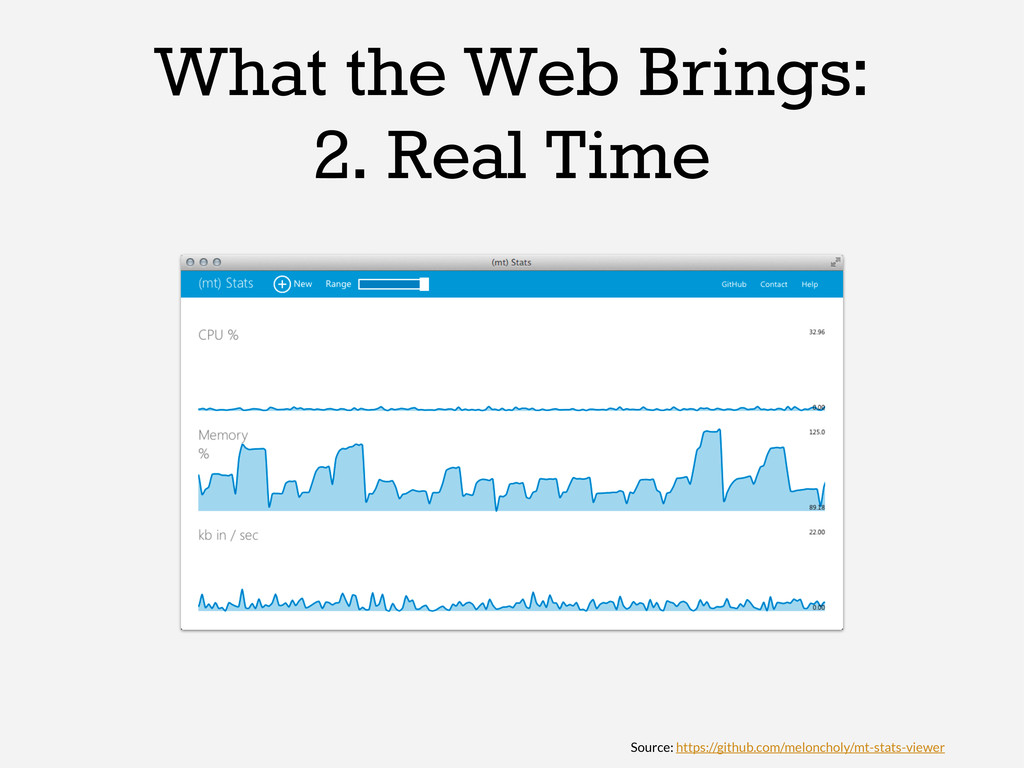
visualizations •With full interactivity using standard HTML/CSS/Javascript events •That can be automatically updated in real time as underlying data changes
using D3.js for their online content, e.g.: • New York Times: Four Ways to Slice Obama’s 2013 Budget Proposal • Le Monde: De Maastricht au traité budgétaire • New Scientist: The Changing Face of America
learning curve…” “D3 has a steep learning curve…” “…it has a steep learning curve…” “There is a huge learning curve…” “…the learning curve was quite steep.” http://www.datameer.com/blog/uncategorized/whats-behind-our-business-infographics-designer-d3-js-of-course-2.html http://www.recursion.org/d3-for-mere-mortals/ http://www.visweek.org/visweek/2012/tutorial/visweek/introduction-data-visualization-web-d3js http://dyninc.github.com/lunch-and-learn/1202-d3js.html http://www.tips-for-excel.com/tag/learn-d3-js-book/
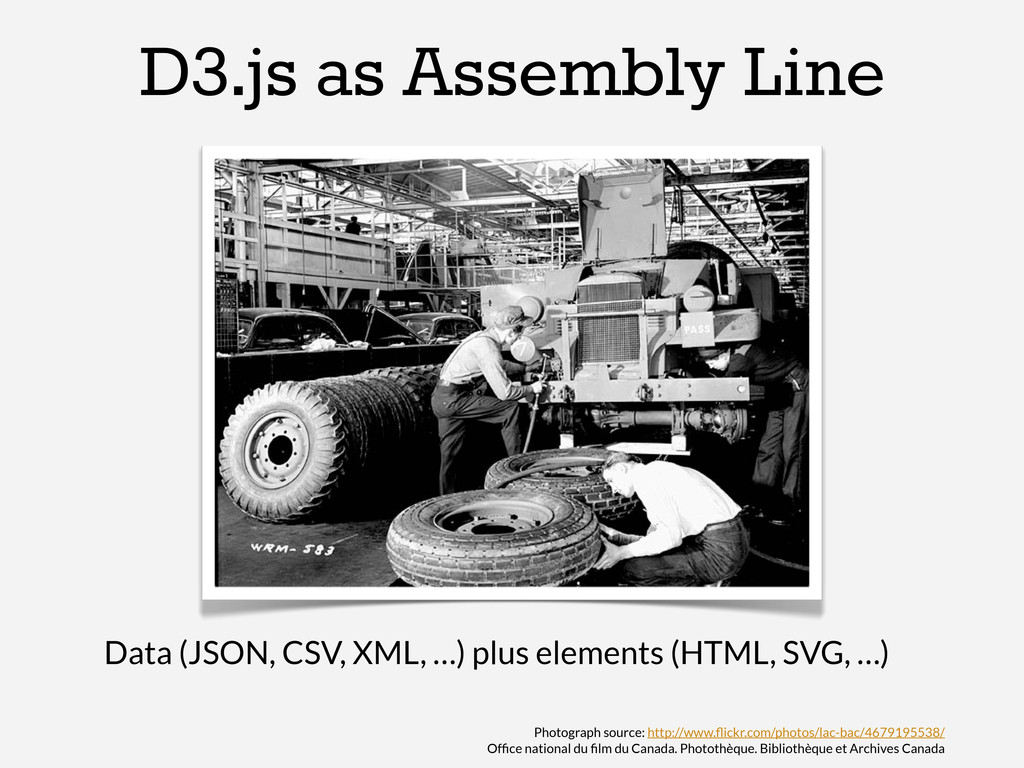
elements (HTML, SVG, …) Photograph source: http://www.flickr.com/photos/lac-bac/4679195538/ Office national du film du Canada. Photothèque. Bibliothèque et Archives Canada
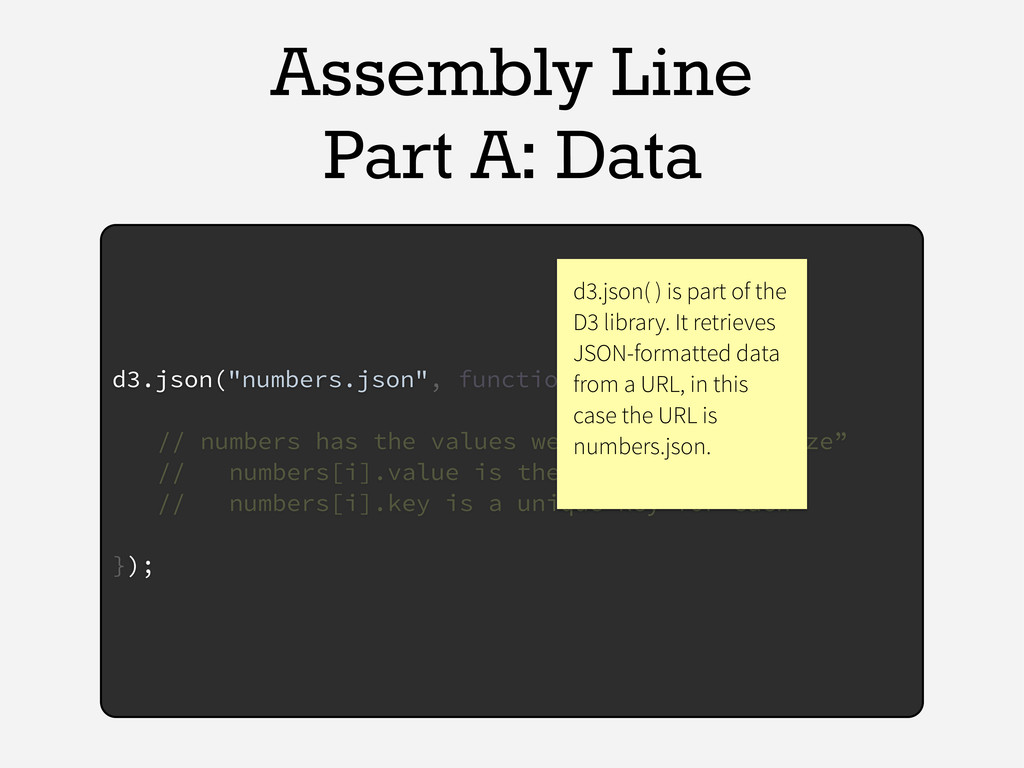
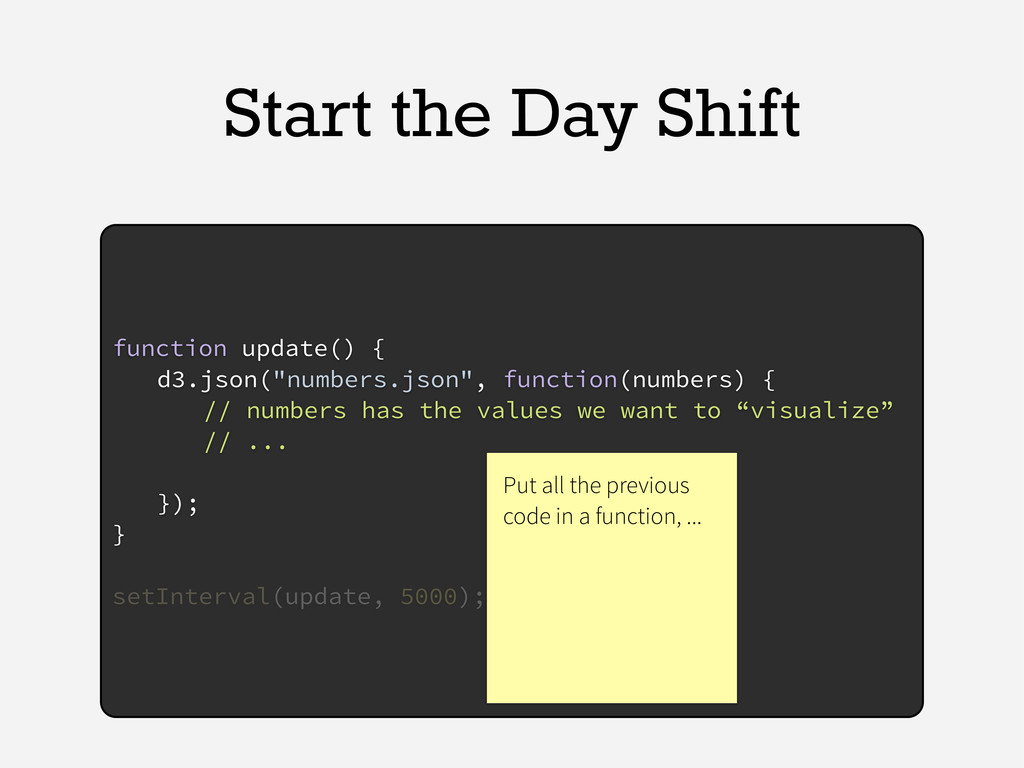
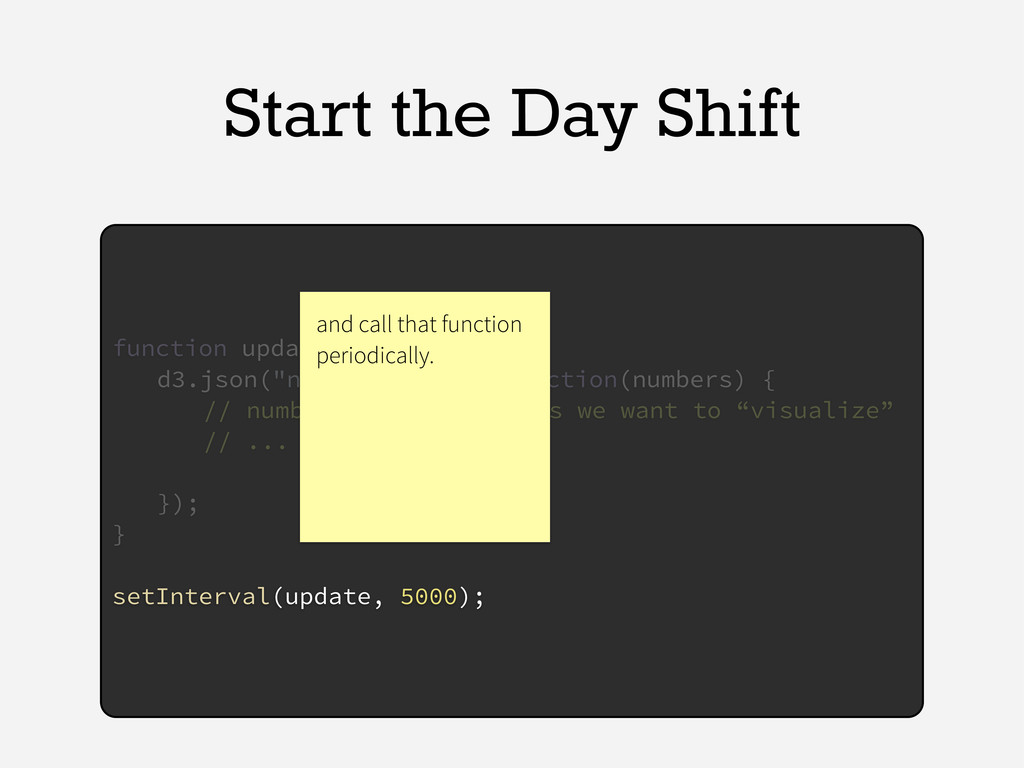
has the values we want to “visualize” // numbers[i].value is the value itself // numbers[i].key is a unique key for each }); d3.json( ) is part of the D3 library. It retrieves JSON-formatted data from a URL, in this case the URL is numbers.json.
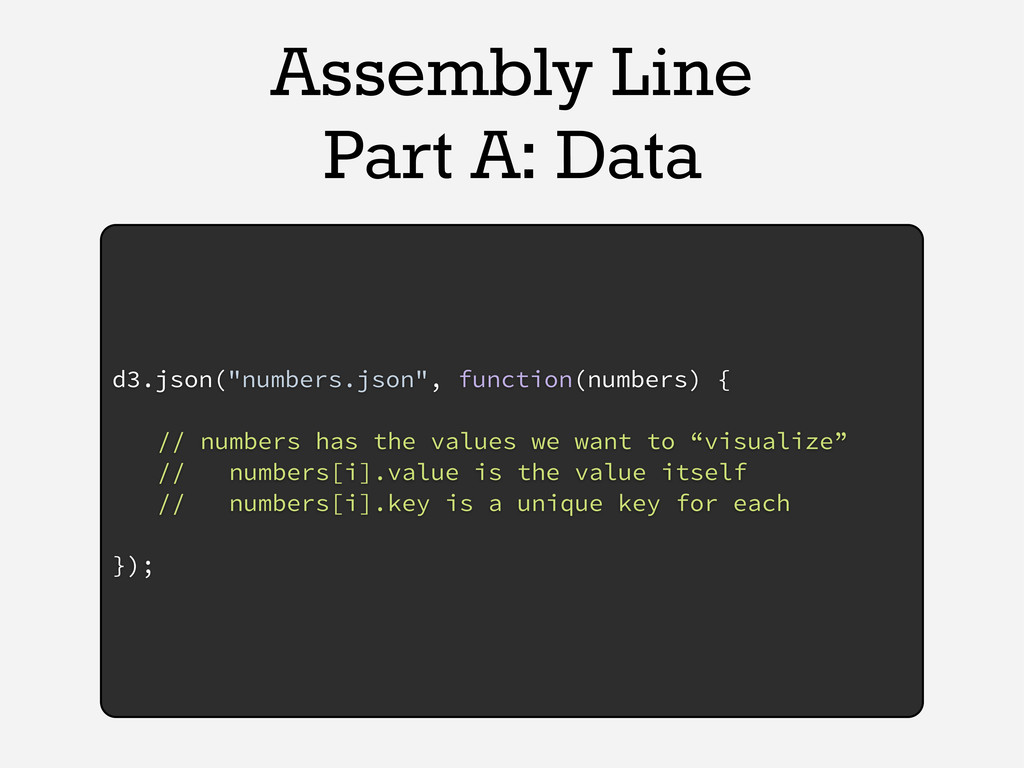
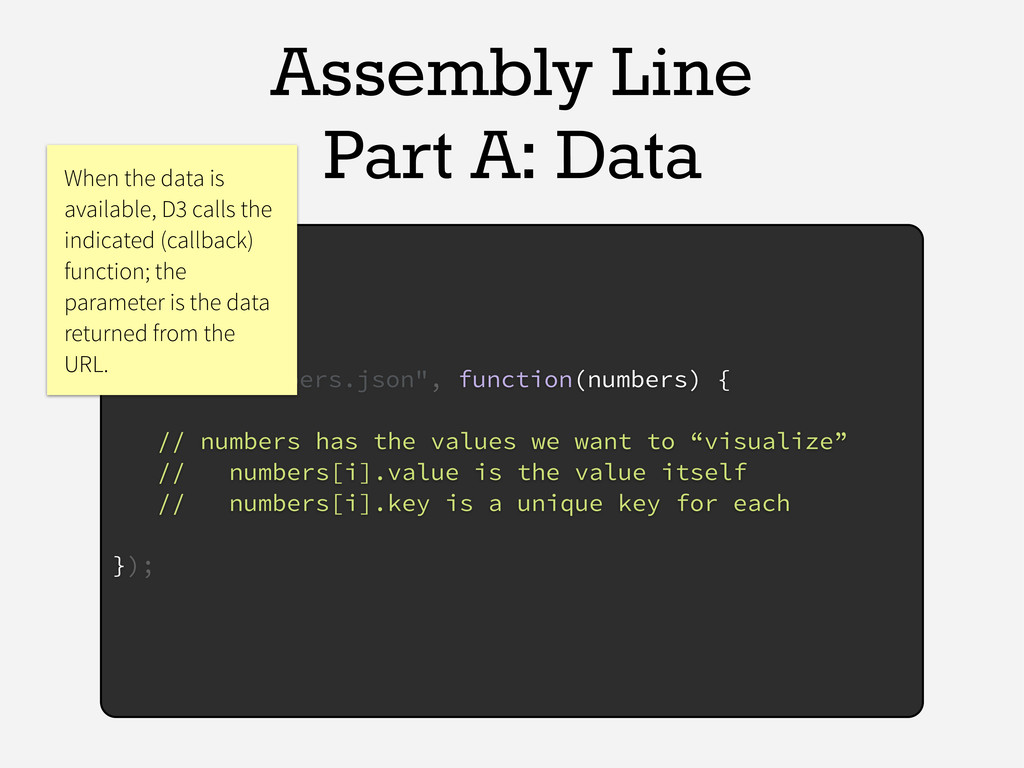
has the values we want to “visualize” // numbers[i].value is the value itself // numbers[i].key is a unique key for each }); When the data is available, D3 calls the indicated (callback) function; the parameter is the data returned from the URL.
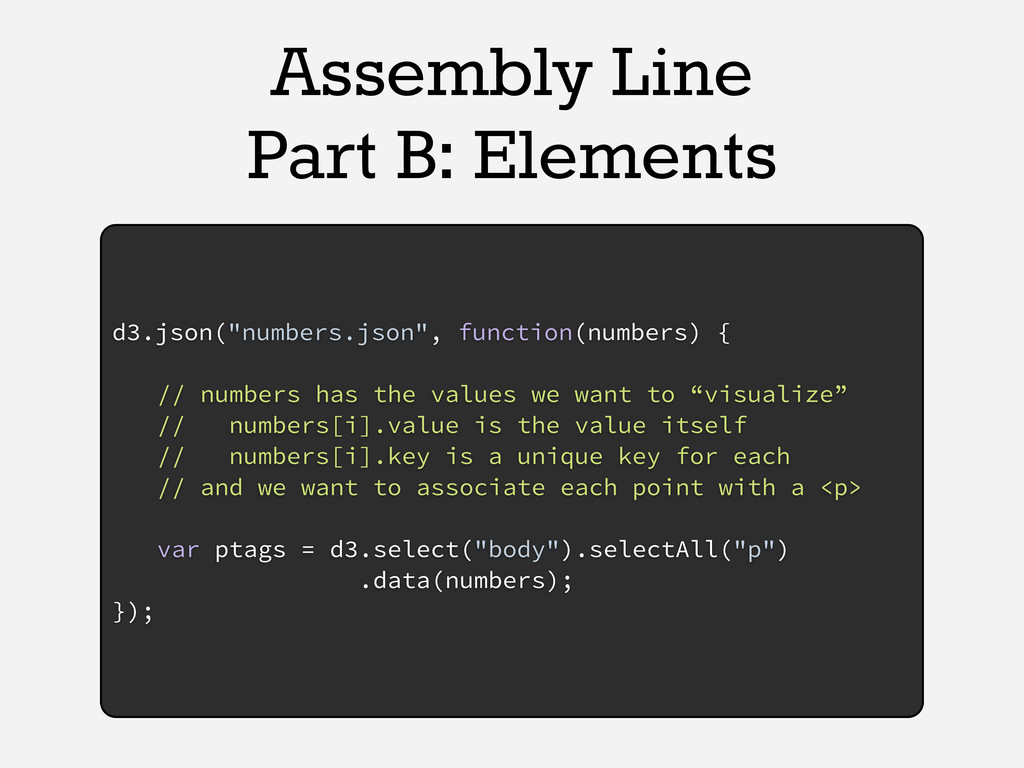
has the values we want to “visualize” // numbers[i].value is the value itself // numbers[i].key is a unique key for each // and we want to associate each point with a <p> var ptags = d3.select("body").selectAll("p") .data(numbers); });
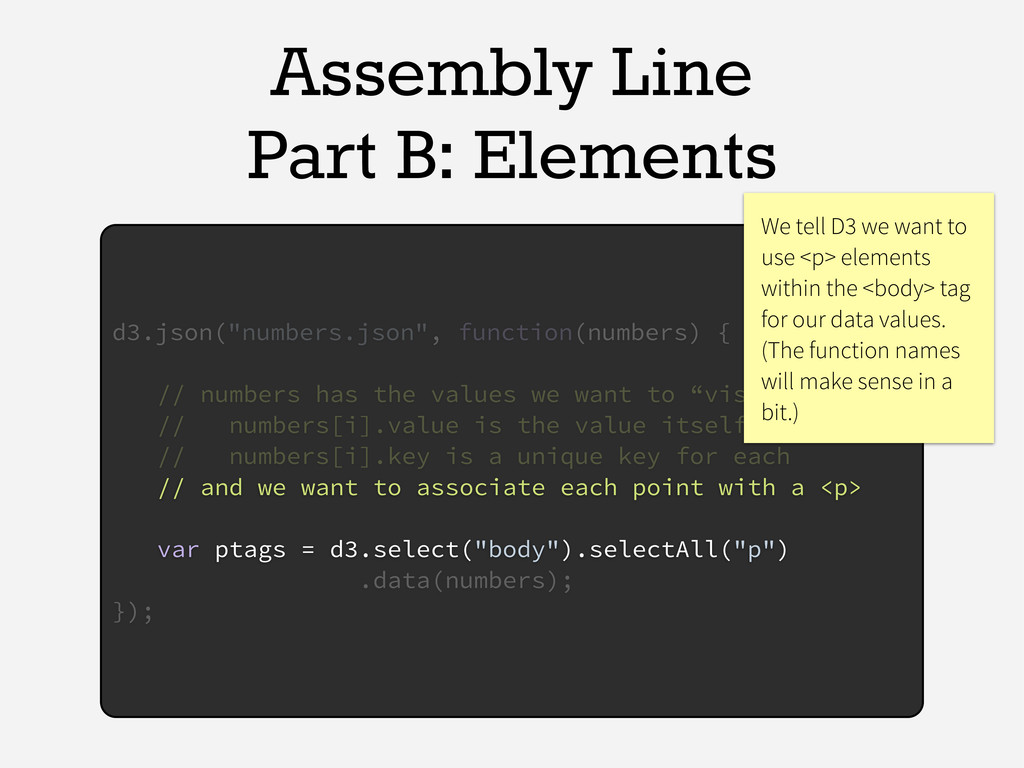
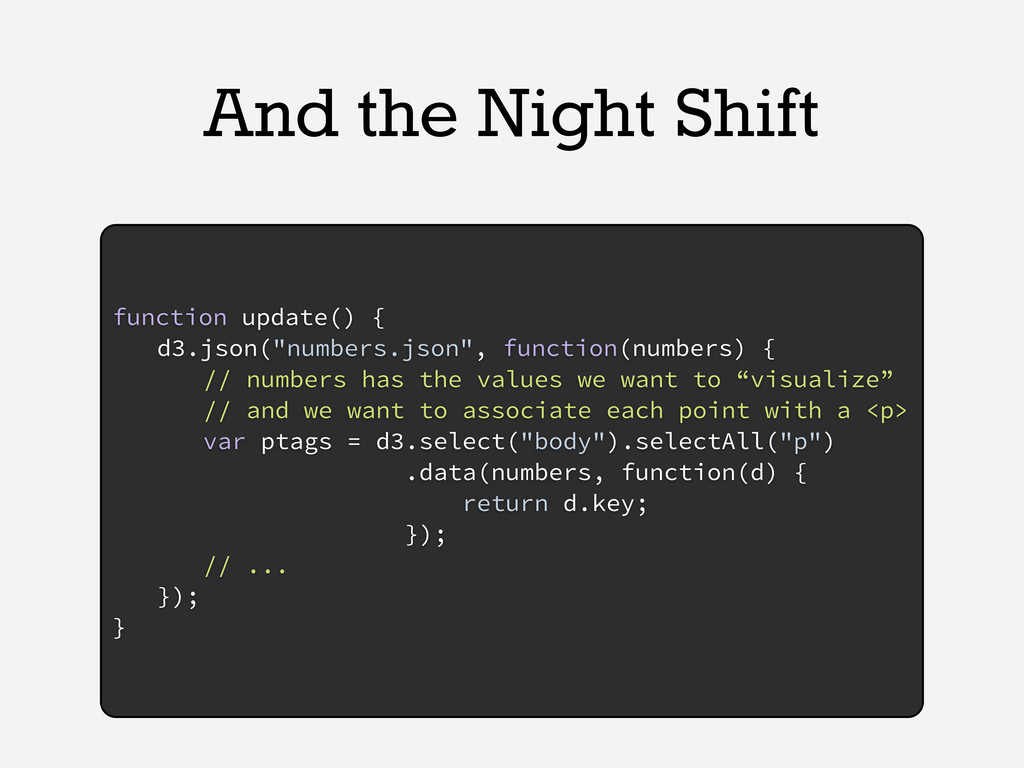
has the values we want to “visualize” // numbers[i].value is the value itself // numbers[i].key is a unique key for each // and we want to associate each point with a <p> var ptags = d3.select("body").selectAll("p") .data(numbers); }); We tell D3 we want to use <p> elements within the <body> tag for our data values. (The function names will make sense in a bit.)
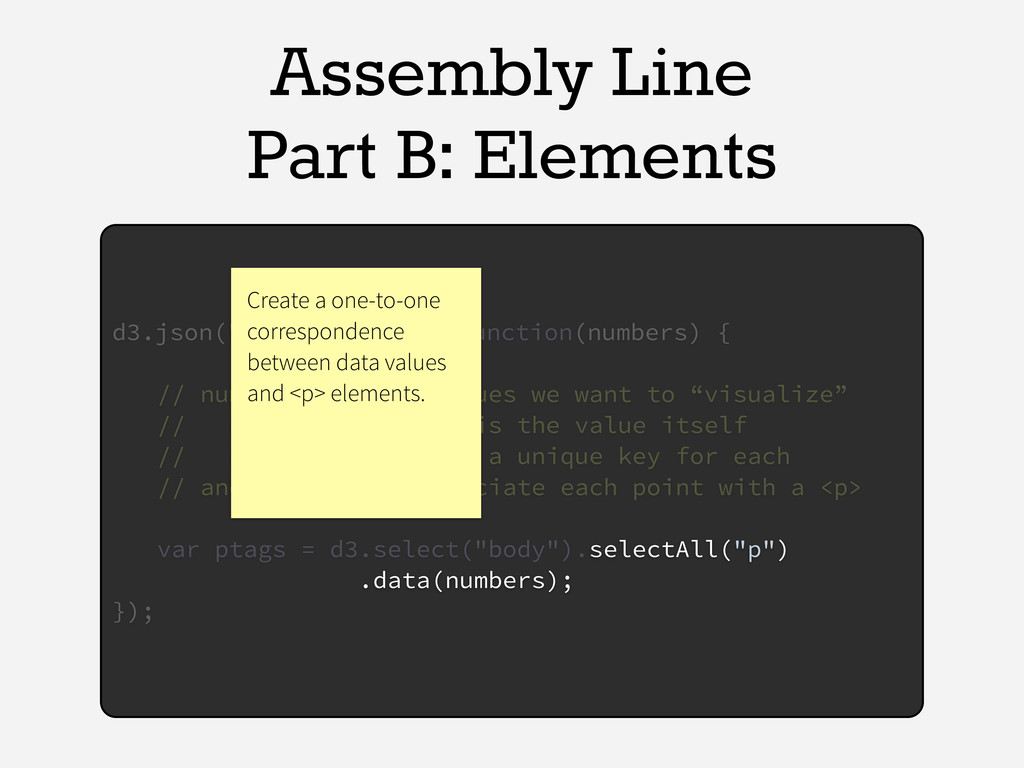
has the values we want to “visualize” // numbers[i].value is the value itself // numbers[i].key is a unique key for each // and we want to associate each point with a <p> var ptags = d3.select("body").selectAll("p") .data(numbers); }); Create a one-to-one correspondence between data values and <p> elements.
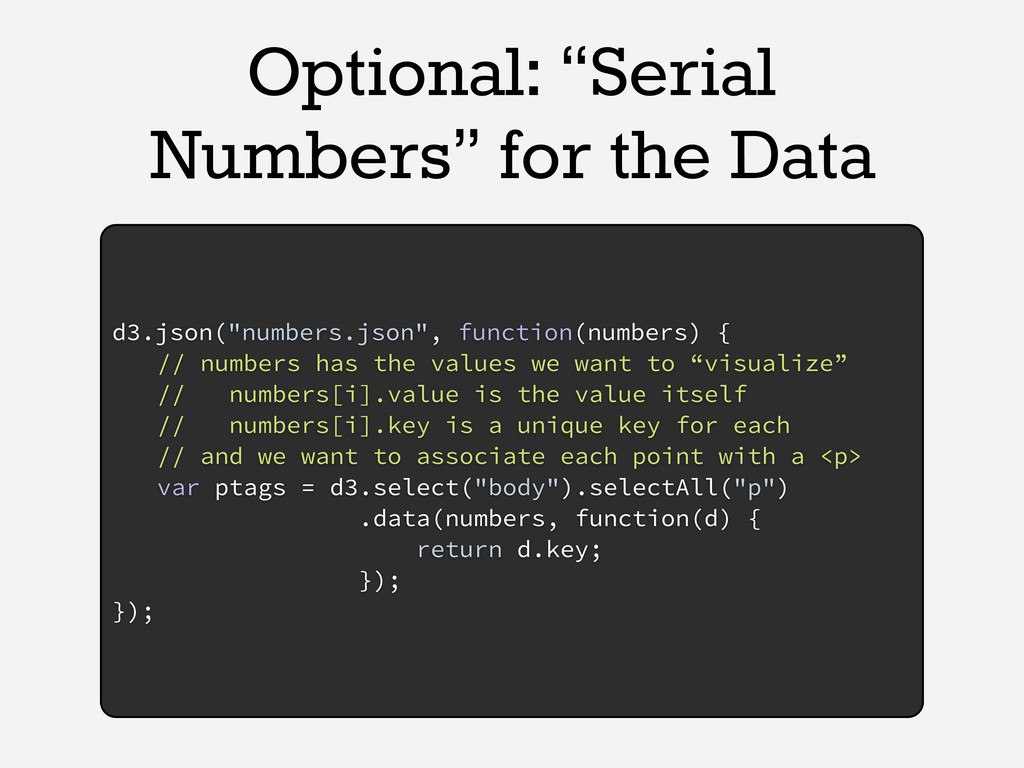
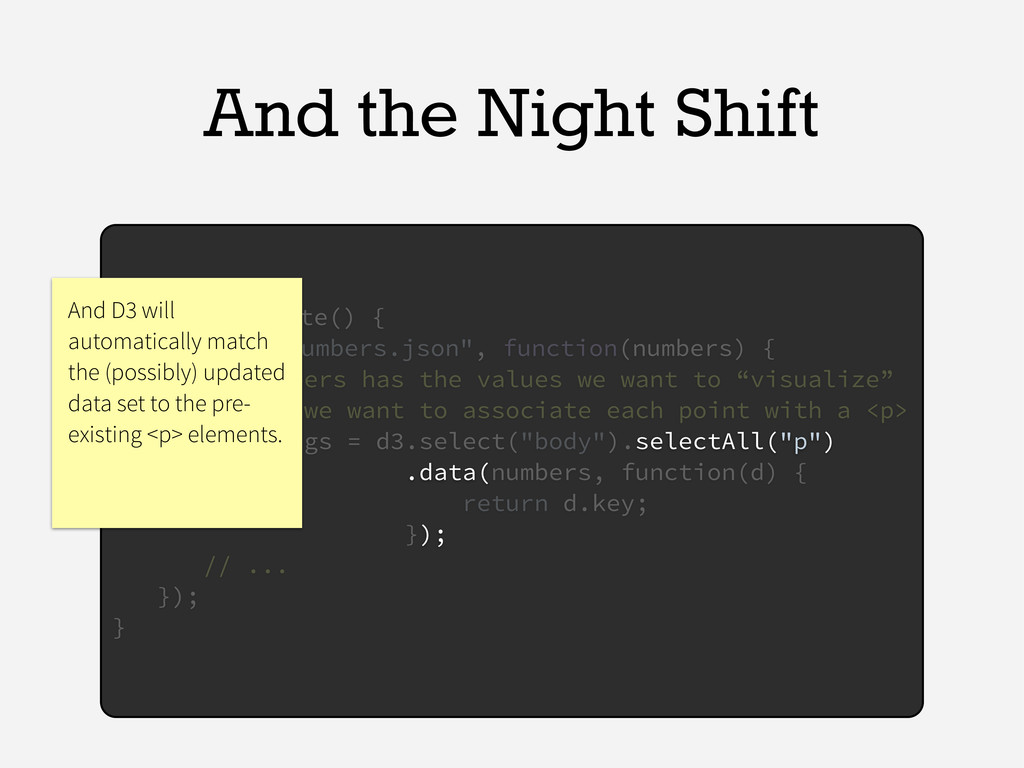
numbers has the values we want to “visualize” // numbers[i].value is the value itself // numbers[i].key is a unique key for each // and we want to associate each point with a <p> var ptags = d3.select("body").selectAll("p") .data(numbers, function(d) { return d.key; }); });
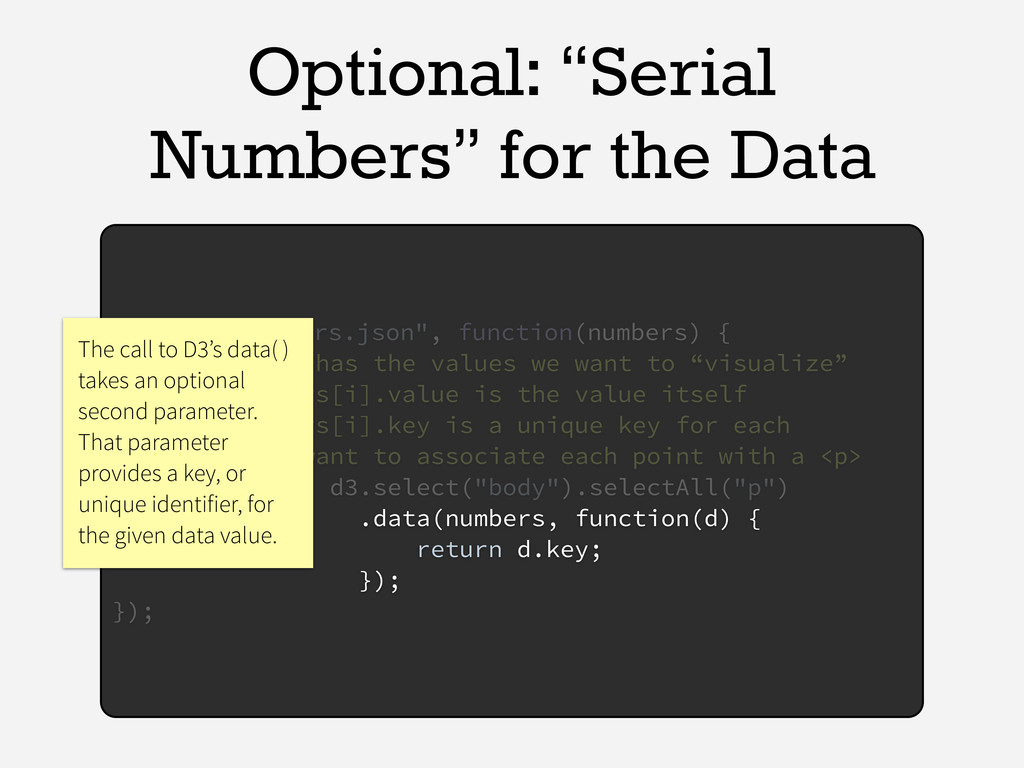
numbers has the values we want to “visualize” // numbers[i].value is the value itself // numbers[i].key is a unique key for each // and we want to associate each point with a <p> var ptags = d3.select("body").selectAll("p") .data(numbers, function(d) { return d.key; }); }); The call to D3’s data( ) takes an optional second parameter. That parameter provides a key, or unique identifier, for the given data value.
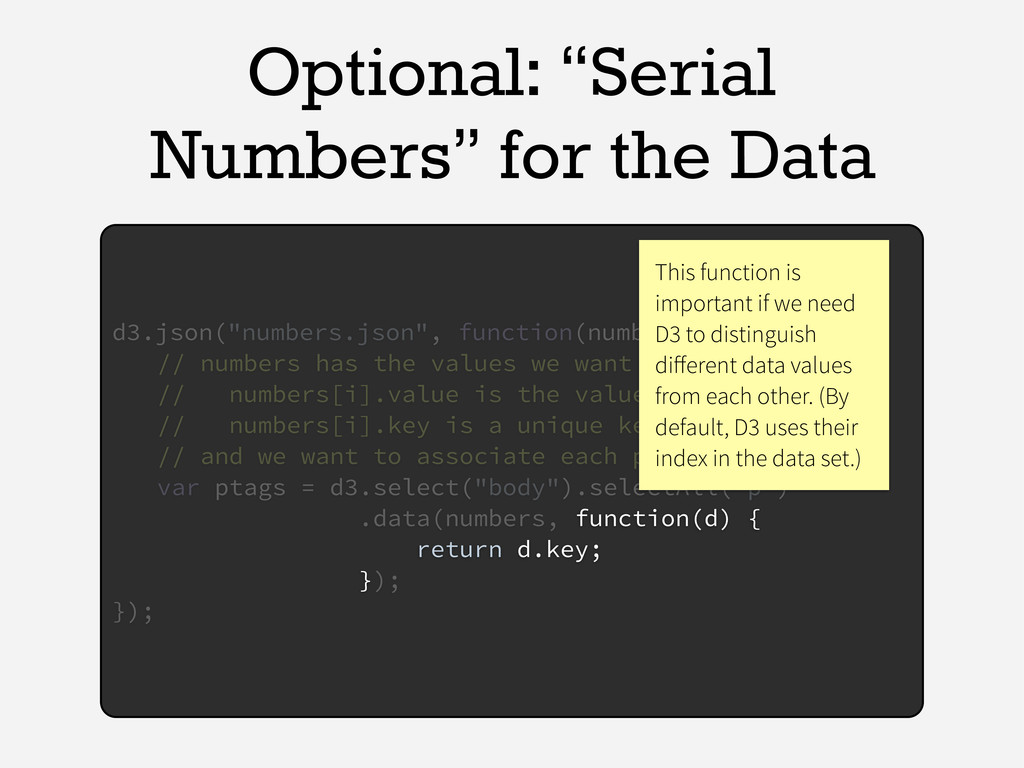
numbers has the values we want to “visualize” // numbers[i].value is the value itself // numbers[i].key is a unique key for each // and we want to associate each point with a <p> var ptags = d3.select("body").selectAll("p") .data(numbers, function(d) { return d.key; }); }); This function is important if we need D3 to distinguish different data values from each other. (By default, D3 uses their index in the data set.)
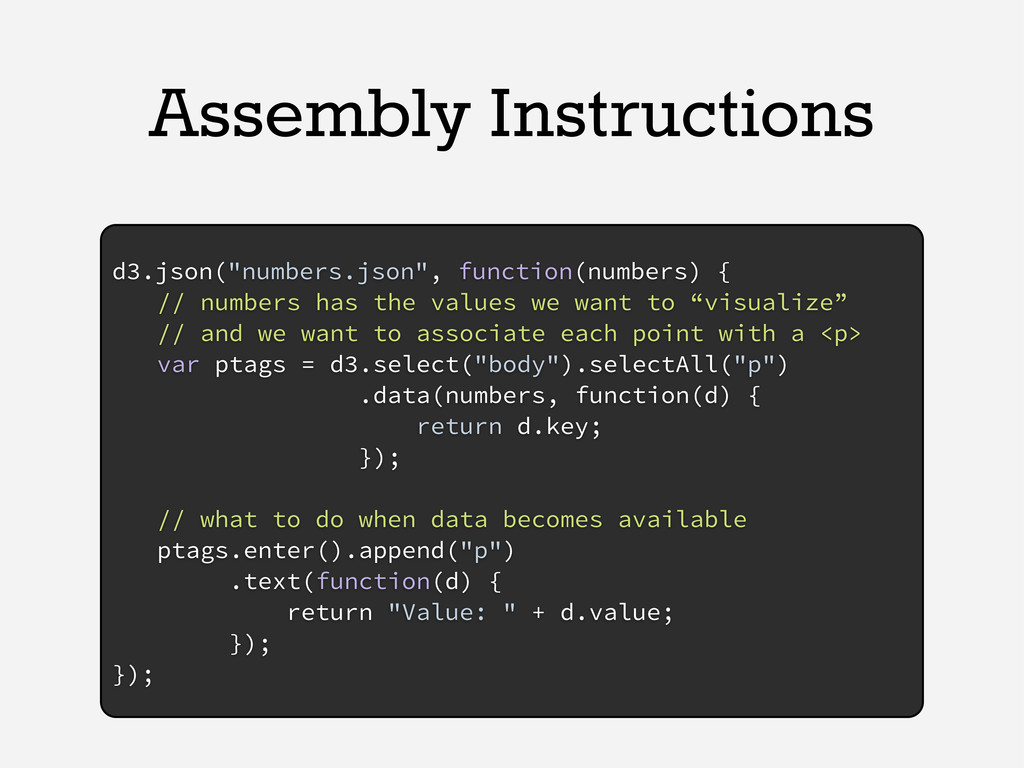
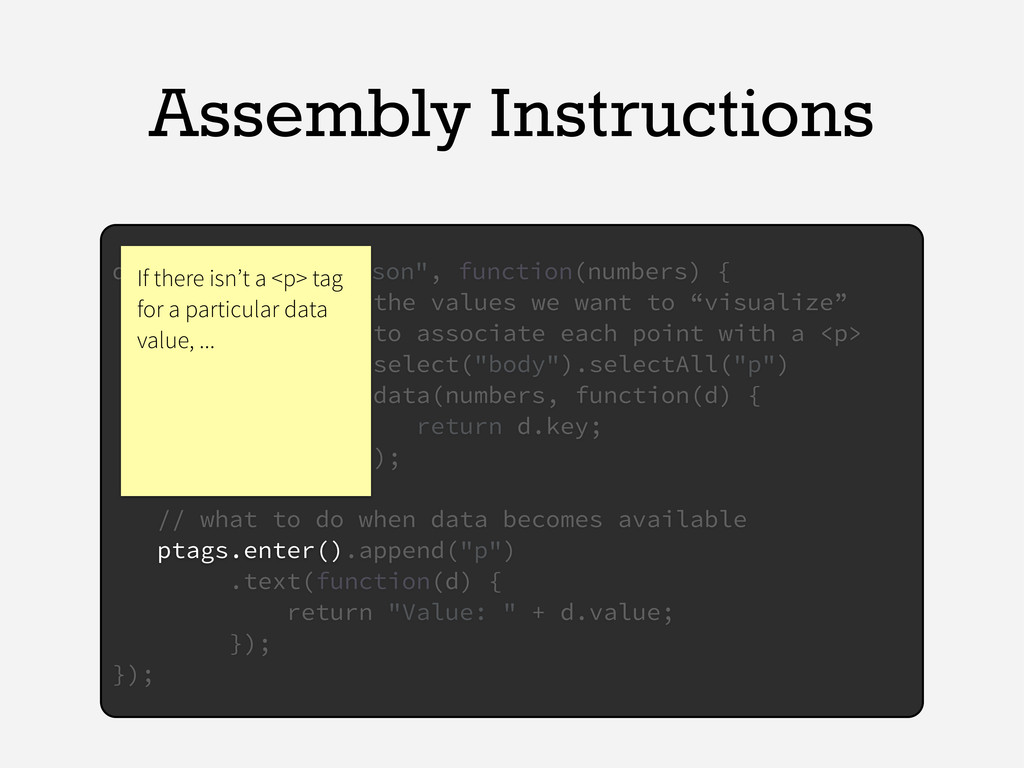
we want to “visualize” // and we want to associate each point with a <p> var ptags = d3.select("body").selectAll("p") .data(numbers, function(d) { return d.key; }); // what to do when data becomes available ptags.enter().append("p") .text(function(d) { return "Value: " + d.value; }); });
we want to “visualize” // and we want to associate each point with a <p> var ptags = d3.select("body").selectAll("p") .data(numbers, function(d) { return d.key; }); // what to do when data becomes available ptags.enter().append("p") .text(function(d) { return "Value: " + d.value; }); }); If there isn’t a <p> tag for a particular data value, ...
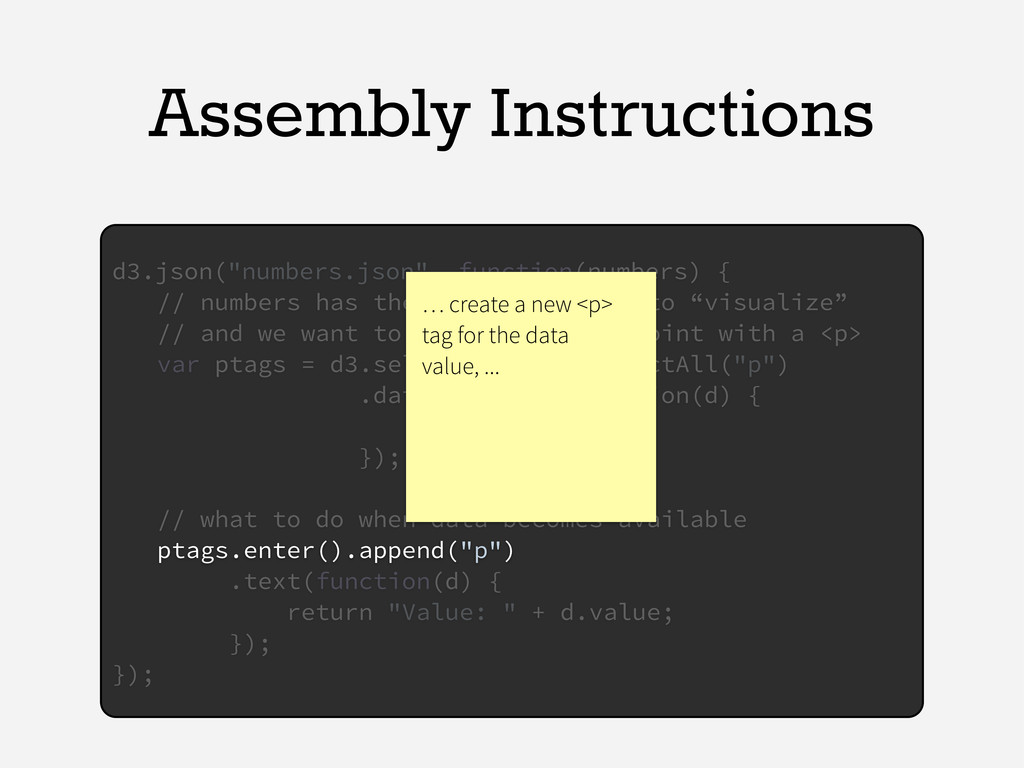
we want to “visualize” // and we want to associate each point with a <p> var ptags = d3.select("body").selectAll("p") .data(numbers, function(d) { return d.key; }); // what to do when data becomes available ptags.enter().append("p") .text(function(d) { return "Value: " + d.value; }); }); … create a new <p> tag for the data value, ...
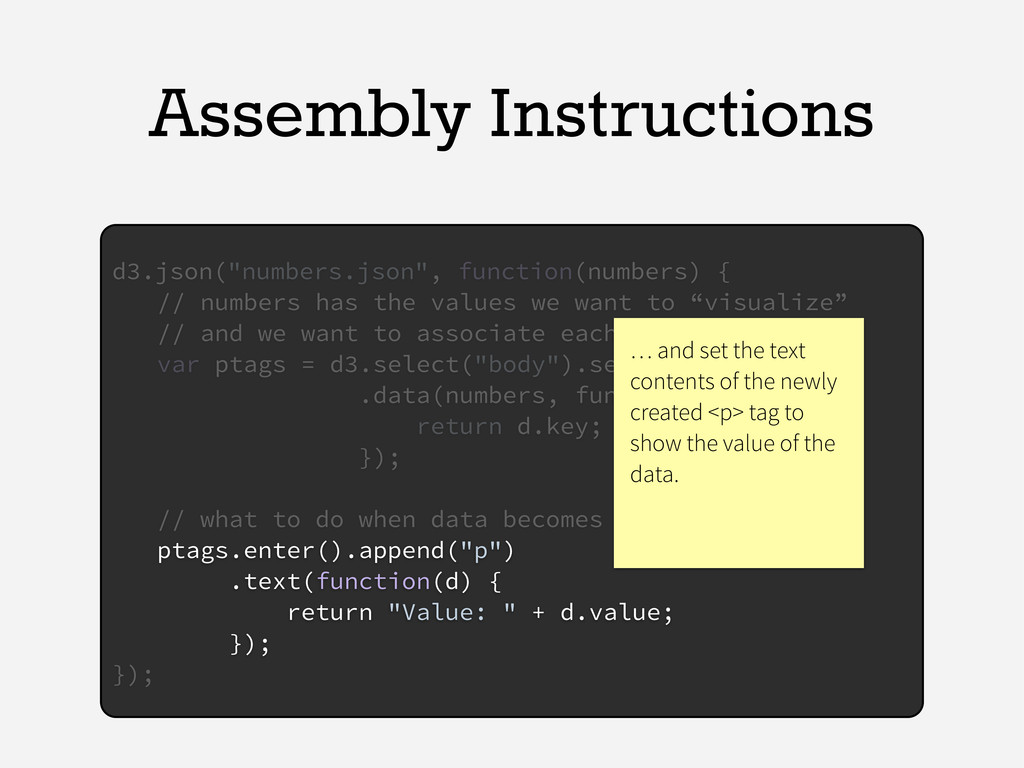
we want to “visualize” // and we want to associate each point with a <p> var ptags = d3.select("body").selectAll("p") .data(numbers, function(d) { return d.key; }); // what to do when data becomes available ptags.enter().append("p") .text(function(d) { return "Value: " + d.value; }); }); … and set the text contents of the newly created <p> tag to show the value of the data.
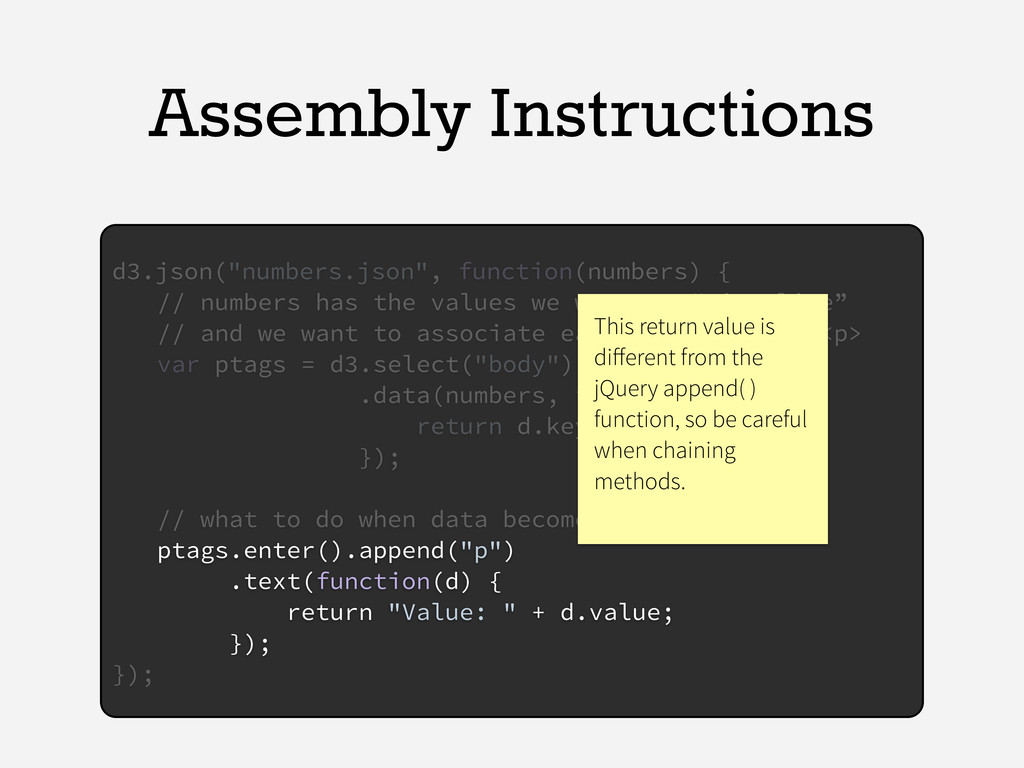
we want to “visualize” // and we want to associate each point with a <p> var ptags = d3.select("body").selectAll("p") .data(numbers, function(d) { return d.key; }); // what to do when data becomes available ptags.enter().append("p") .text(function(d) { return "Value: " + d.value; }); }); Note that D3’s append( ) returns the newly created element, not the container to which it was appended.
we want to “visualize” // and we want to associate each point with a <p> var ptags = d3.select("body").selectAll("p") .data(numbers, function(d) { return d.key; }); // what to do when data becomes available ptags.enter().append("p") .text(function(d) { return "Value: " + d.value; }); }); This return value is different from the jQuery append( ) function, so be careful when chaining methods.
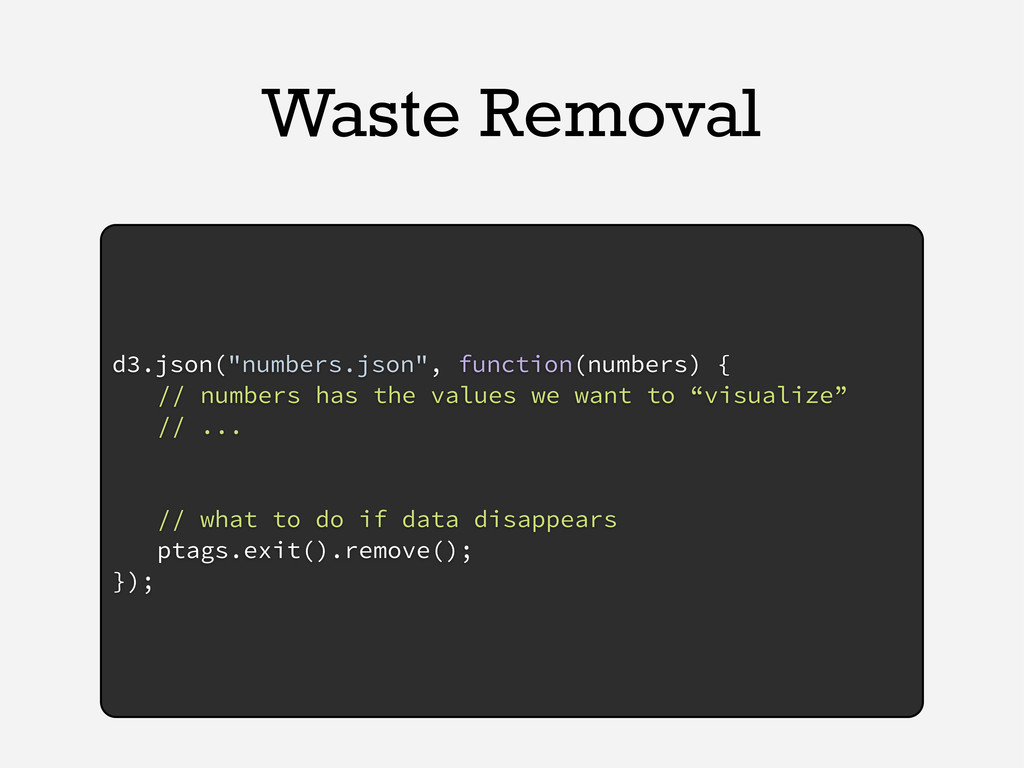
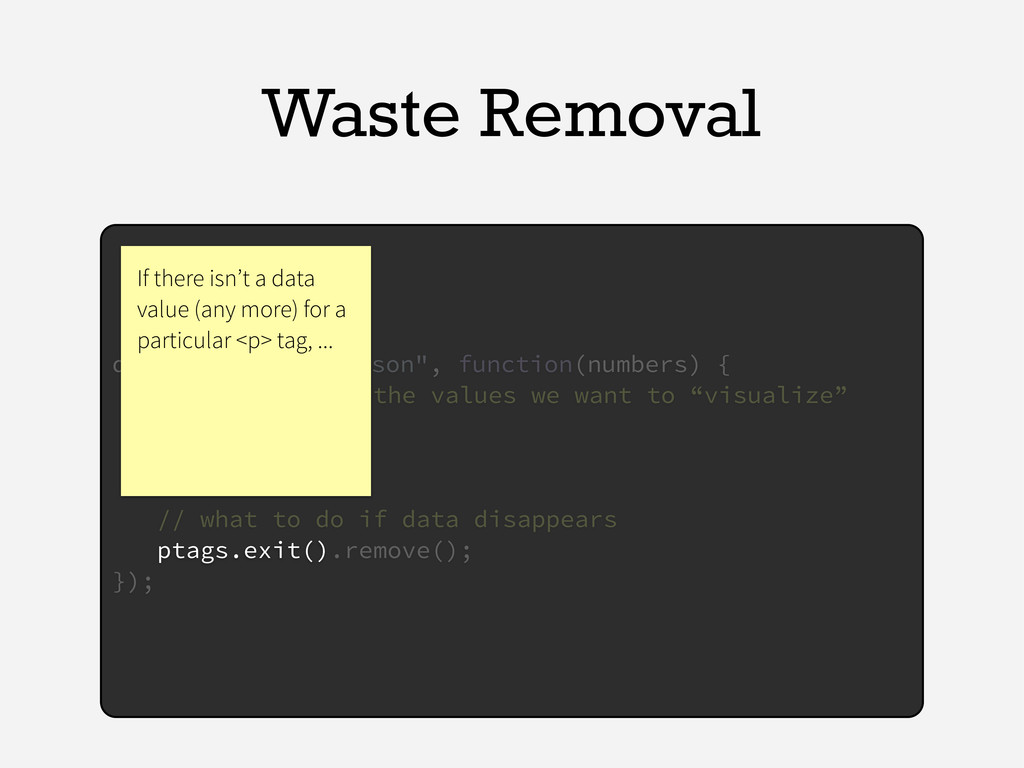
we want to “visualize” // ... // what to do if data disappears ptags.exit().remove(); }); If there isn’t a data value (any more) for a particular <p> tag, ...
// numbers has the values we want to “visualize” // and we want to associate each point with a <p> var ptags = d3.select("body").selectAll("p") .data(numbers, function(d) { return d.key; }); // ... }); }
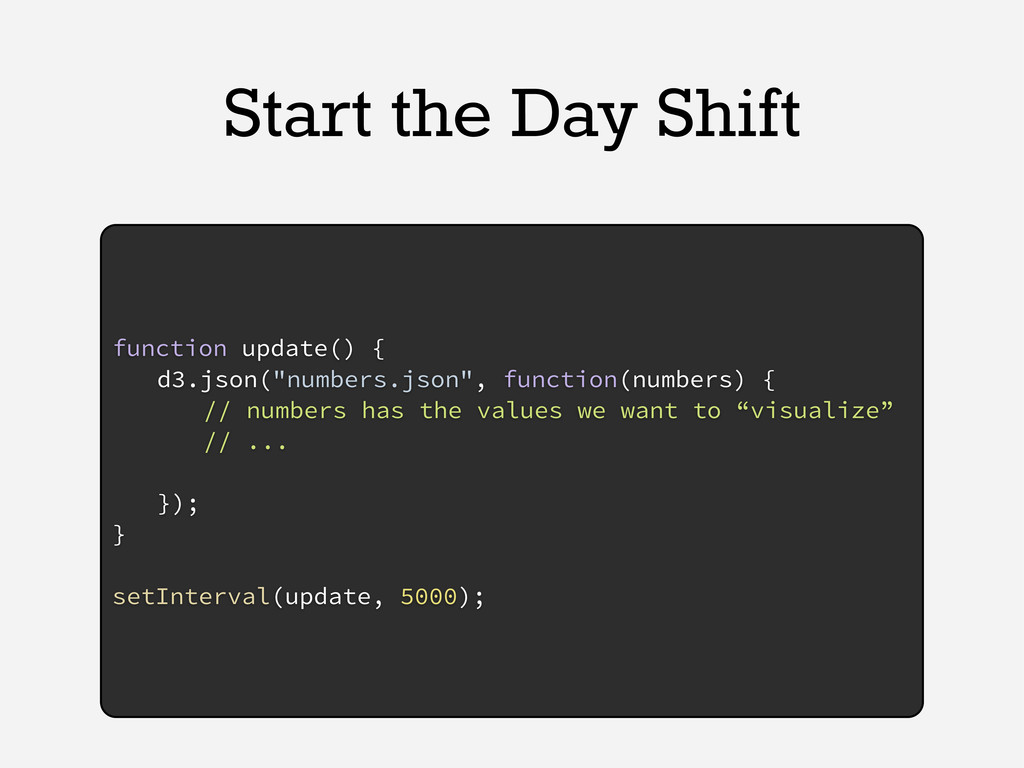
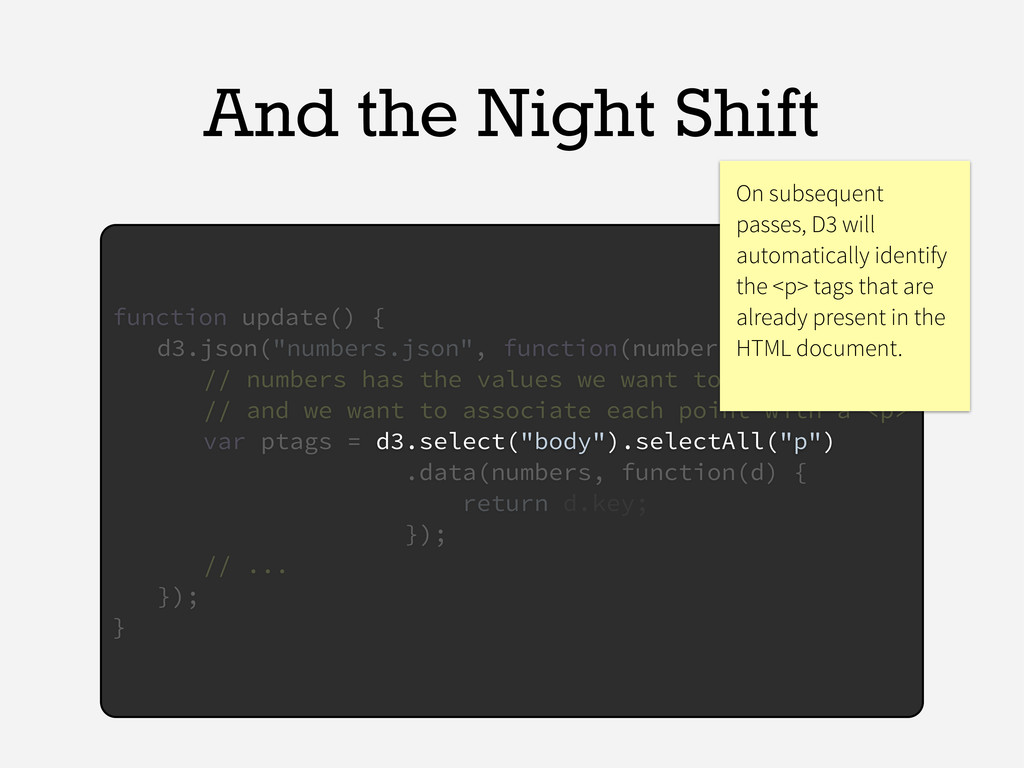
// numbers has the values we want to “visualize” // and we want to associate each point with a <p> var ptags = d3.select("body").selectAll("p") .data(numbers, function(d) { return d.key; }); // ... }); } On subsequent passes, D3 will automatically identify the <p> tags that are already present in the HTML document.
// numbers has the values we want to “visualize” // and we want to associate each point with a <p> var ptags = d3.select("body").selectAll("p") .data(numbers, function(d) { return d.key; }); // ... }); } And D3 will automatically match the (possibly) updated data set to the pre- existing <p> elements.
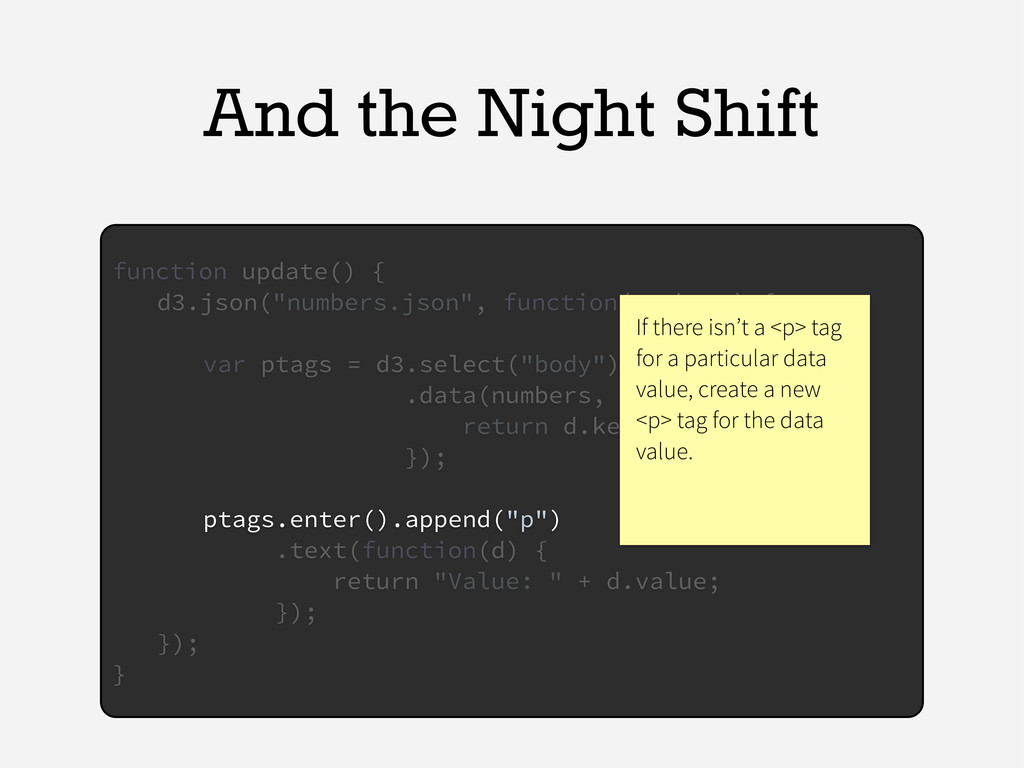
var ptags = d3.select("body").selectAll("p") .data(numbers, function(d) { return d.key; }); ptags.enter().append("p") .text(function(d) { return "Value: " + d.value; }); }); } If there isn’t a <p> tag for a particular data value, create a new <p> tag for the data value.
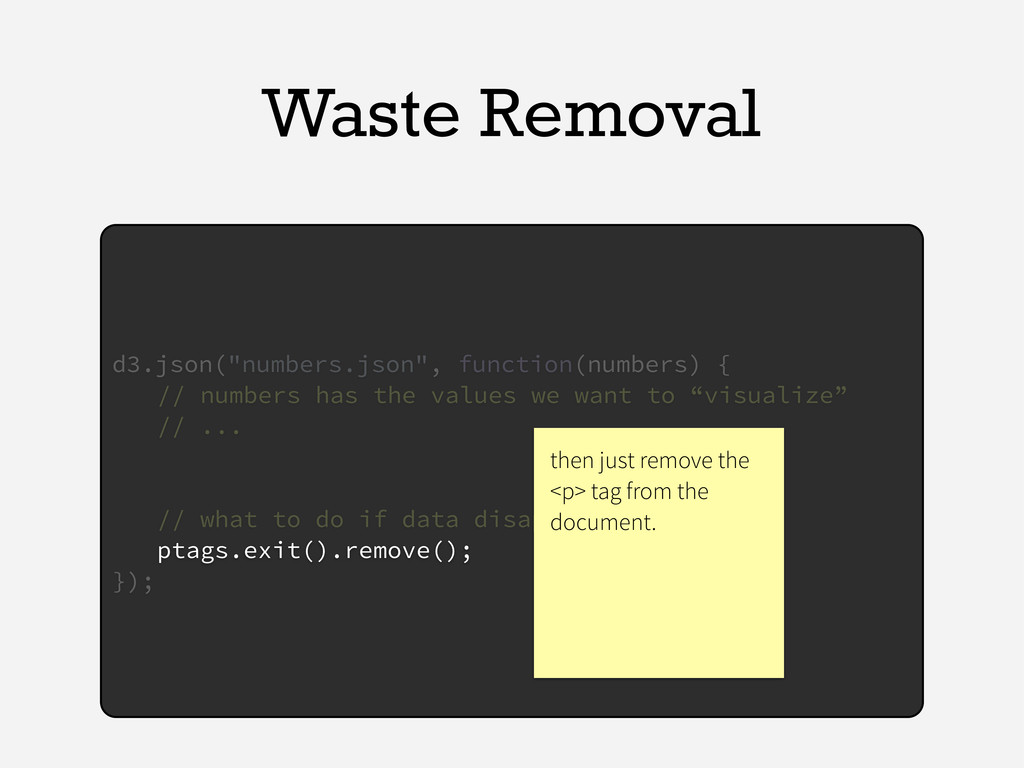
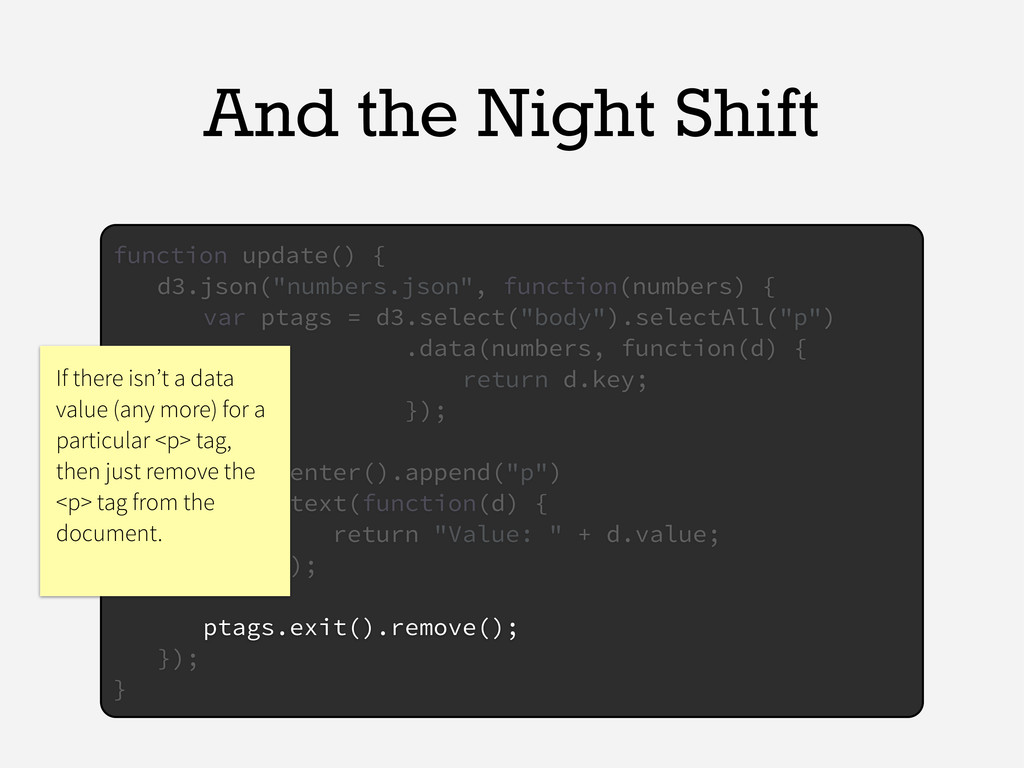
var ptags = d3.select("body").selectAll("p") .data(numbers, function(d) { return d.key; }); ptags.enter().append("p") .text(function(d) { return "Value: " + d.value; }); ptags.exit().remove(); }); } If there isn’t a data value (any more) for a particular <p> tag, then just remove the <p> tag from the document.
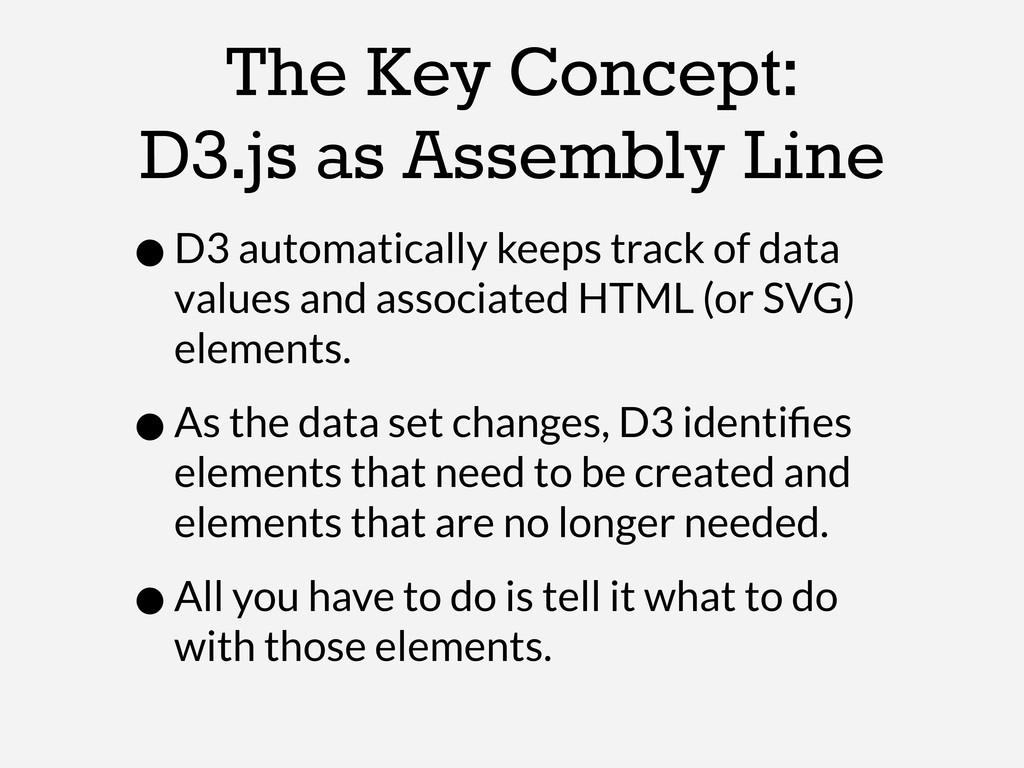
track of data values and associated HTML (or SVG) elements. •As the data set changes, D3 identifies elements that need to be created and elements that are no longer needed. •All you have to do is tell it what to do with those elements.
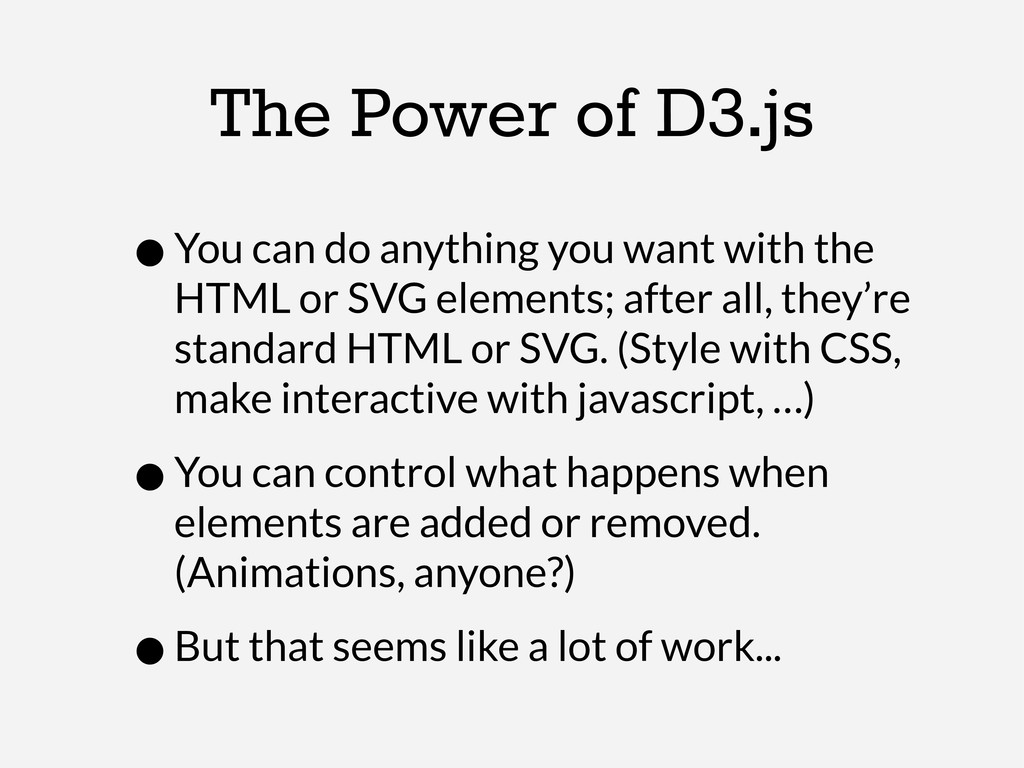
with the HTML or SVG elements; after all, they’re standard HTML or SVG. (Style with CSS, make interactive with javascript, …) •You can control what happens when elements are added or removed. (Animations, anyone?) •But that seems like a lot of work...
![[email protected] icon-comment icon-comment-alt icon-comments icon-comments-alt icon-credit-card icon-dashboard icon-download icon-download-alt icon-edit](https://files.speakerdeck.com/presentations/509023997536e50002000164/slide_0.jpg)