Upgrade to Pro — share decks privately, control downloads, hide ads and more …

Basic Pitfalls in Waveform Analysis

Basic Pitfalls in Waveform Analysis

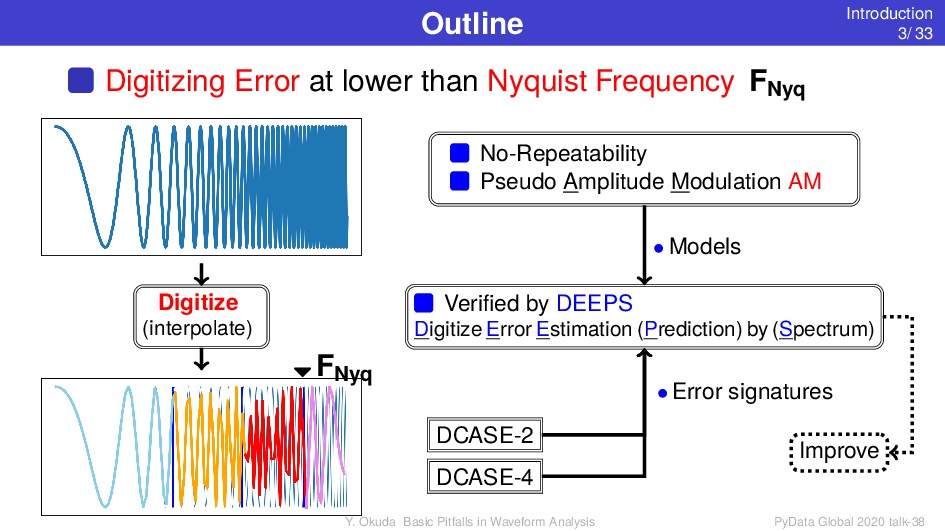
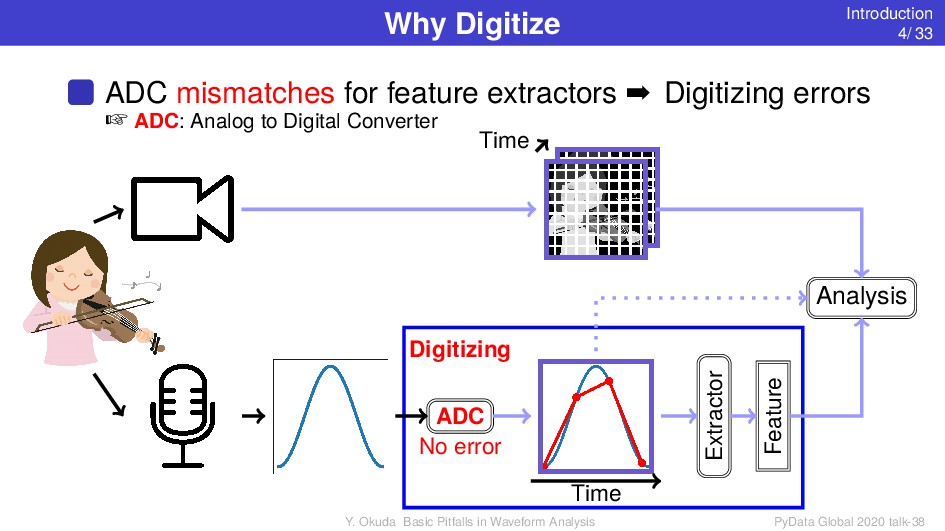
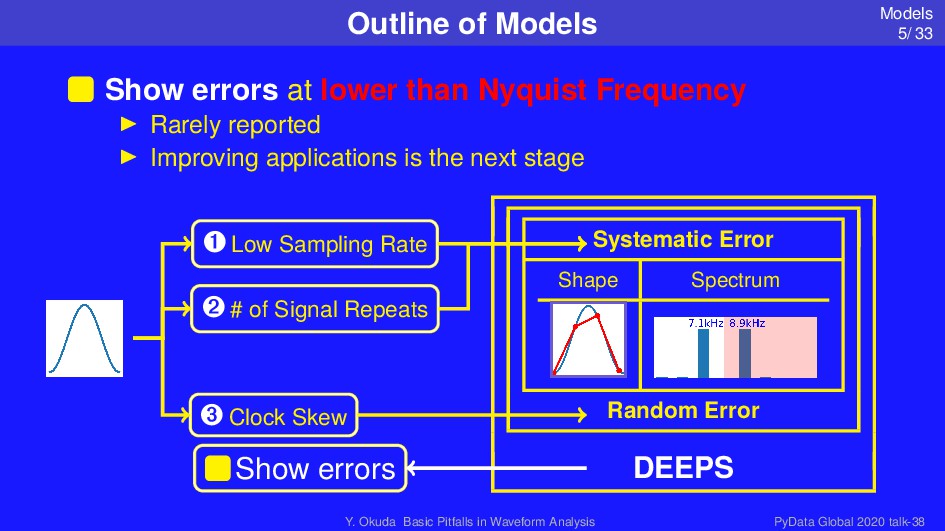
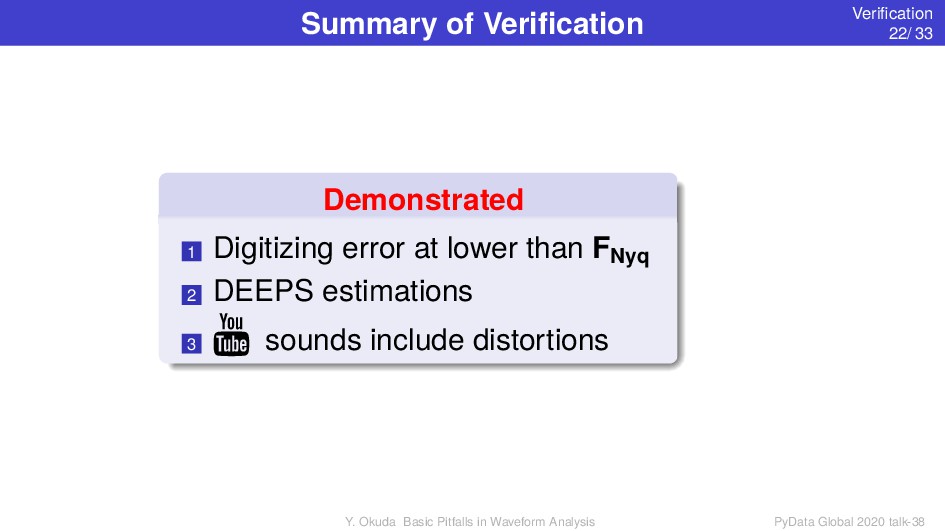
A PyData Global talk focuses on the usual preparation steps of waveform analysis, digitizing, and converting to spectra. A simple python module DEEPS shows the errors of waves having frequencies lower than Nyquist frequencies, which is verified on an open dedicated dataset and YouTube sounds. The verification may improve domain-specific feature extractions of your analyses.

Yukio Okuda

November 13, 2020
Tweet

More Decks by Yukio Okuda

Other Decks in Programming

Transcript

  1. Basic Pitfalls in Waveform Analysis - Introduce DEEPS - Yukio

    Okuda [email protected] an independent, Atsugi, Japan November 2020
  2. Me = Industrial Soft & Hard +40 Years Introduction 2/

    33 Soft+Hard, 2 Years: Mechanical Vibration of Mother Machines Sensor Selection , Waveform Failure Analysis Soft, 8 Years: OSS Soft+Hard, 15 Years: Digital LSI Testing and Failure Analysis based on Data Analysis IEEE-ITC Papers Soft, 17 Years: Developing LSI Design CAD tools Soft, 6 Years: Developing Information Retrieval Hard, 3 Years: Color TV Production Y. Okuda Basic Pitfalls in Waveform Analysis PyData Global 2020 talk-38
  3. Outline Introduction 3/ 33 Digitizing Error at lower than Nyquist

    Frequency FNyq Digitize (interpolate) No-Repeatability Pseudo Amplitude Modulation AM FNyq DCASE-2 DCASE-4 • Models • Error signatures Verified by DEEPS Digitize Error Estimation (Prediction) by (Spectrum) Improve Y. Okuda Basic Pitfalls in Waveform Analysis PyData Global 2020 talk-38
  4. Why Digitize Introduction 4/ 33 ADC mismatches for feature extractors

    ¬ Digitizing errors ADC: Analog to Digital Converter ADC No error Extractor Feature Analysis Digitizing Time Time Y. Okuda Basic Pitfalls in Waveform Analysis PyData Global 2020 talk-38
  5. Outline of Models Models 5/ 33 Show errors at lower

    than Nyquist Frequency Rarely reported Improving applications is the next stage – Low Sampling Rate — # of Signal Repeats Systematic Error Shape Spectrum Random Error DEEPS ˜ Clock Skew Show errors Y. Okuda Basic Pitfalls in Waveform Analysis PyData Global 2020 talk-38
  6. What is ADC Models 6/ 33 Sampling at the predefined

    intervals of TS Sampling Rate FSR := 1/TS ADC = Sampling Distortions at high frequency Deterministic error ¬ Repeatable Start time is uncontrollable Random error ¬ No-Repeatable H/W: designers-Clock Skew; users-Jitter Repeatable : the same data at the same condition Y. Okuda Basic Pitfalls in Waveform Analysis PyData Global 2020 talk-38
  7. Signal Frequency FSig , FSR , and FNyq Models 7/

    33 Nyquist frequency FNyq := 0.5FSR , Historical upper limit  FSR =16kHz FSig 0.1 FSR 0.5 FSR =FNyq 0.9 FSR Y. Okuda Basic Pitfalls in Waveform Analysis PyData Global 2020 talk-38
  8. Signal Repeats Models 8/ 33 Signal repeats change shapes &

    spectra Pseudo Amplitude(AM) Modulation at FSig = 7.1 kHz  16kHz sampled waves are up-converted to 160kHz Genuine AM Boundary FFT Y. Okuda Basic Pitfalls in Waveform Analysis PyData Global 2020 talk-38
  9. Un-Controllable Start Time Models 9/ 33 Errors between measurements &

    in a measurement Errors depend on FSig Robustness ADC Y. Okuda Basic Pitfalls in Waveform Analysis PyData Global 2020 talk-38
  10. Estimate Error Variance caused by Start Time Variance Models 10/

    33 At a Start Time variance of Clock offsets Co =[0, 0.3, 0.6] Repeat number NR = 4, FSig = 6.1kHz, ∆ FSp := FSp − FSig Wave FFT Spectrum FSp Estimation ∆ FSp Amp.: Summarize, Normalize Freq.: ∆ from 6.1kHz Heat Map ∆ FSp 6.1kHz ∆ FSp Y. Okuda Basic Pitfalls in Waveform Analysis PyData Global 2020 talk-38
  11. Compare Error Variances of FSig s at NR = 4

    Models 11/ 33 Clock offsets Co = 0, 0.1, 0.2, .., 0.9 Assume random uniform FSig = 6, 6.1, 6.2, .., 7.5 kHz, NR = 4 FSig – — ∆ FSp – 6.4kHz shows the own frequency — 7.1kHz shows the own frequency Others show: Different one frequency Different two or three frequencies Y. Okuda Basic Pitfalls in Waveform Analysis PyData Global 2020 talk-38
  12. Compare Error Variances of FSig s at NR = 8

    Models 12/ 33 Clock offsets Co = 0, 0.1, 0.2, .., 0.9 Assume random uniform FSig = 6, 6.1, 6.2, .., 7.5 kHz, NR = 8 FSig – — ˜ ∆ FSp – 6.4kHz shows the own frequency Same as at NR = 4 — 7.1kHz shows the own frequency Same as at NR = 4 ˜ 6.1kHz shows the own frequency Three frequencies at NR = 4 Others show two or three frequencies Y. Okuda Basic Pitfalls in Waveform Analysis PyData Global 2020 talk-38
  13. A Magic Signal of 6.4 kHz Models 13/ 33 Differently

    distorted waves yield a FSp of 6.4 kHz! NR = 4 FFT Spectrum NR = 8 FFT Spectrum Y. Okuda Basic Pitfalls in Waveform Analysis PyData Global 2020 talk-38
  14. Summary of Models Models 14/ 33 DEEPS estimates error signatures

    at a FSR of 16 kHz Signals higher than 4 kHz are distorted No error signatures Except, the Signals of 6.4 kHz, 7.1 kHz • Show the FSp of the FSig • Signals of 7.1 kHz show AM modulation waves Y. Okuda Basic Pitfalls in Waveform Analysis PyData Global 2020 talk-38
  15. Outline of Verification Verification 15/ 33 A/B Testing is difficult

    for an independent Challenge post-mortem analysis on DCASE Challenge Datasets DCASE: Detection & Classification of Acoustic Scenes & Events Task2 ĸ • Obtained by the one tool Statistical analysis of spectra • 13,000 nominal sounds • 10 sec • FSR = 16 kHz • four device types Task4 ĸ • From Used by several Voice Recognition Activities • 12,000 unlabeled sounds, non-controllable measurements • 10 sec • FSR = 16 kHz, 44.1 kHz Y. Okuda Basic Pitfalls in Waveform Analysis PyData Global 2020 talk-38
  16. Averaged Spectra of Task2 Verification 16/ 33 Compare tails of

    spectra from 4kHz – All 6.4kHz peaks — Slider/Valve 7.1kHz peaks – – – – — — Y. Okuda Basic Pitfalls in Waveform Analysis PyData Global 2020 talk-38
  17. How to locate error signals Verification 17/ 33 Apply Low-Pass

    Filter-Bank Spectrum has no time information, i.e. Non-temporal  Reversed signals show the same spectra FFT Y. Okuda Basic Pitfalls in Waveform Analysis PyData Global 2020 talk-38
  18. Task2 Ex1: 6.4kHz Verification 18/ 33 Spectrum peaks around 6.4

    kHz  Ex1: slider/train/normal id 06 00000075 Y. Okuda Basic Pitfalls in Waveform Analysis PyData Global 2020 talk-38
  19. Task2 Ex1: 7.1kHz Verification 19/ 33 Spectrum peaks around 7.1

    kHz  Ex1: slider/train/normal id 06 00000075 Y. Okuda Basic Pitfalls in Waveform Analysis PyData Global 2020 talk-38
  20. Spectrum Endpoints of Task4 Verification 20/ 33 All sounds may

    include distortions – 70% sounds are digitized by FSR =16 kHz, upconverted to 44.1 kHz — 30% sounds are digitized by FSR =44.1 kHz – – — — Y. Okuda Basic Pitfalls in Waveform Analysis PyData Global 2020 talk-38
  21. AM Signatures at a FSR of 44.1 kHz Verification 21/

    33 Peak count (2, 3, 4, 5) identifies AM signatures & FSig 19.9 kHz — ˜ ™ š ˜ ™ ˜ ˜ ˜ ˜ — ˜ Y. Okuda Basic Pitfalls in Waveform Analysis PyData Global 2020 talk-38
  22. Summary of Verification Verification 22/ 33 Demonstrated 1 Digitizing error

    at lower than FNyq 2 DEEPS estimations 3 sounds include distortions Y. Okuda Basic Pitfalls in Waveform Analysis PyData Global 2020 talk-38
  23. Discussion for Improvements Discussion 23/ 33 Application policies set Max

    FSig & Max Error Feature error predictions set FSR ADC + Waves Waveform Variations Controllable Non-Controllable Max FSig Max Error FSR Correct Feature Extraction Error Prediction FFT Statistics Time Series Wavelet Cepstrum Human Ear Eq. . . . DA Data Analysis Appli. Science Medical Industry Home . . . Y. Okuda Basic Pitfalls in Waveform Analysis PyData Global 2020 talk-38
  24. Feature Error Predictions by DEEPS Discussion 24/ 33 Feature extractor

    decide error from waveform variations Wave Gen Drive Extractor Features FSig -N Wave Gen Drive Extractor Features FSig -1 Sum Indicator FSig Already FFT with spectrum Challenging predictions: • Characteristics of waves • References to Metrics • Parameters • Window size • FSig dependancy • . . . May be effective on non-controllable systems Y. Okuda Basic Pitfalls in Waveform Analysis PyData Global 2020 talk-38
  25. Error Metrics for FFT: REsp Discussion 25/ 33 Relative FSp

    Error REsp := (FSp – FSig )/ FSig  Co= 0, 0.1, 0.2, .., 0.9, FSig = 1, 1.1, .. 7.9, NR = 4 FSig REsp Y. Okuda Basic Pitfalls in Waveform Analysis PyData Global 2020 talk-38
  26. Error Metrics for FFT: FSp Discussion 26/ 33 Ghost FSp

    , FSig of 4.2, 4.3, 4.4 kHz show FSp of 4.0, 4.3, 4.6 kHz  Co= 0, 0.1, 0.2, .., 0.9, FSig = 1, 1.1, .. 7.9, NR = 4 FSig FSp Y. Okuda Basic Pitfalls in Waveform Analysis PyData Global 2020 talk-38
  27. Aliasing & Drops at near FNyq Discussion 27/ 33 Unremovable

    error signals ¬ Reject FSig ≥ FNyq by H/W filters  Co= 0, 0.1, 0.2, .., 0.9, FSig = 8.0, 8.5, 15.5, NR = 20 FSig FSp FNyq Drops FSp Spectrum Task2-Ex1 Y. Okuda Basic Pitfalls in Waveform Analysis PyData Global 2020 talk-38
  28. Waves are Noises or Signals Discussion 28/ 33 Amplitude Ratio

    RAmp := AmpFSig /Amp Task2-Ex1, high pass filter of 7kHz ¬ Highly destorted signals Amplitude abs RAmp Time Time Spectrum is a poor indicator of waveform amplitudes Waves with different amplitudes show the same spectrum amplitude FFT Y. Okuda Basic Pitfalls in Waveform Analysis PyData Global 2020 talk-38
  29. Basic H/W Requirements Discussion 29/ 33 MUST-1 Reject FSig ≥

    FNyq by – Mics or — Low-pass filters(LPFs) MUST-2 Apply ADCs with enough high FSR Option Reject FSig > Max-FSig If need – Mics or ™ digital LPFs, Not˜LPFs MaxFSig – Low-Pass Filter MaxFSig — ˜ ADC Low-Pass Filter ™ MaxFSig Y. Okuda Basic Pitfalls in Waveform Analysis PyData Global 2020 talk-38
  30. Low-Pass Filter Distortions Discussion 30/ 33 Phase Shifts of analogue

    low-pass filter(LPF) cause distortions Phase Shifts depend on Circuit & Frequency By Brews ohare ĸ FFT ¬ Spectrum + Phase Y. Okuda Basic Pitfalls in Waveform Analysis PyData Global 2020 talk-38
  31. Audio Recording Discussion 31/ 33 Low FSR standard 1982 CD(Compact

    Disc) FSR = 44.1 kHz ¬ Challenging at ’80 • Poor Human Hearing, Ear Frequency Curve 1984 PC-AT Intel 80286 clock= 6, 8 MHz 2003 Pro audio standard AES3: 88.2, 96, 176.4, 192 kHz Mics of up to 20kHz ¬ 90% FNyq of FSR = 44.1 kHz Ear Frequency Curve ¬ Voice recognition unique features Ear Gain FSigɀ ĸ Pre-emphasis Gammatone Spectrograms Cepstrum Mel Spectrogram MFCCs Chroma Y. Okuda Basic Pitfalls in Waveform Analysis PyData Global 2020 talk-38
  32. Conclusion 32/ 33 DEEPS demonstrated Existence of digitizing error at

    lower than FNyq sounds include distortions Indicated Apply FSR s obtained from Max FSig Max Error Feature error predictions Check Audio recording for Data Analysis Y. Okuda Basic Pitfalls in Waveform Analysis PyData Global 2020 talk-38