Upgrade to Pro — share decks privately, control downloads, hide ads and more …

rsample-sampler

FC
August 18, 2018
620

 rsample-sampler

FC

August 18, 2018
Tweet

Transcript

  1. File > New File > RScript library(tidyverse) library(tidymodels) Then load

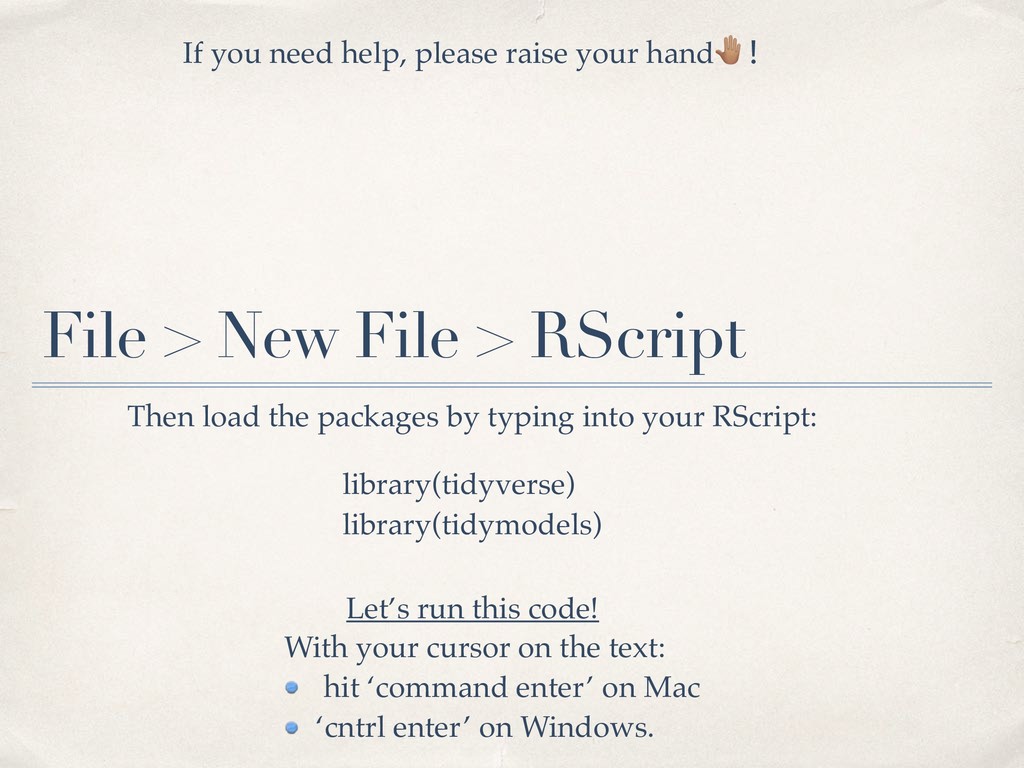
    the packages by typing into your RScript: If you need help, please raise your hand"! With your cursor on the text: hit ‘command enter’ on Mac ‘cntrl enter’ on Windows. Let’s run this code!
  2. >Whoami Introduced to STEM “This is cool but I’m terrified.”

    “You can do it!” “You should major in statistics.” startups differential privacy web security build & deploy models Intern
  3. Introducing Consistent model interfaces High and low-level APIs with practical

    defaults Suite of modular tools functional programming (purrr package) Chaining %>% Tidy data (2nd, 3rd Normal Form) Max Kuhn @topepo
  4. Functions & data structures specifically for resampling data Infrastructure to

    assess and validate model performance Easy to keep track of how your data is split https://tidymodels.github.io/rsample
  5. Recall: what is sampling? We can’t measure every person, place,

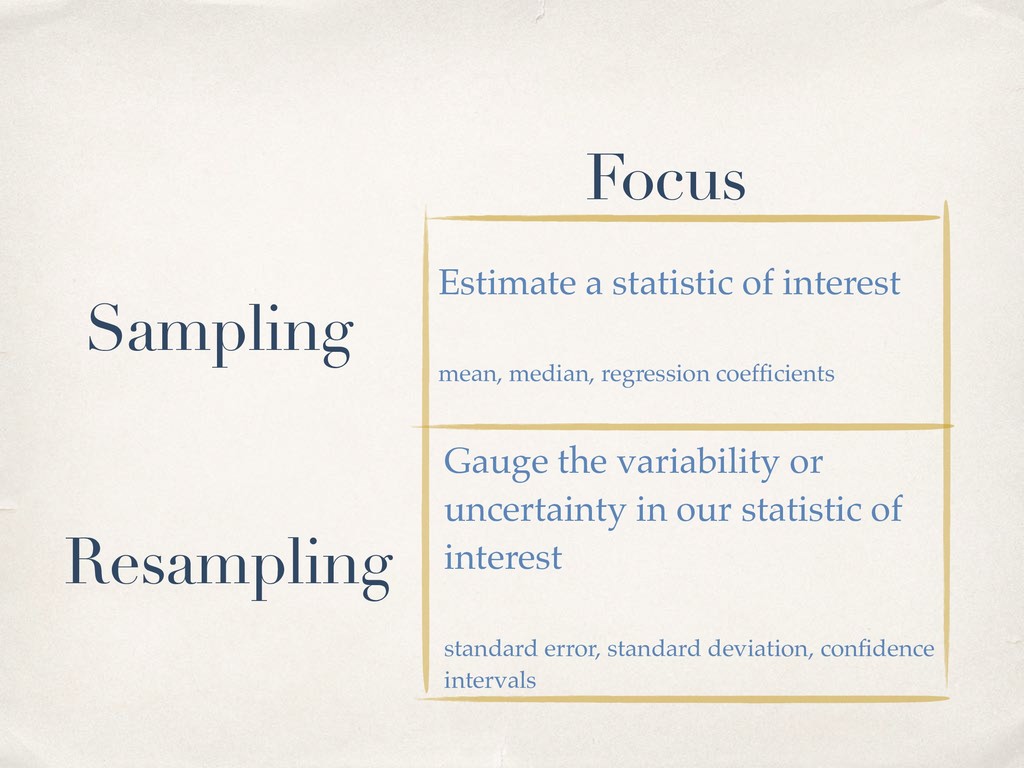
    or thing. So we randomly collect a sample that’s reasonably representative of the population we want to make inferences or predictions about. ✤ U.S. Census (American Community Survey) ✤ A/B test measuring click-through-rate on a sample of site visitors ✤ Risk of heart disease by race & ethnicity
  6. What’s resampling? Resampling is taking repeated samples from our data

    set. 
 “You randomly sample your random sample!”
  7. Sampling Resampling Estimate a statistic of interest mean, median, regression

    coefficients Gauge the variability or uncertainty in our statistic of interest standard error, standard deviation, confidence intervals Focus
  8. Initial Split into Test & Train We’ve only have so

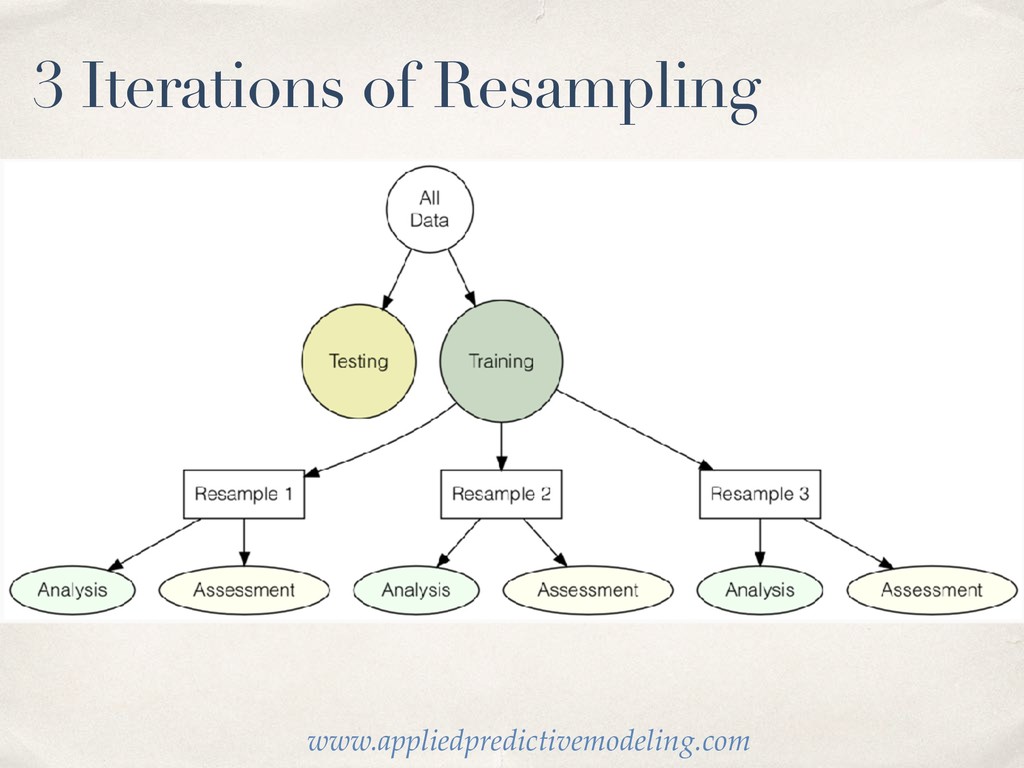
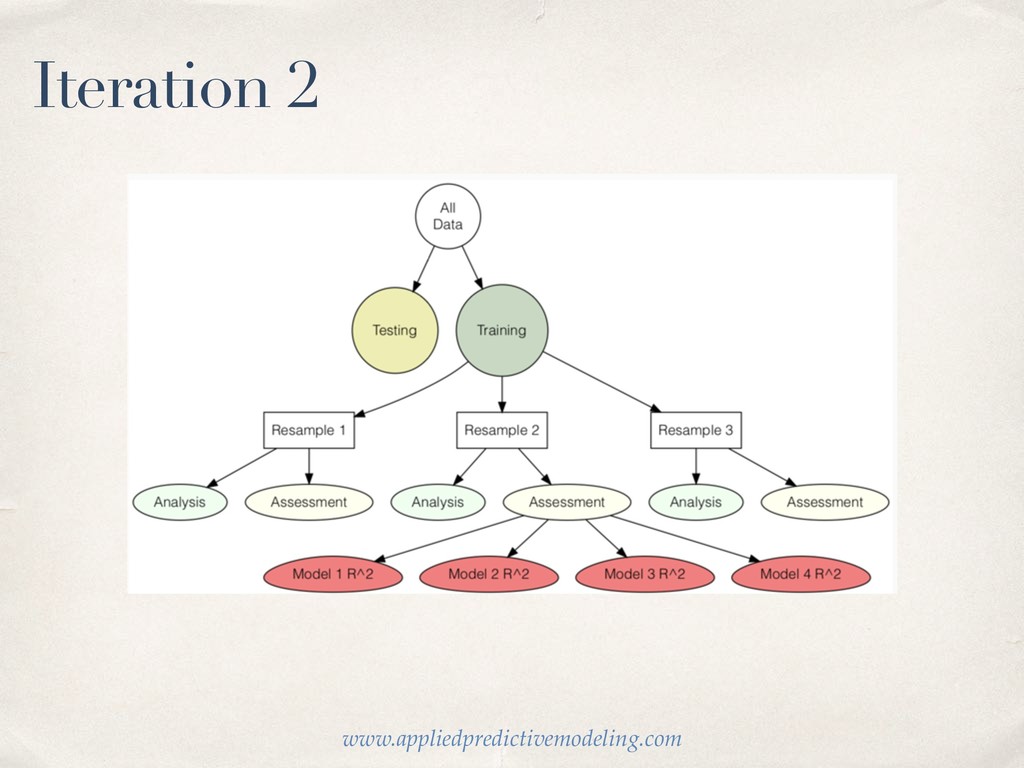
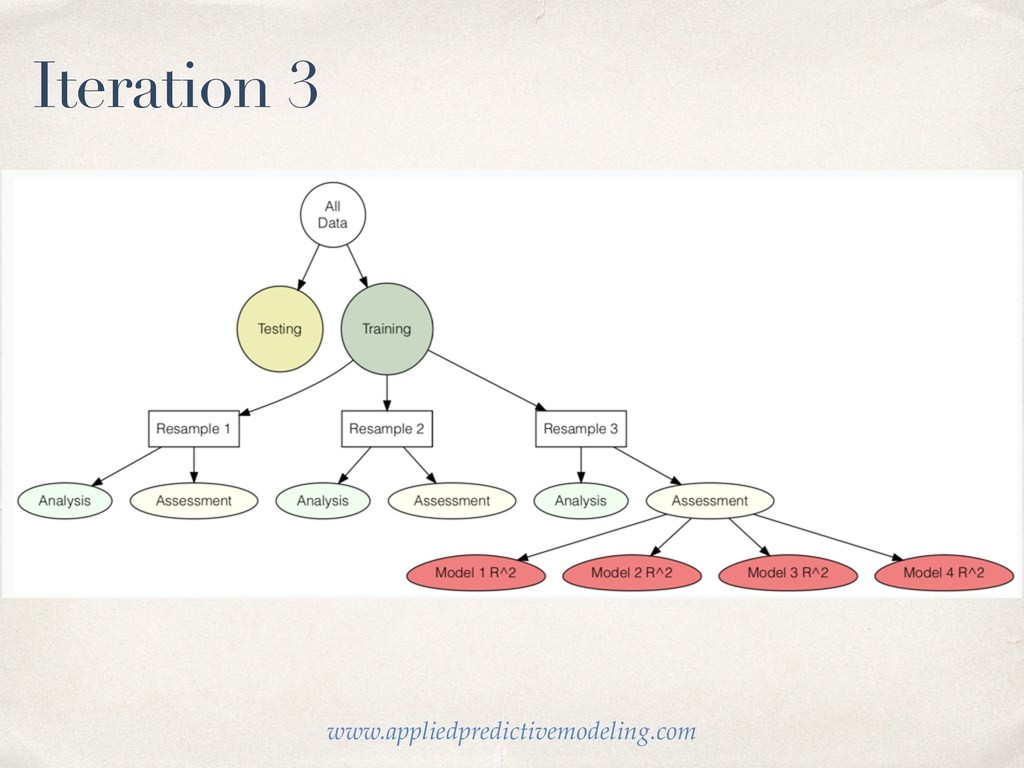
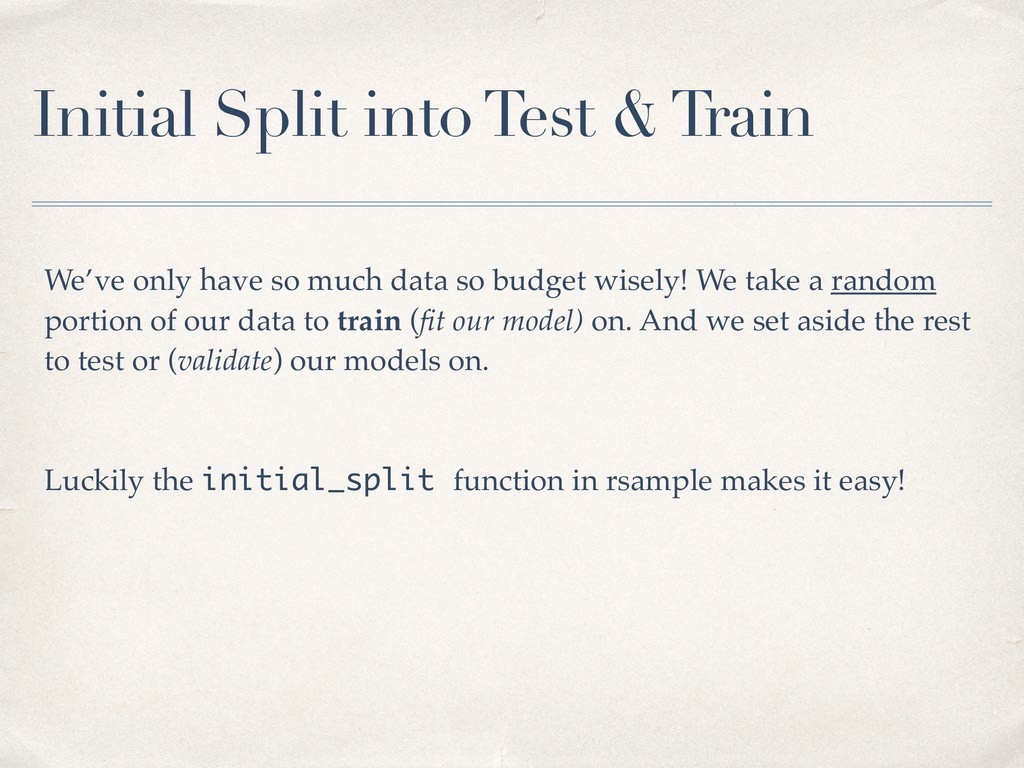
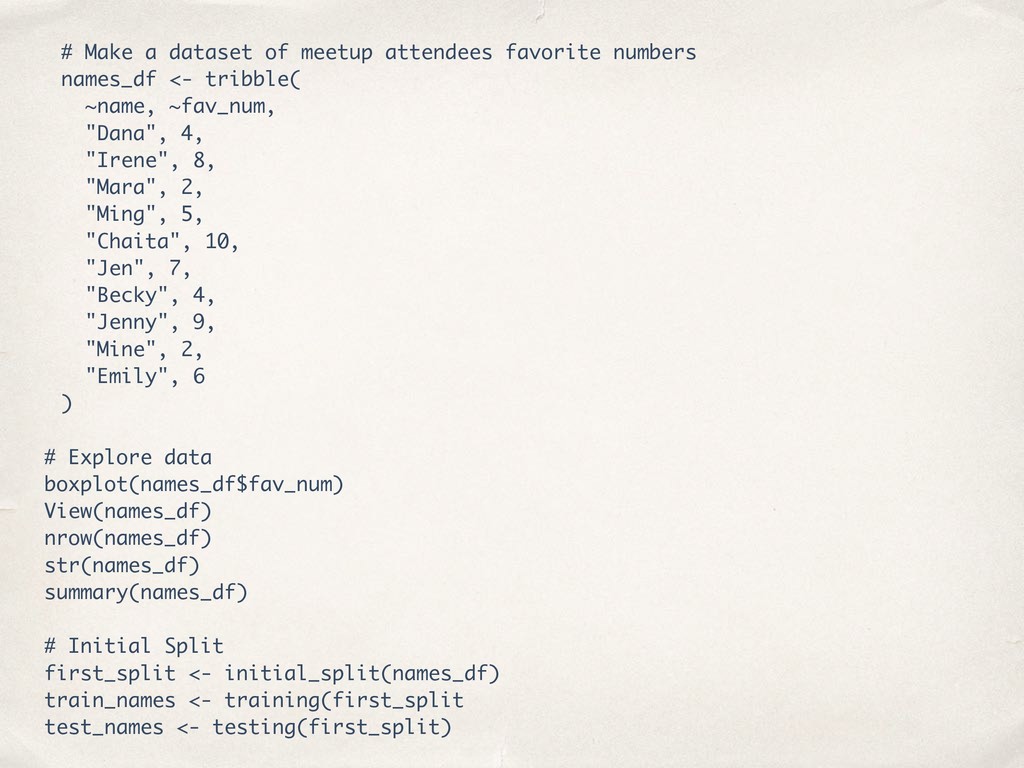
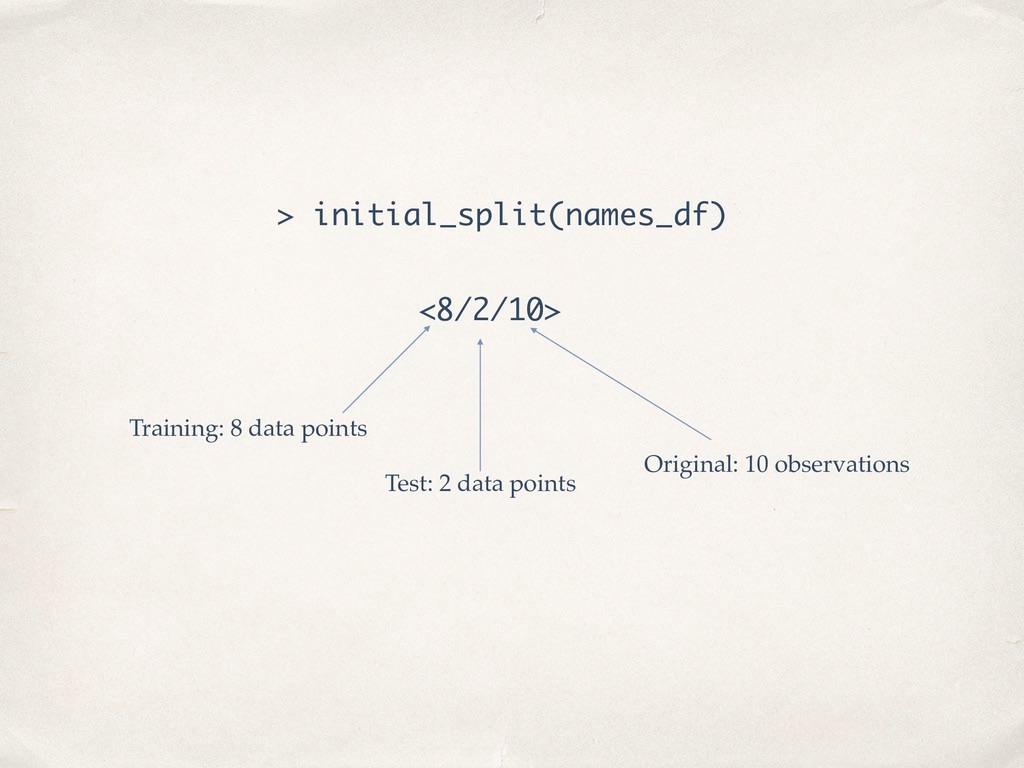
    much data so budget wisely! We take a random portion of our data to train (fit our model) on. And we set aside the rest to test or (validate) our models on. Luckily the initial_split function in rsample makes it easy!
  9. # Make a dataset of meetup attendees favorite numbers names_df

    <- tribble( ~name, ~fav_num, "Dana", 4, "Irene", 8, "Mara", 2, "Ming", 5, "Chaita", 10, "Jen", 7, "Becky", 4, "Jenny", 9, "Mine", 2, "Emily", 6 ) # Explore data boxplot(names_df$fav_num) View(names_df) nrow(names_df) str(names_df) summary(names_df) # Initial Split first_split <- initial_split(names_df) train_names <- training(first_split test_names <- testing(first_split)
  10. > training(names_df) # A tibble: 8 x 2 name fav_num

    <chr> <dbl> 1 Dana 4 2 Irene 8 3 Mara 2 4 Chaita 10 5 Jen 7 6 Jenny 9 7 Mine 2 8 Emily 6
  11. Start a new script and try initial_split on a different

    data set. This time let’s use the attrition data set within the rsample package. Let’s load the data by typing: data(“attrition”)
  12. Let’s try vfold_cv() vfold_cv(data, v = 10, repeats = 1,

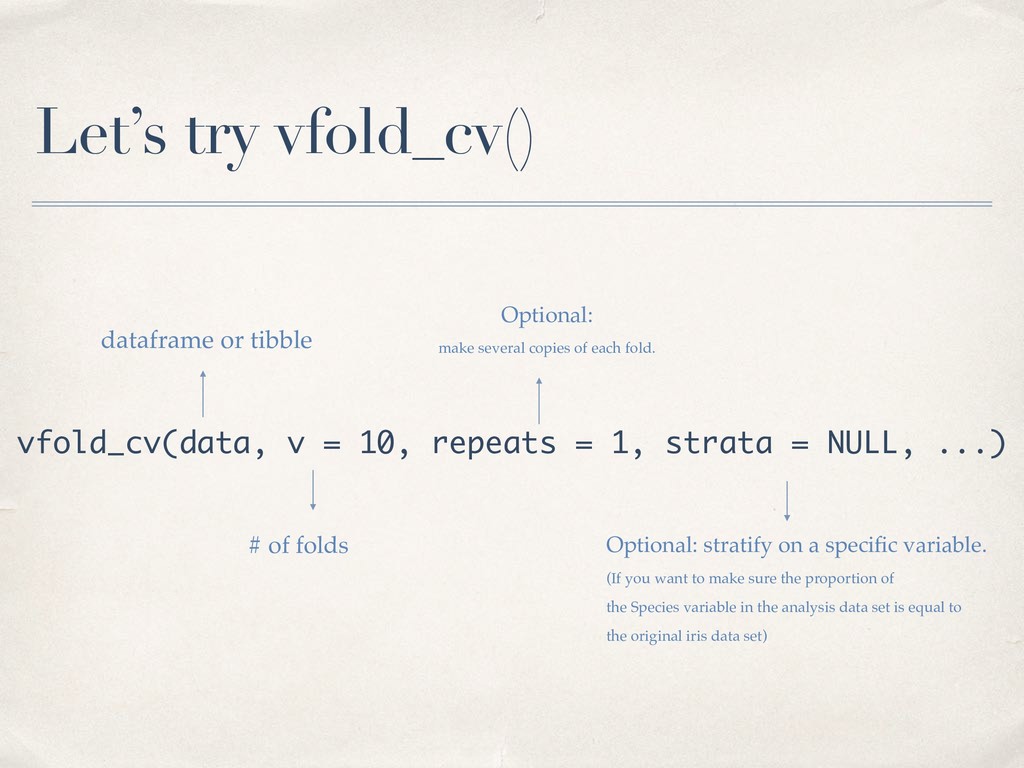
    strata = NULL, ...) dataframe or tibble # of folds Optional: make several copies of each fold. Optional: stratify on a specific variable. (If you want to make sure the proportion of the Species variable in the analysis data set is equal to the original iris data set)
  13. Let’s try vfold_cv() ✤ We will get a rset object

    ✤ Which contains many resamples ✤ Each resample is an rsplit object It’s easier to understand when we see it in action. Let’s try.
  14. my_folds <- vfold_cv(train_names, v=3) my_folds # The `split` objects contain

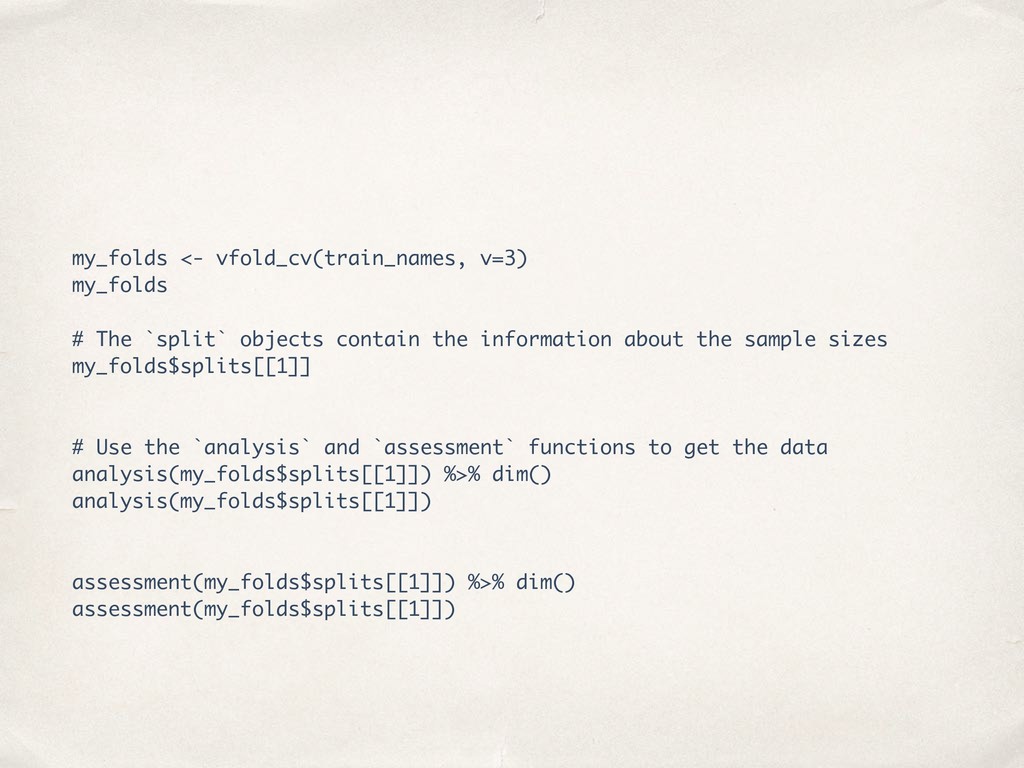
    the information about the sample sizes my_folds$splits[[1]] # Use the `analysis` and `assessment` functions to get the data analysis(my_folds$splits[[1]]) %>% dim() analysis(my_folds$splits[[1]]) assessment(my_folds$splits[[1]]) %>% dim() assessment(my_folds$splits[[1]])
  15. ✤ Great! We have many tidy resamples! ✤ We can

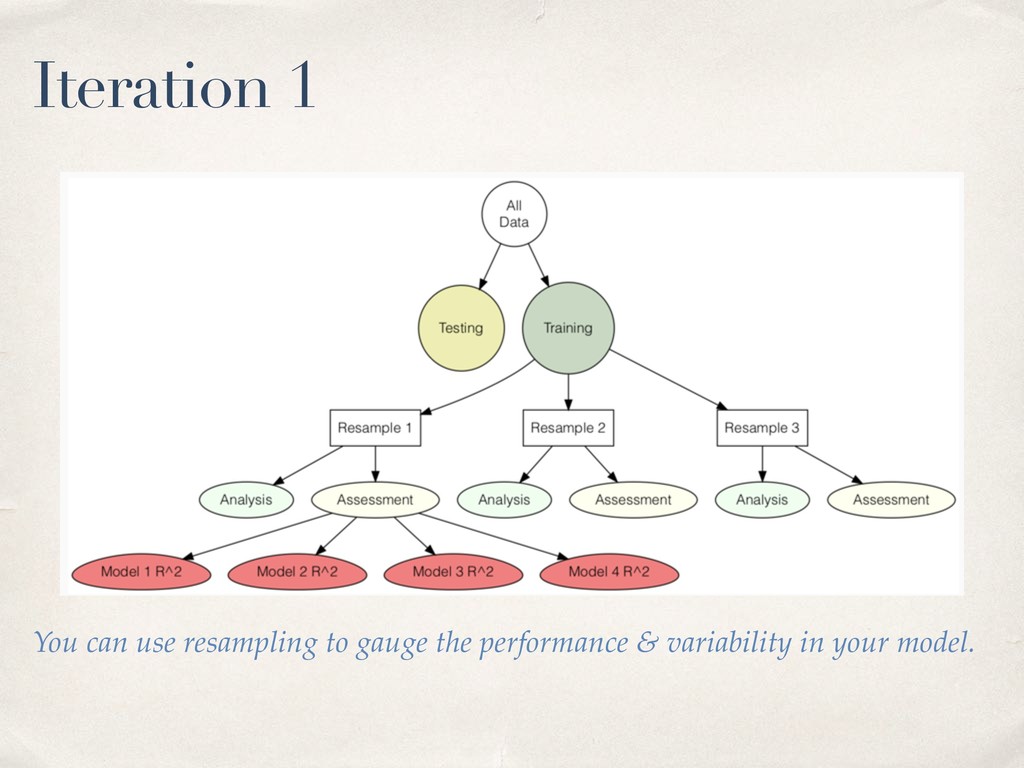
    use functional programming functions from the purr package to fit a model on each resample. ✤ For the sake of information overload, let’s save that for next time .
  16. Bootstrapping ✤ resampling with replacement ✤ (all values in the

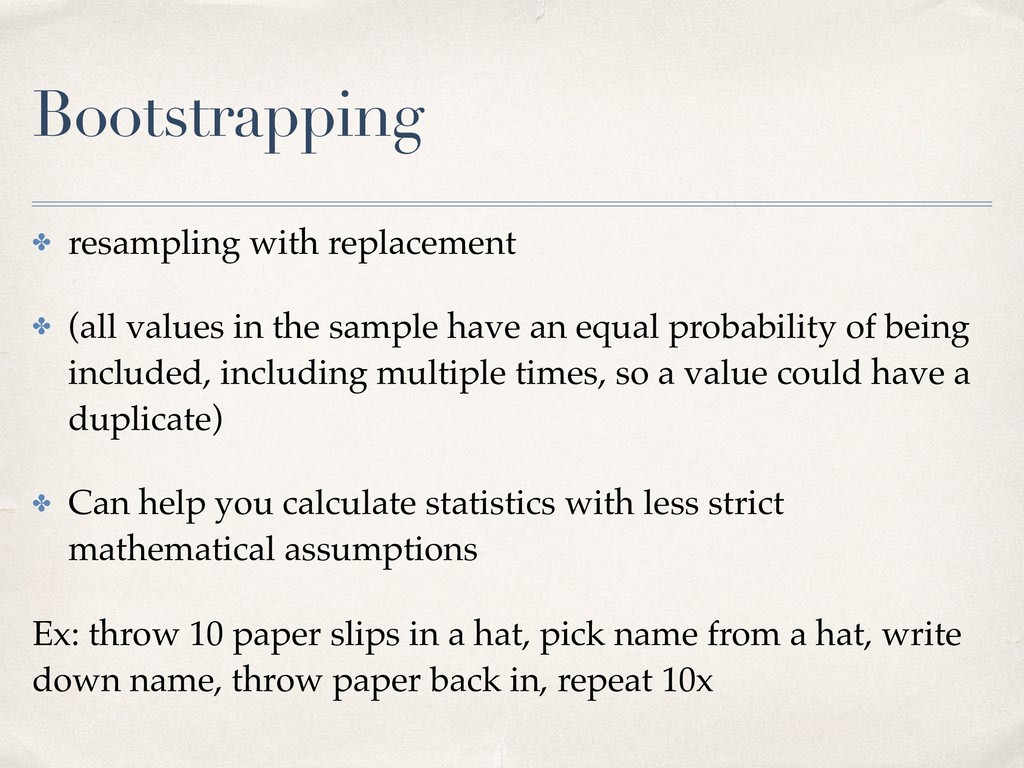
    sample have an equal probability of being included, including multiple times, so a value could have a duplicate) ✤ Can help you calculate statistics with less strict mathematical assumptions Ex: throw 10 paper slips in a hat, pick name from a hat, write down name, throw paper back in, repeat 10x
  17. ✤ Bootstrapping is usually used to help us make sense

    of the distribution of a statistic of interest. ✤ But we can also use bootstrapping to perform inference too.
  18. Bootstraps function bootstraps(data, times = 25, strata = NULL, apparent

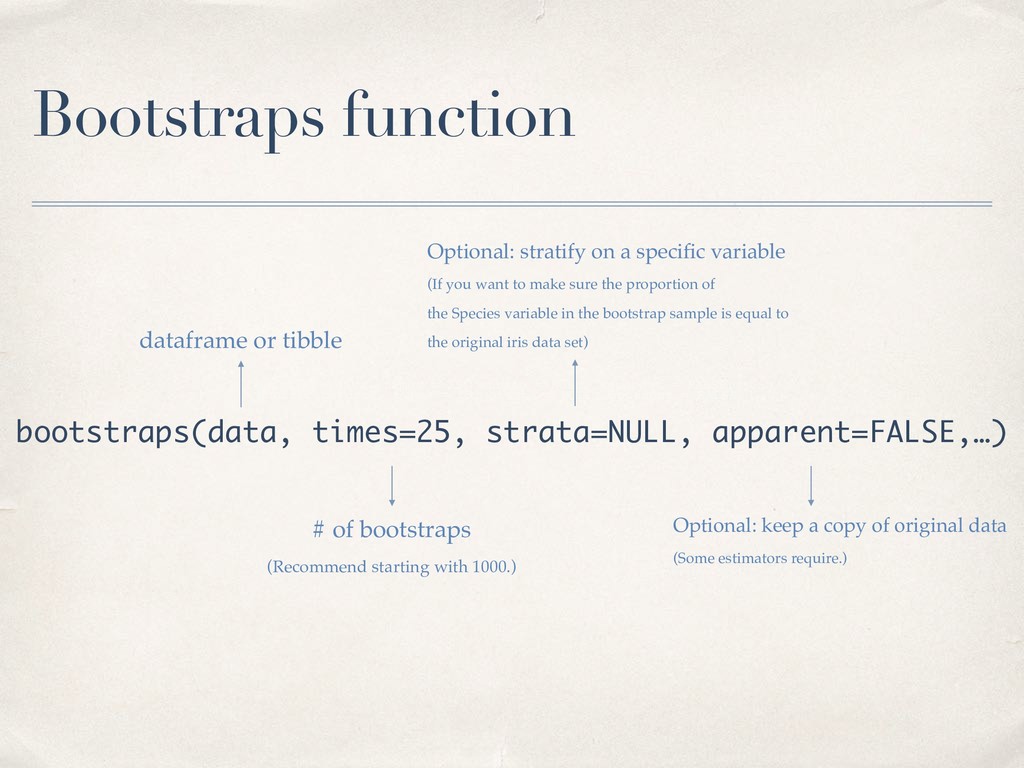
    = FALSE, ...) bootstraps(data, times = 25, strata = NULL, apparent = FALSE, ...) bootstraps(data, times=25, strata=NULL, apparent=FALSE,…) dataframe or tibble # of bootstraps (Recommend starting with 1000.) Optional: stratify on a specific variable (If you want to make sure the proportion of the Species variable in the bootstrap sample is equal to the original iris data set) Optional: keep a copy of original data (Some estimators require.)
  19. Take a look at one of the bootstraps many_boots<- bootstraps(attrition)

    one_boot <- many_boots[[1]] analysis(one_boots) assessment(one_boots)
  20. Let’s say we wanted to see if there’s a marked

    difference between median income for men and women. An example from Max’s rsample vignette
  21. Live demo (still in dev mode, sit back and relax

    ) www.github.com/fbchow/rsample