Upgrade to Pro — share decks privately, control downloads, hide ads and more …

Application Performance Optimisation in Practic...

Application Performance Optimisation in Practice (60 mins)

Slides from my session:

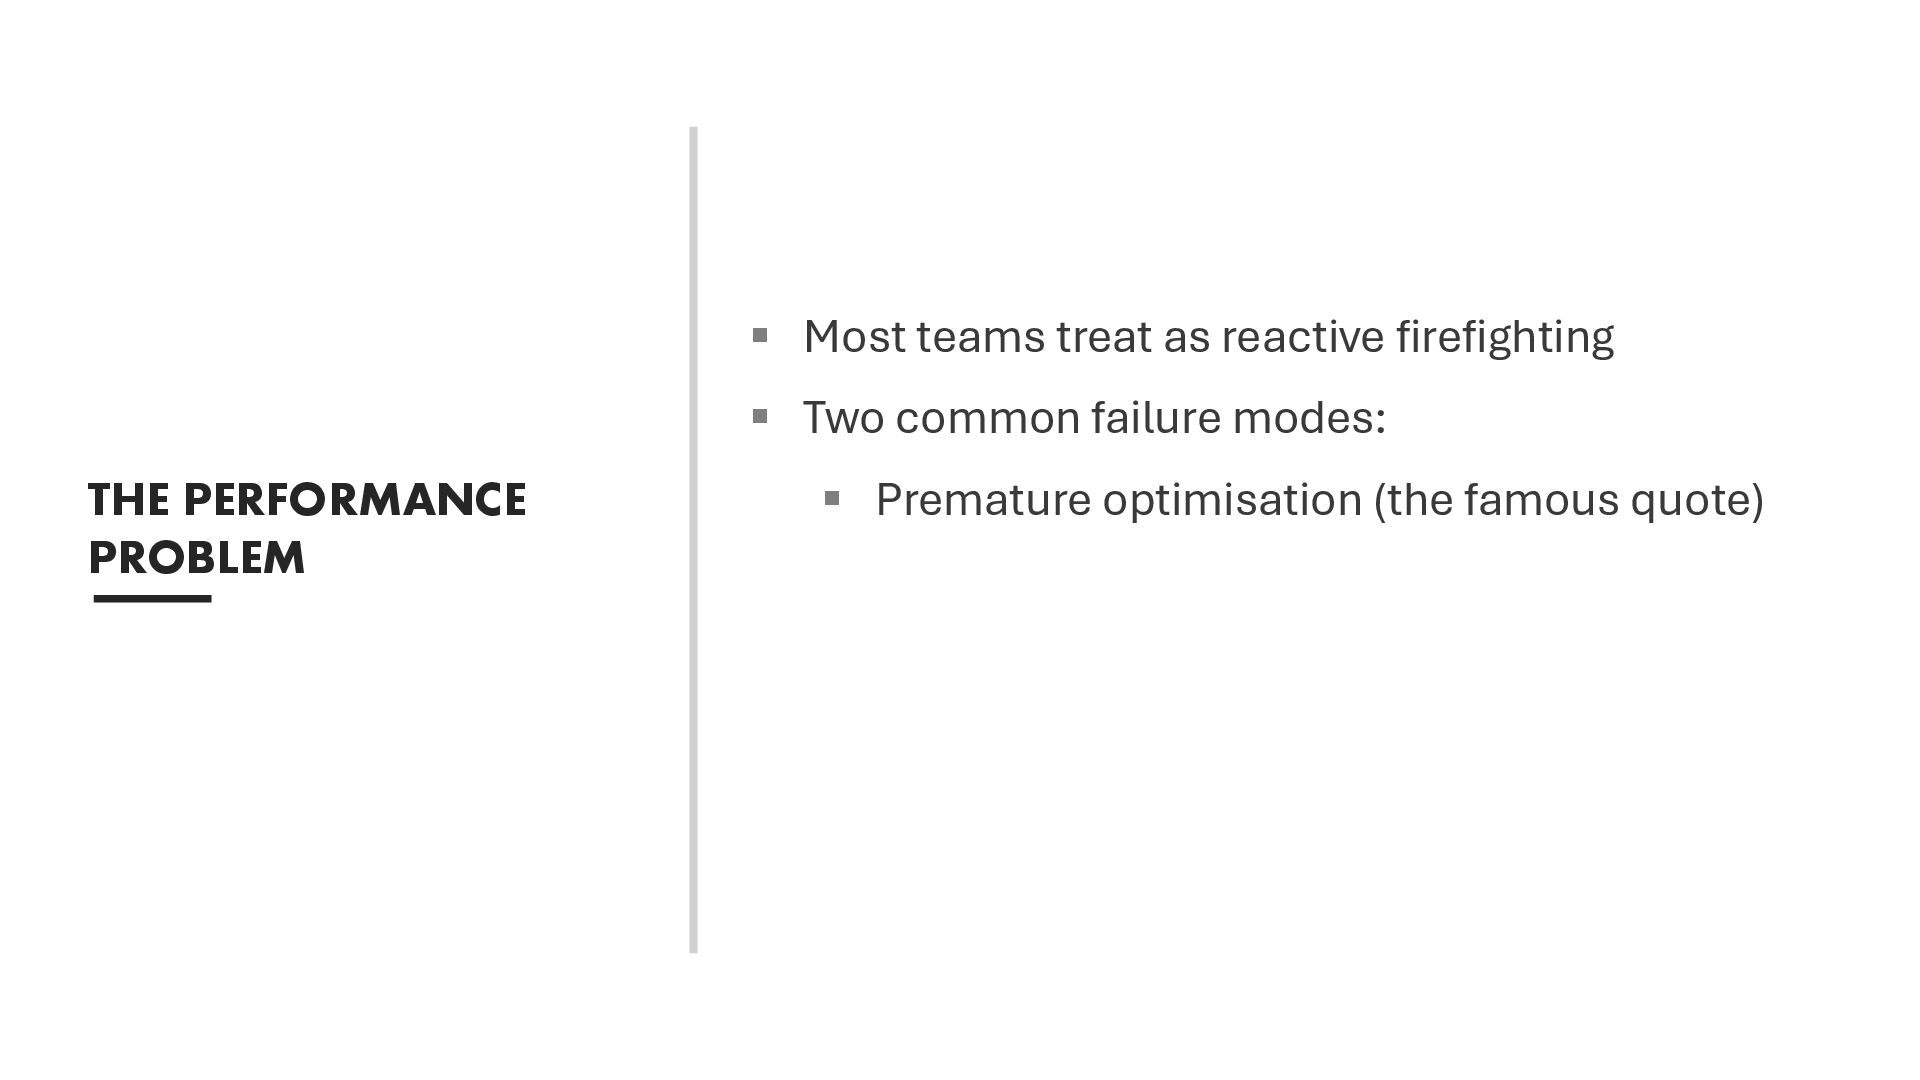
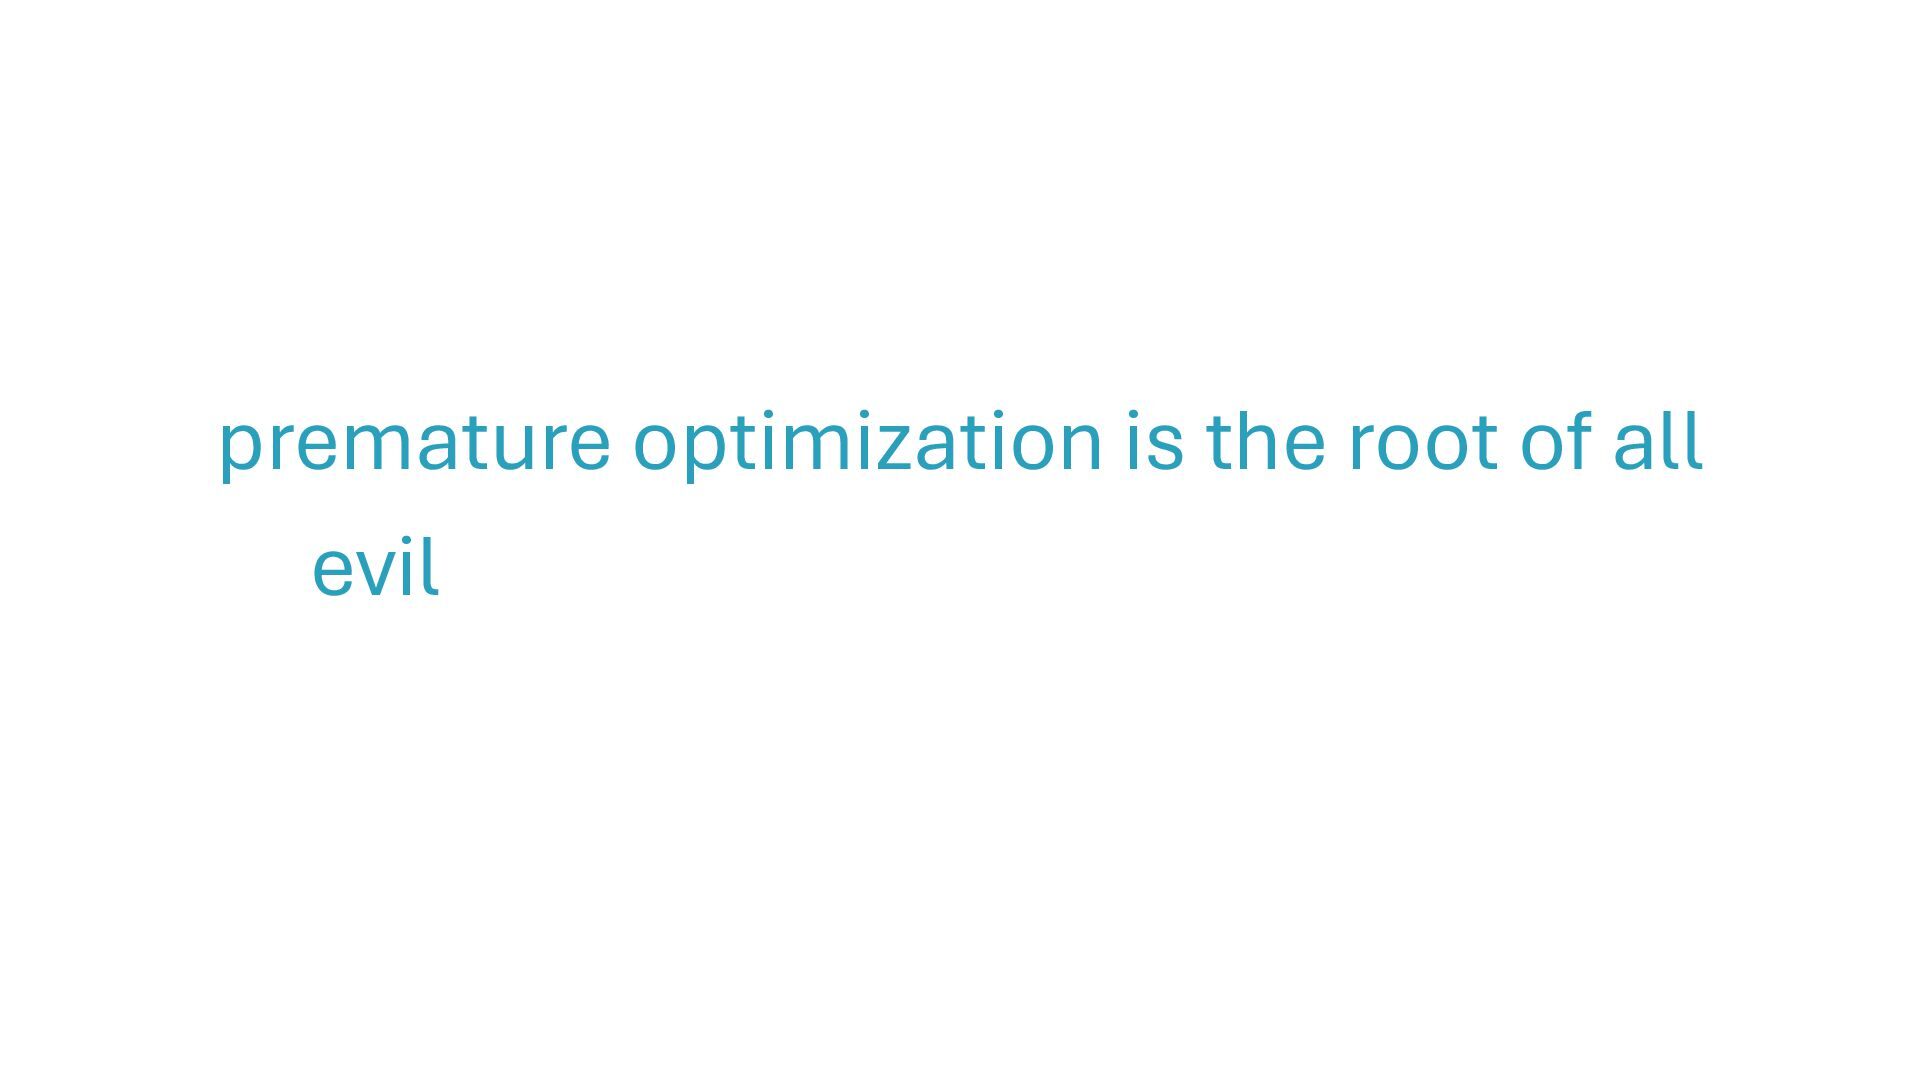
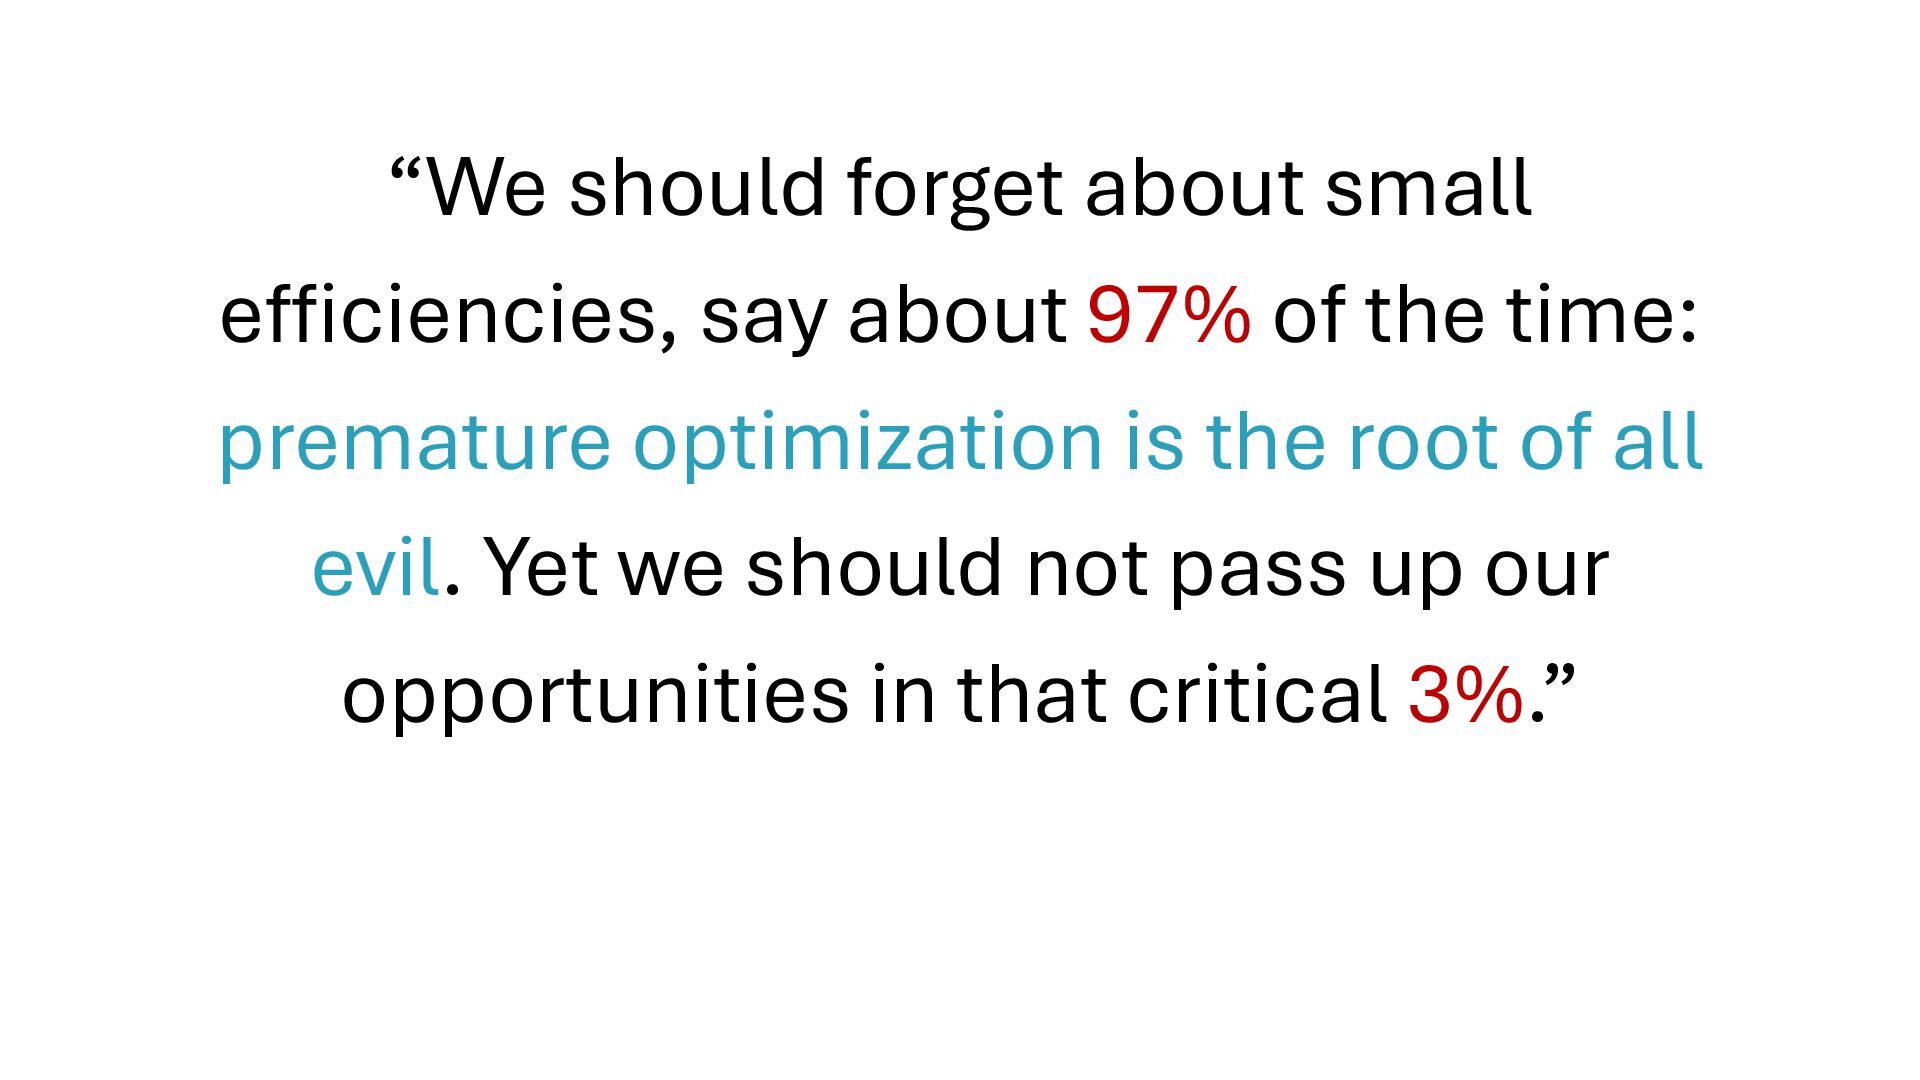
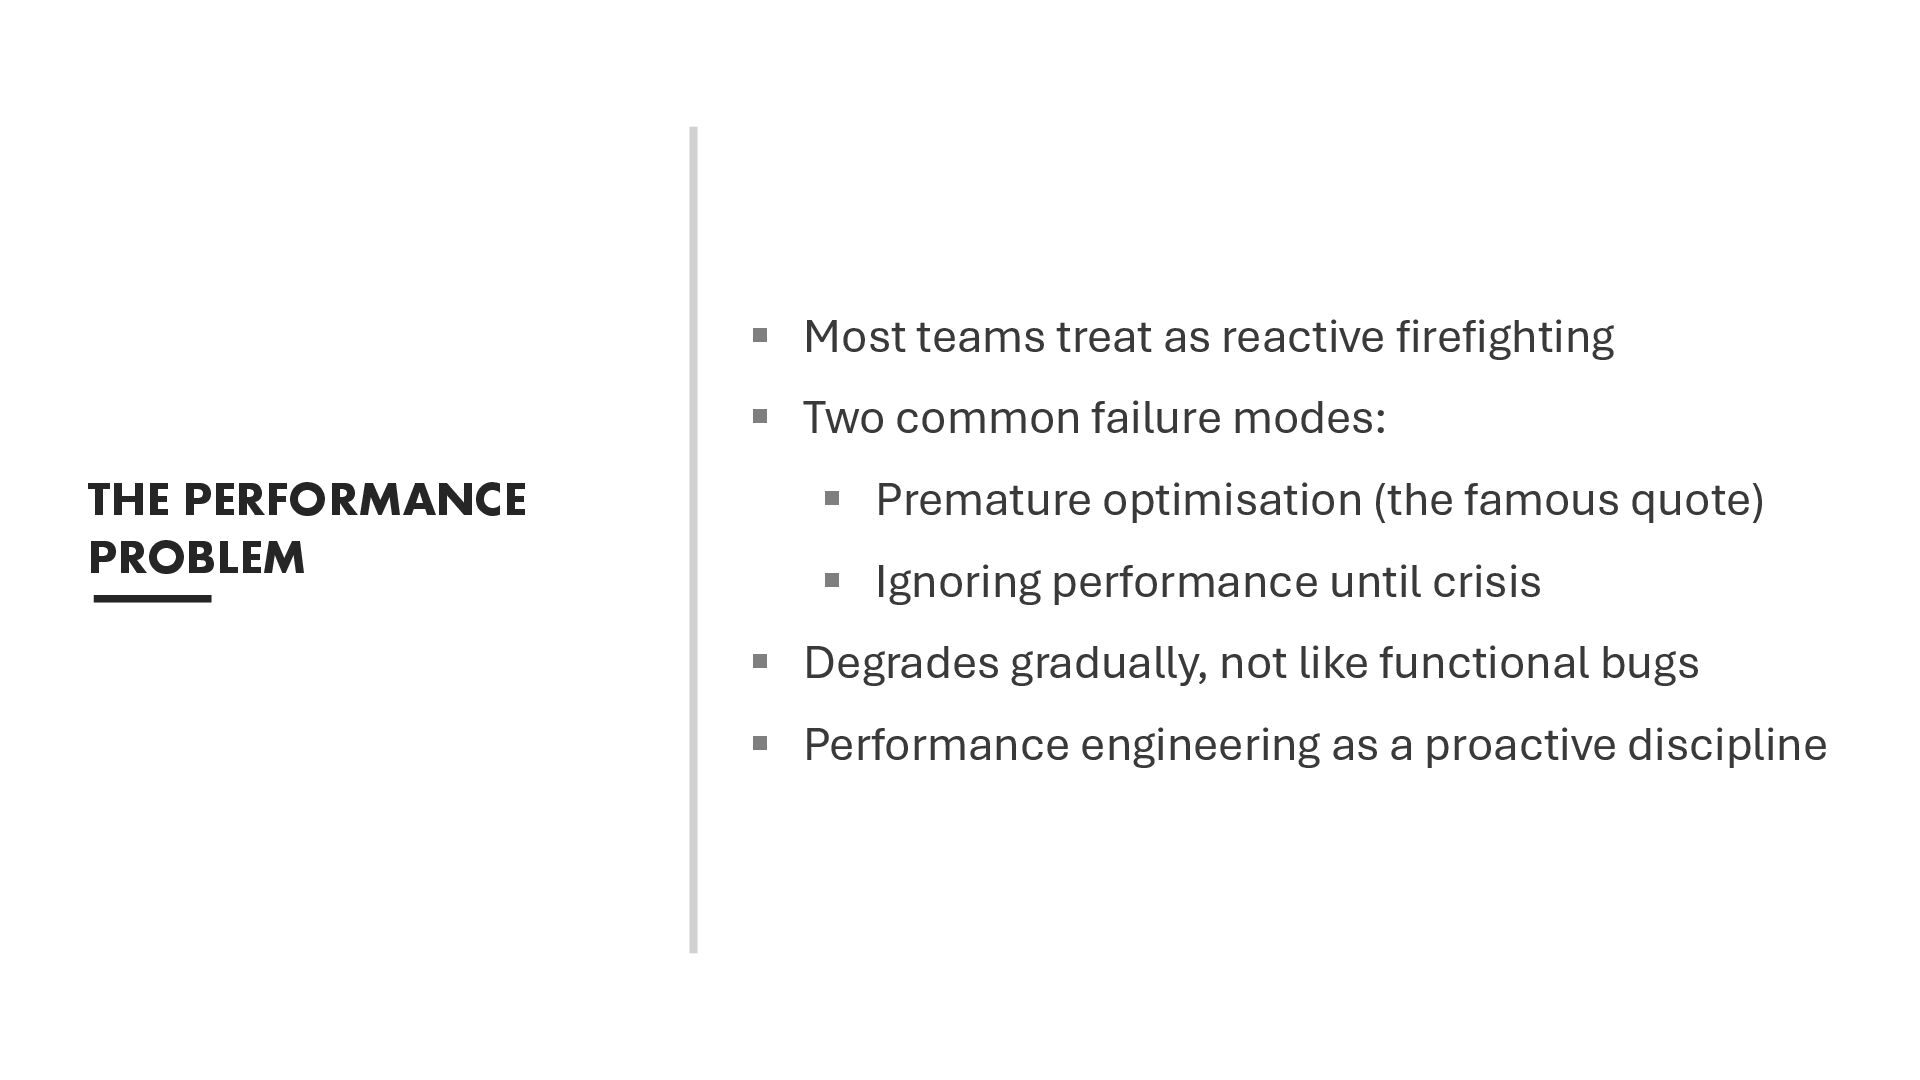
Application performance always matters. Sometimes critically, sometimes subtly, but it’s never irrelevant. While many developers rightly caution that “premature optimisation is the root of all evil,” the opposite mistake, ignoring performance until it becomes a serious issue, can be just as problematic.

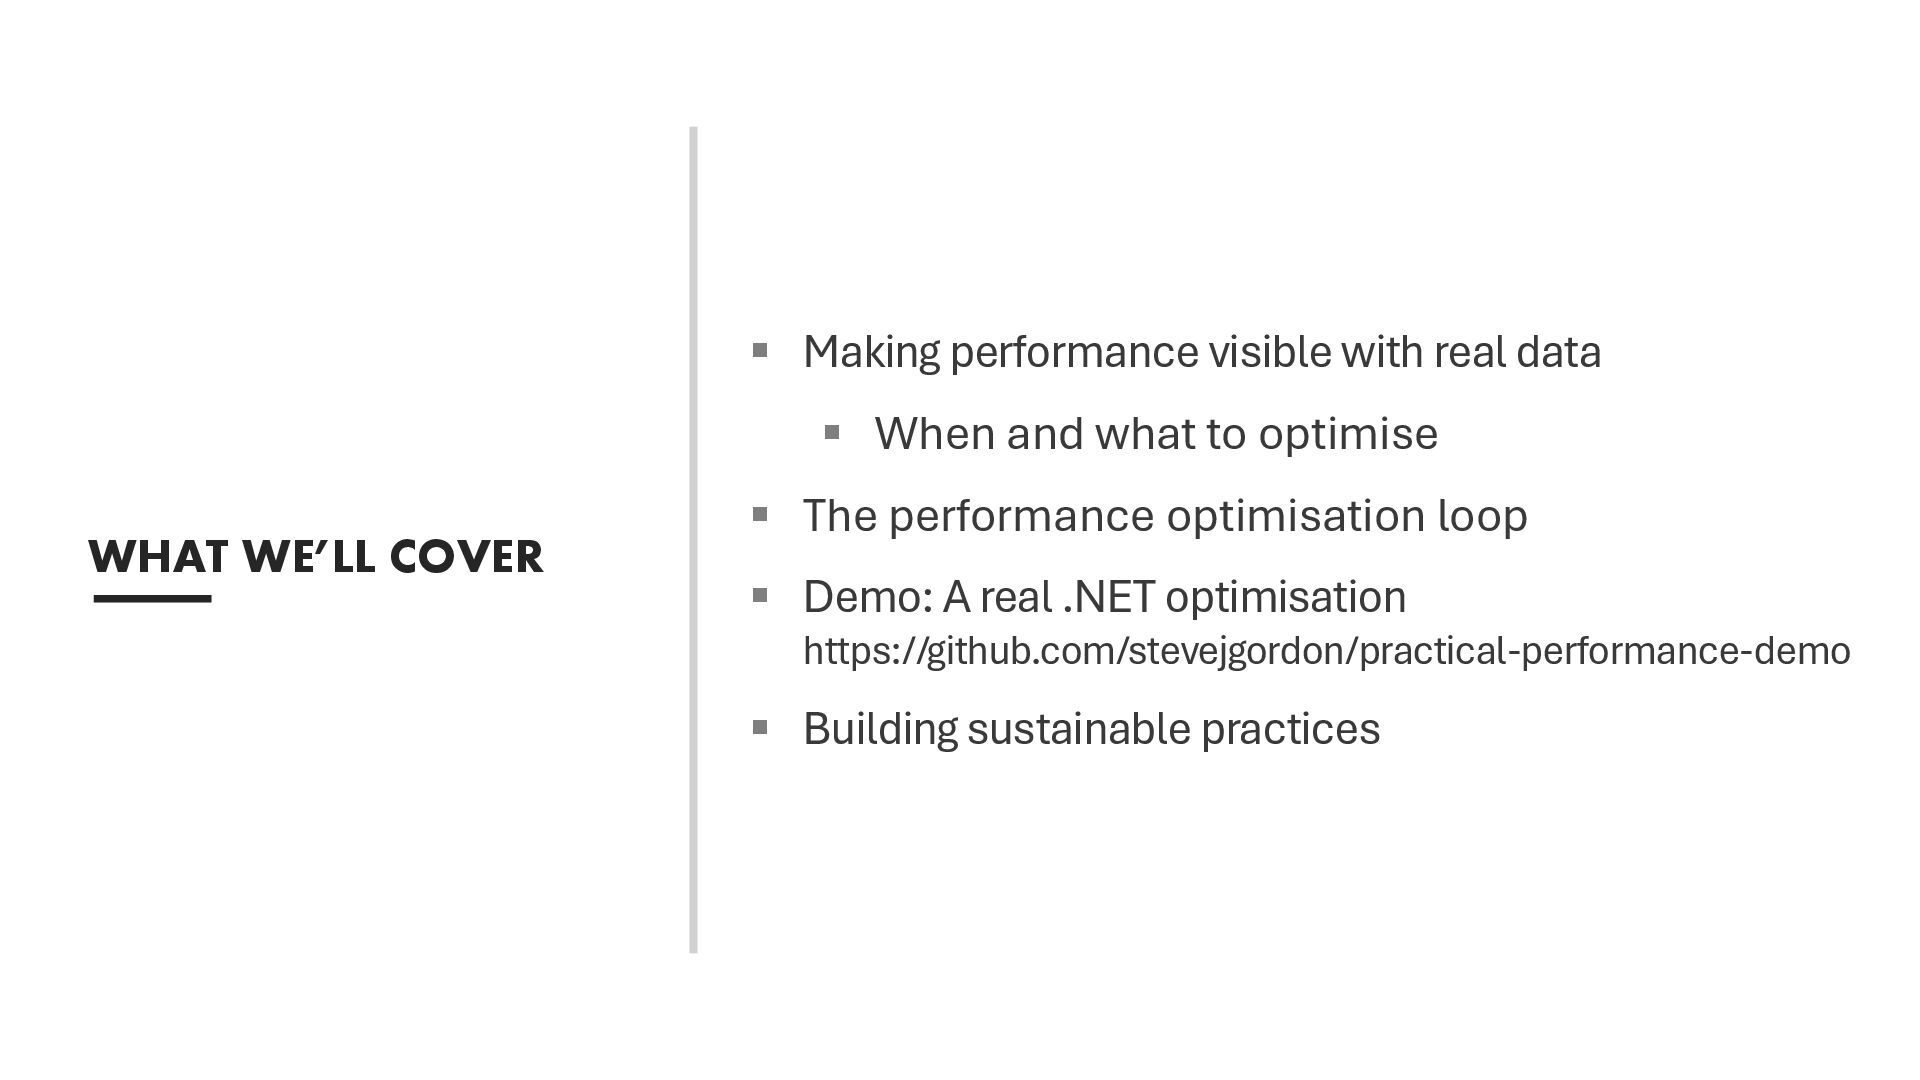
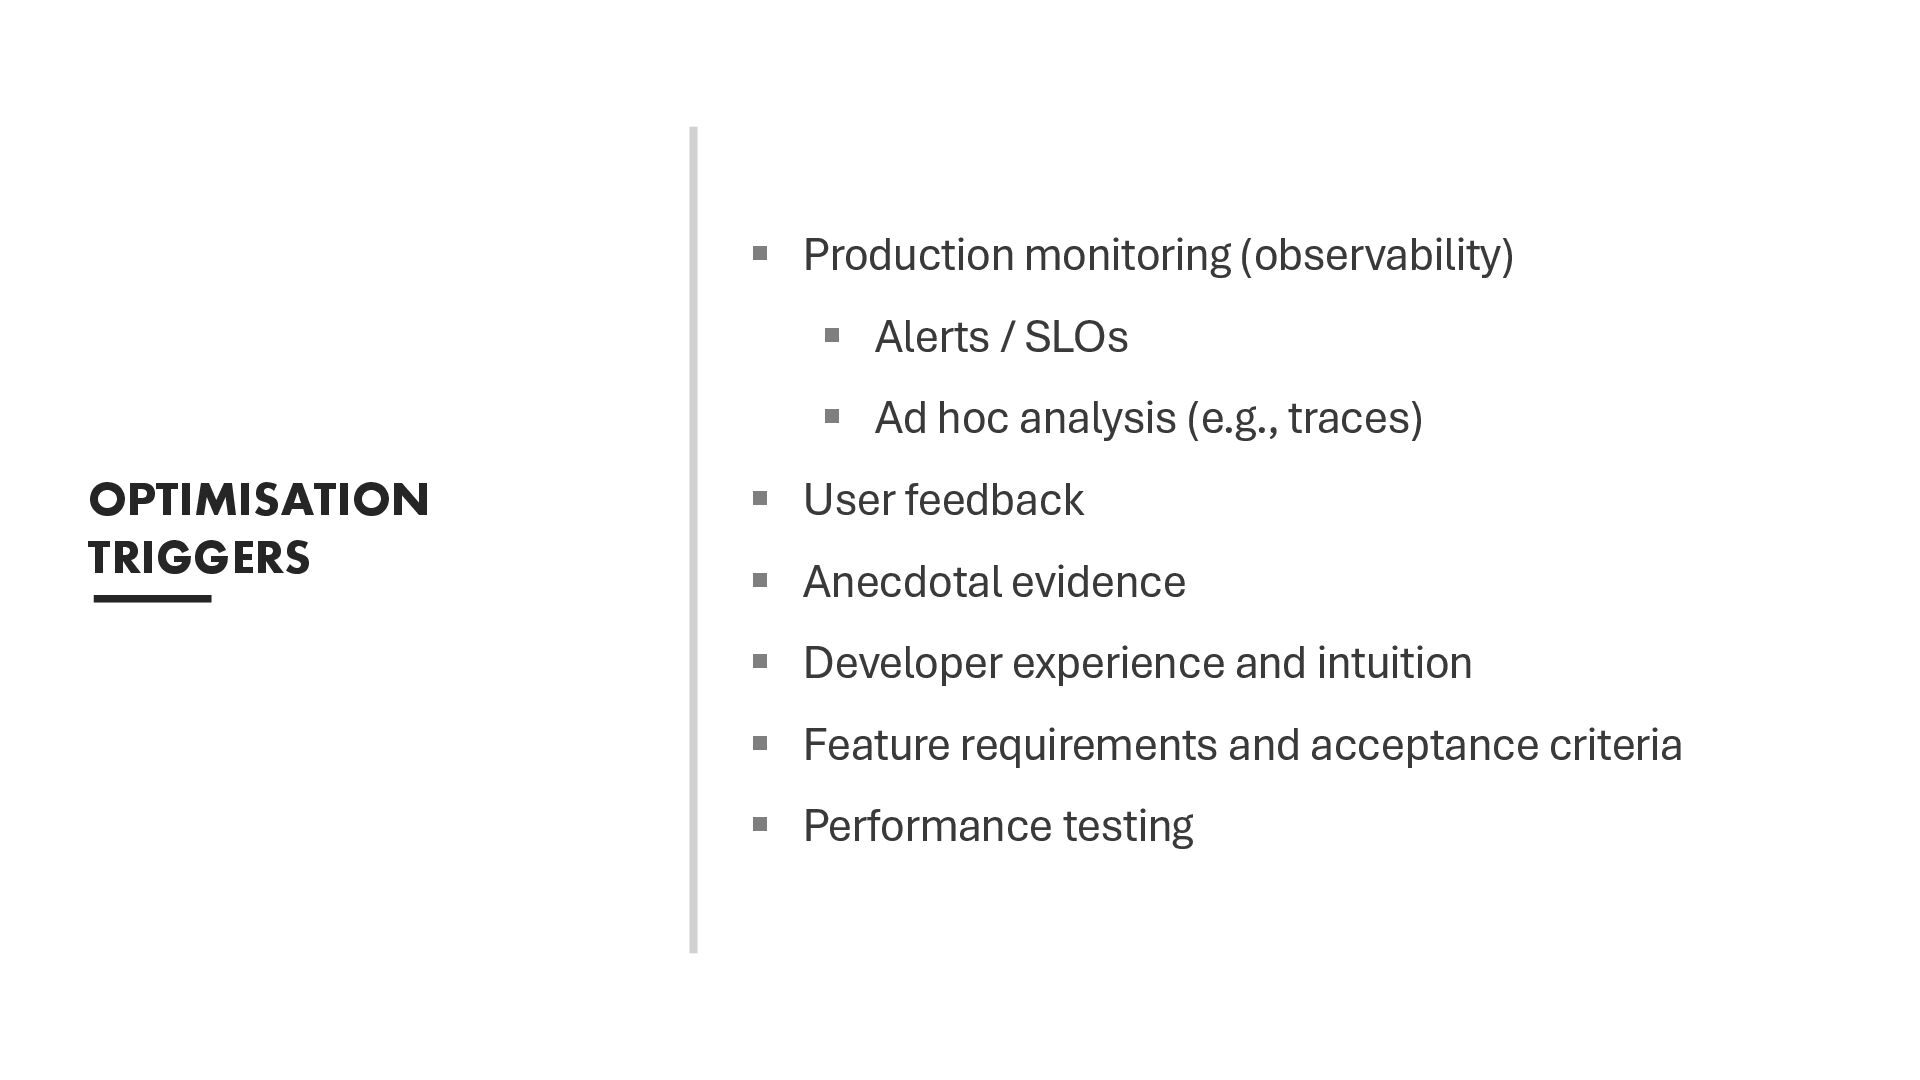
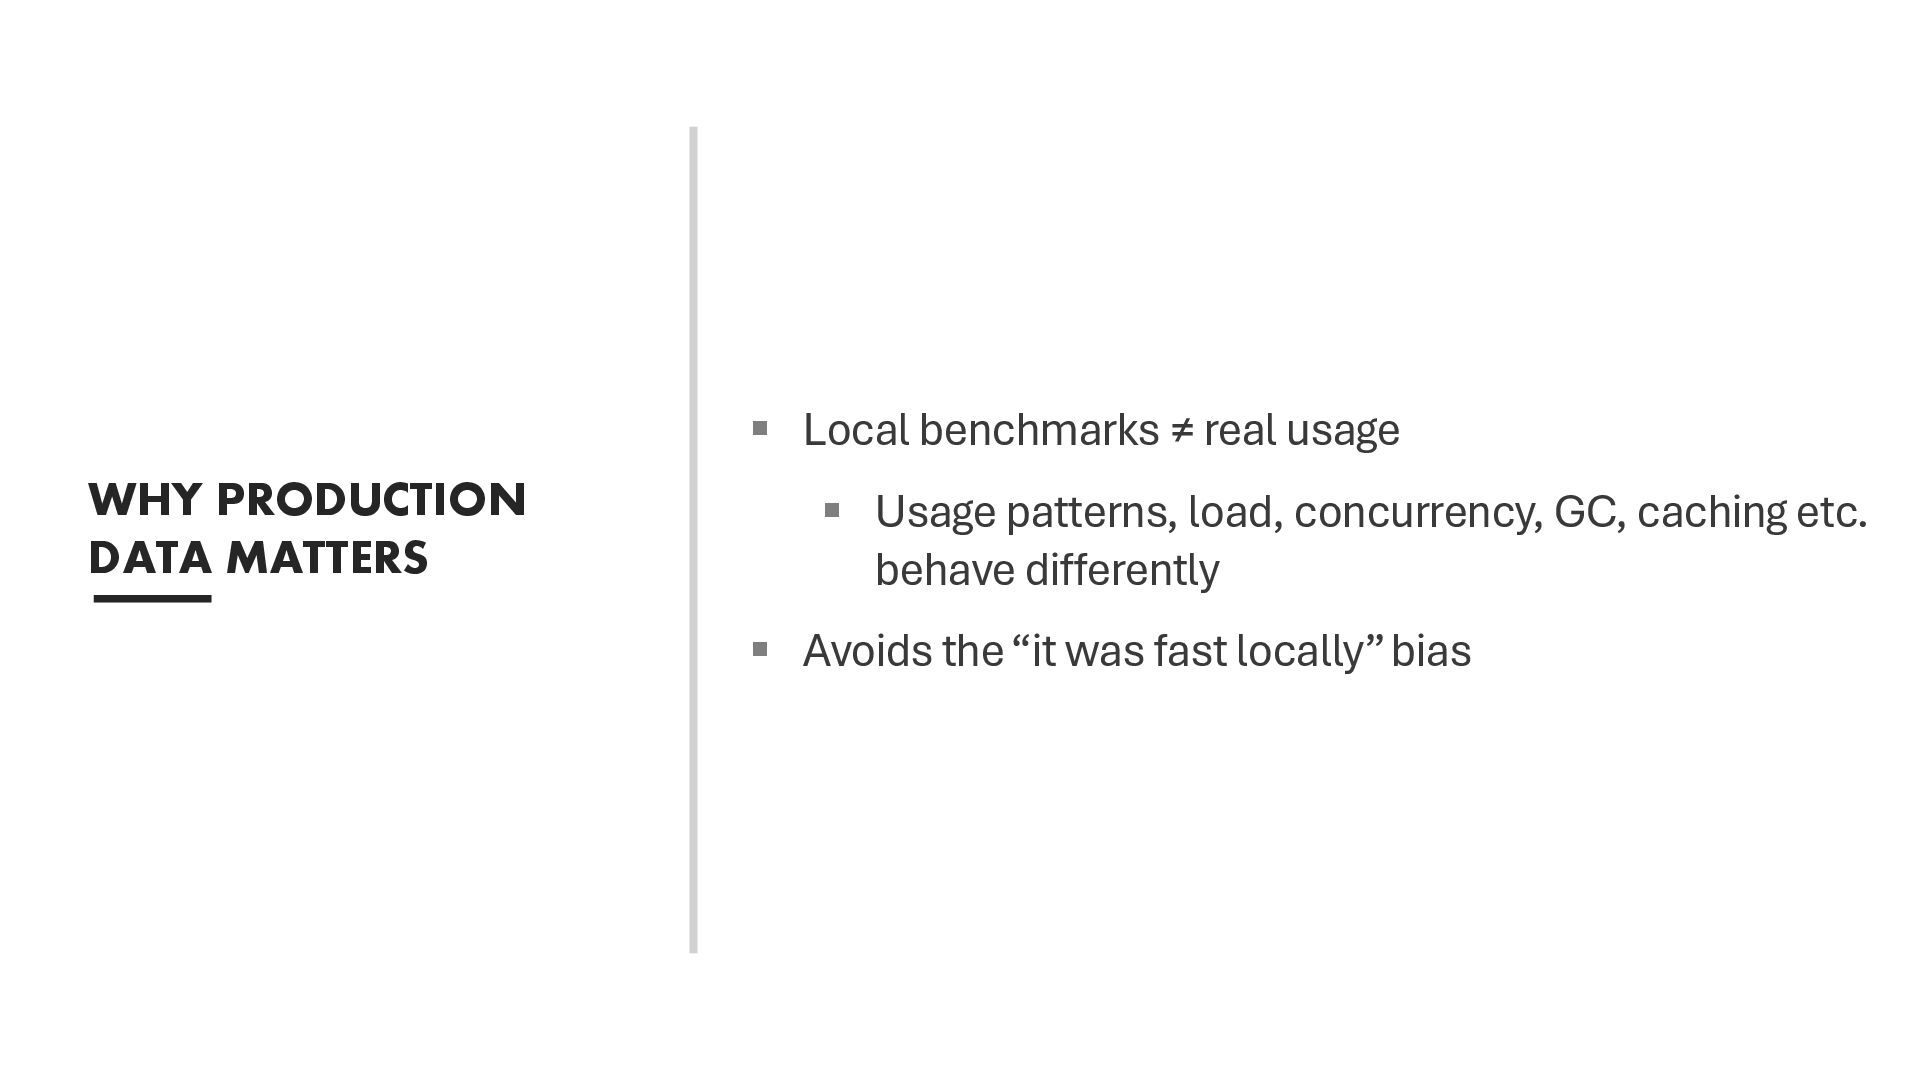
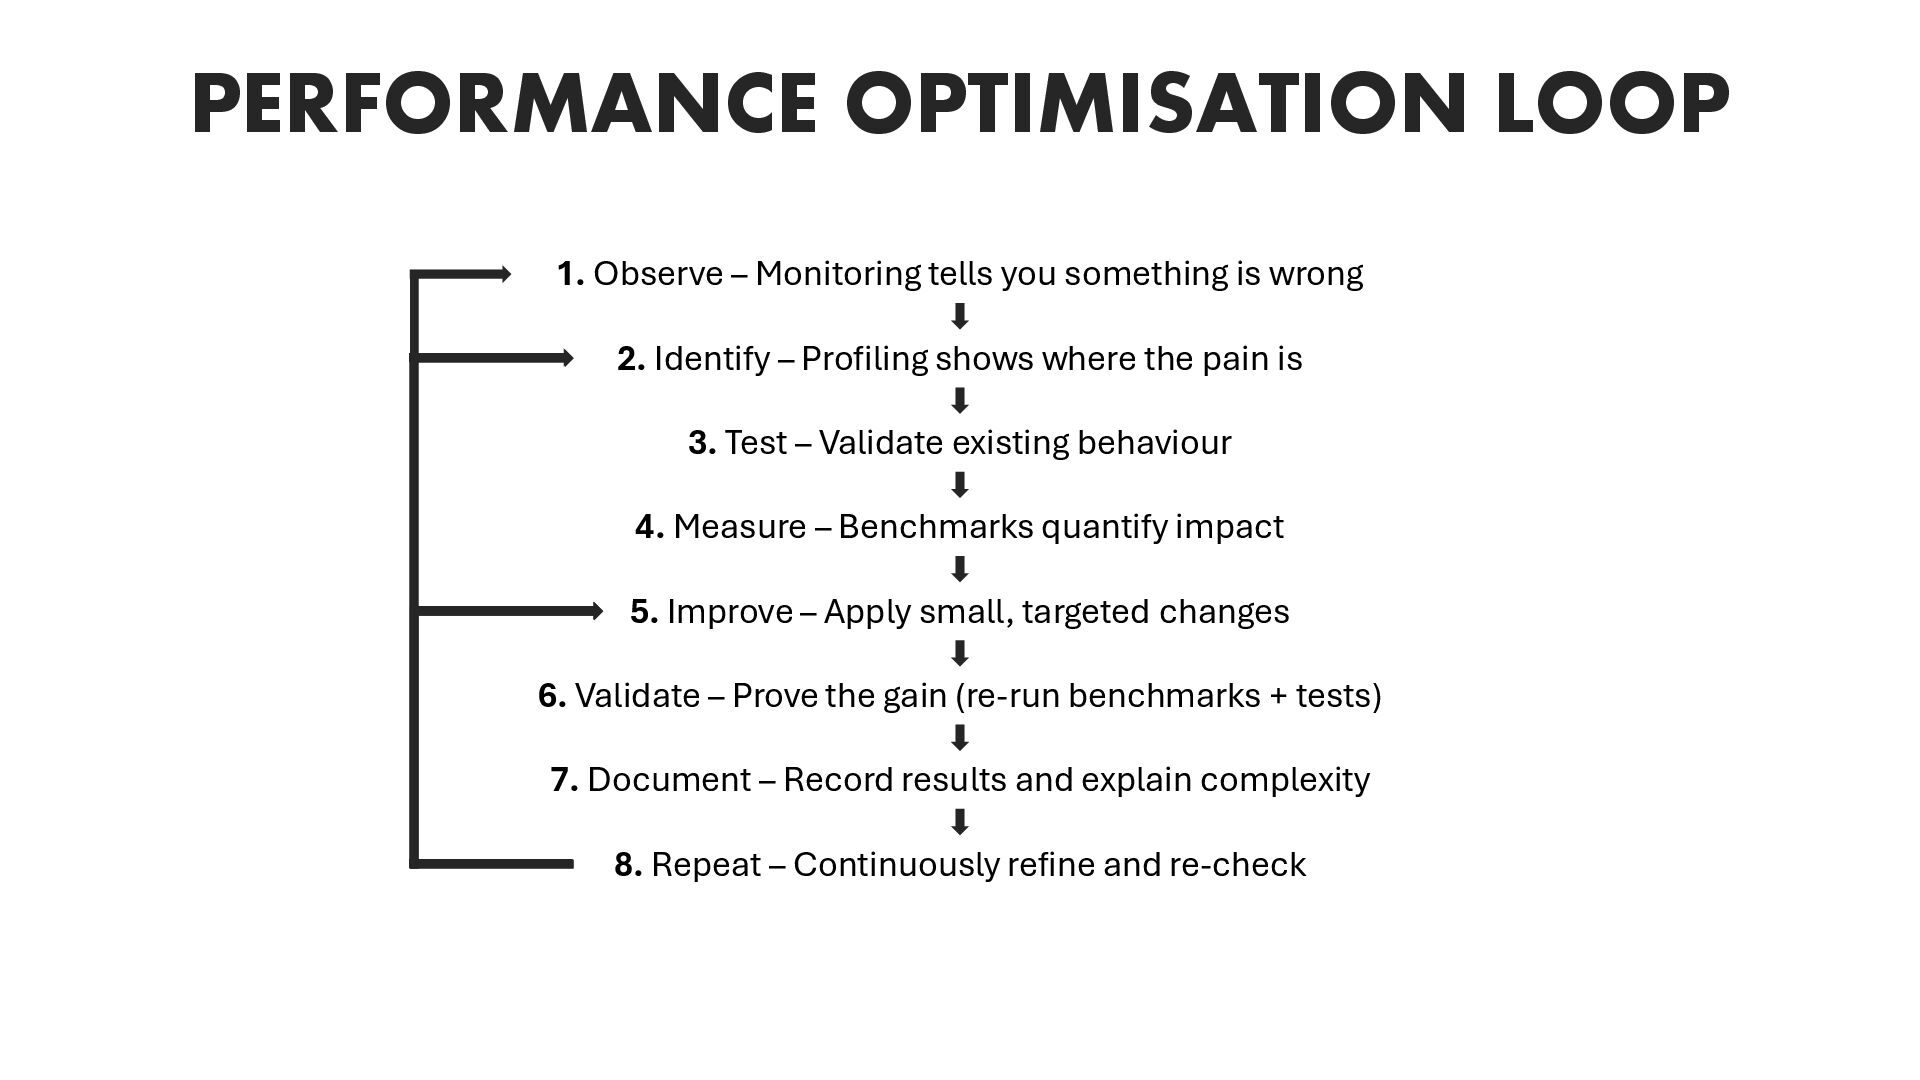
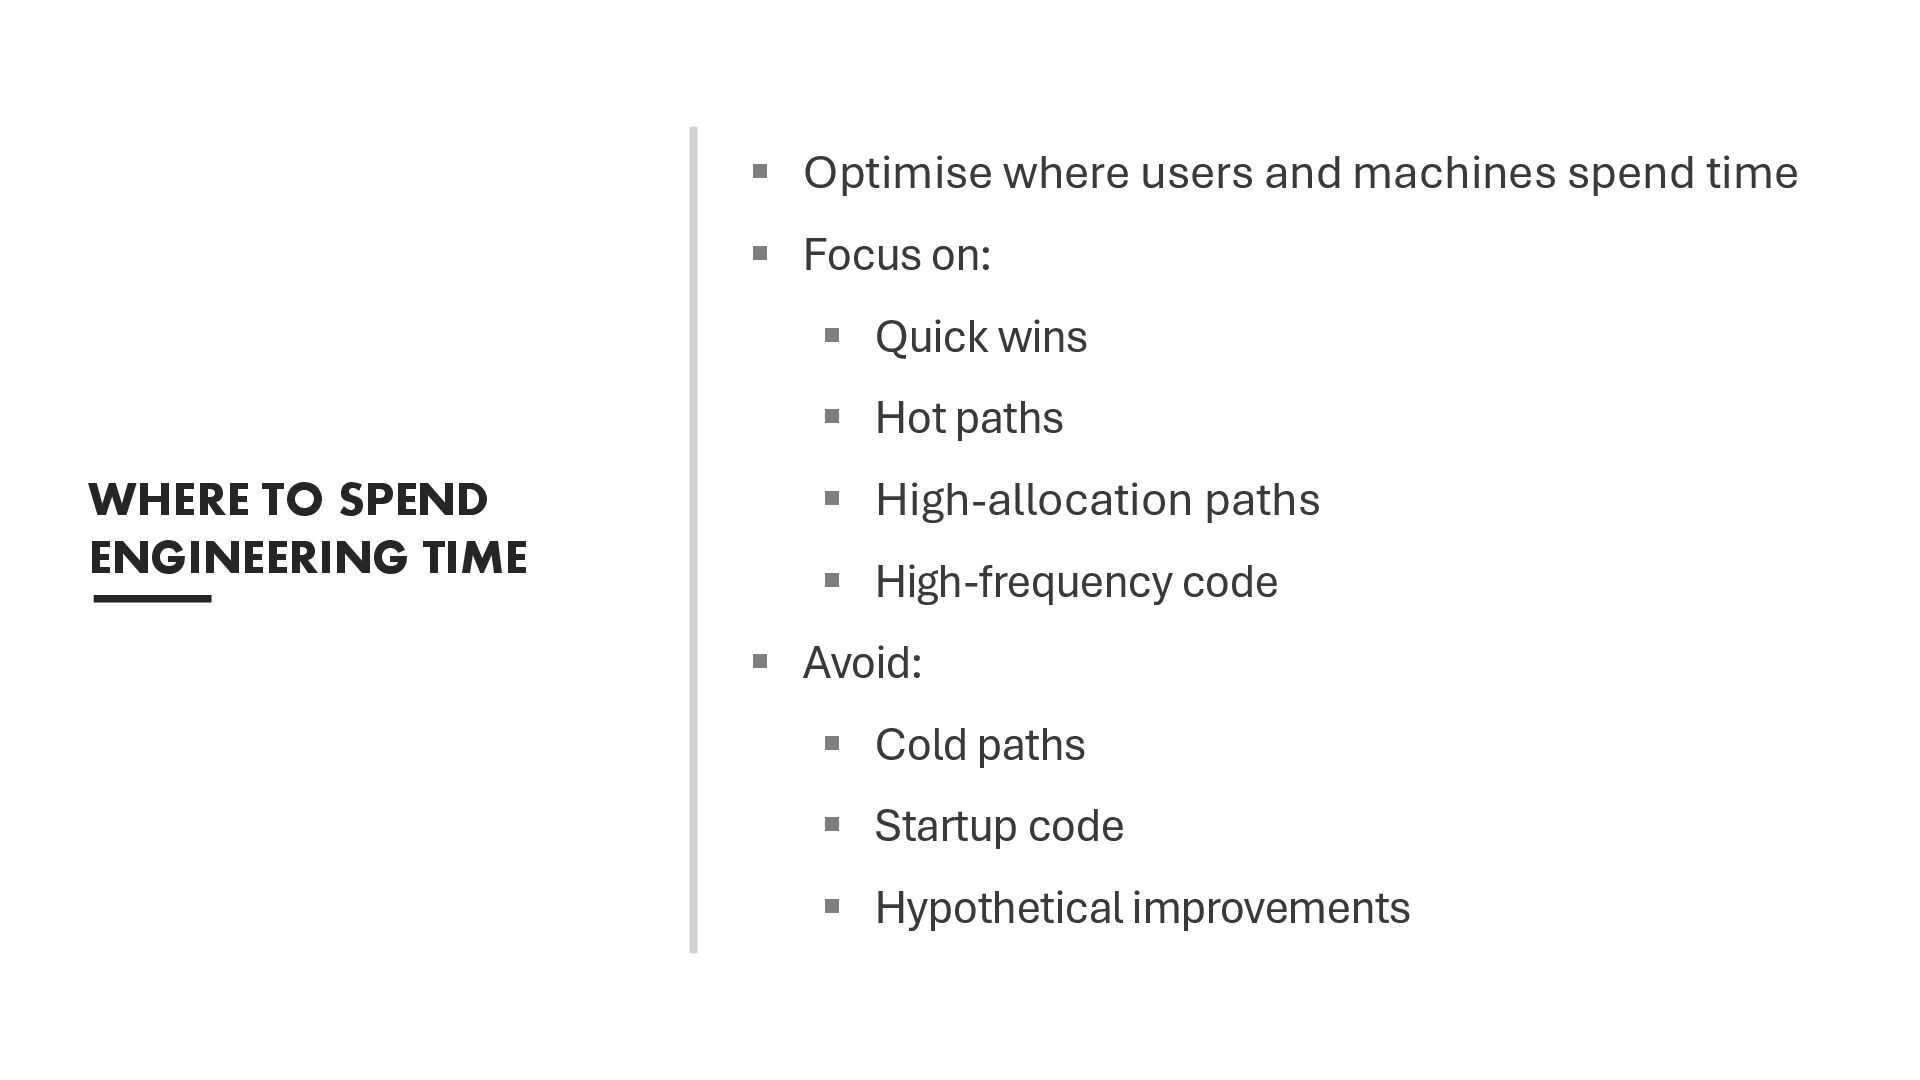
This talk explores the practical aspects of performance optimisation in .NET. We’ll look at proven strategies for monitoring, identifying, analysing, and iteratively improving applications. You’ll learn how to approach the performance lifecycle, from monitoring applications in production and pinpointing the best areas to optimise, to investing valuable engineering time where it counts most.

Through a worked example, we’ll follow a feature through the optimisation cycle. We’ll profile the application, design benchmarks, theorise improvements, and iteratively refine the implementation to reduce allocations and execution time, while balancing performance gains with code readability and maintainability.

Along the way, you’ll learn how to use tools like dotTrace, dotMemory, and BenchmarkDotNet to target areas for improvement and validate gains. We’ll discuss common optimisation opportunities, from smarter memory usage and fewer allocations to more efficient execution flow.

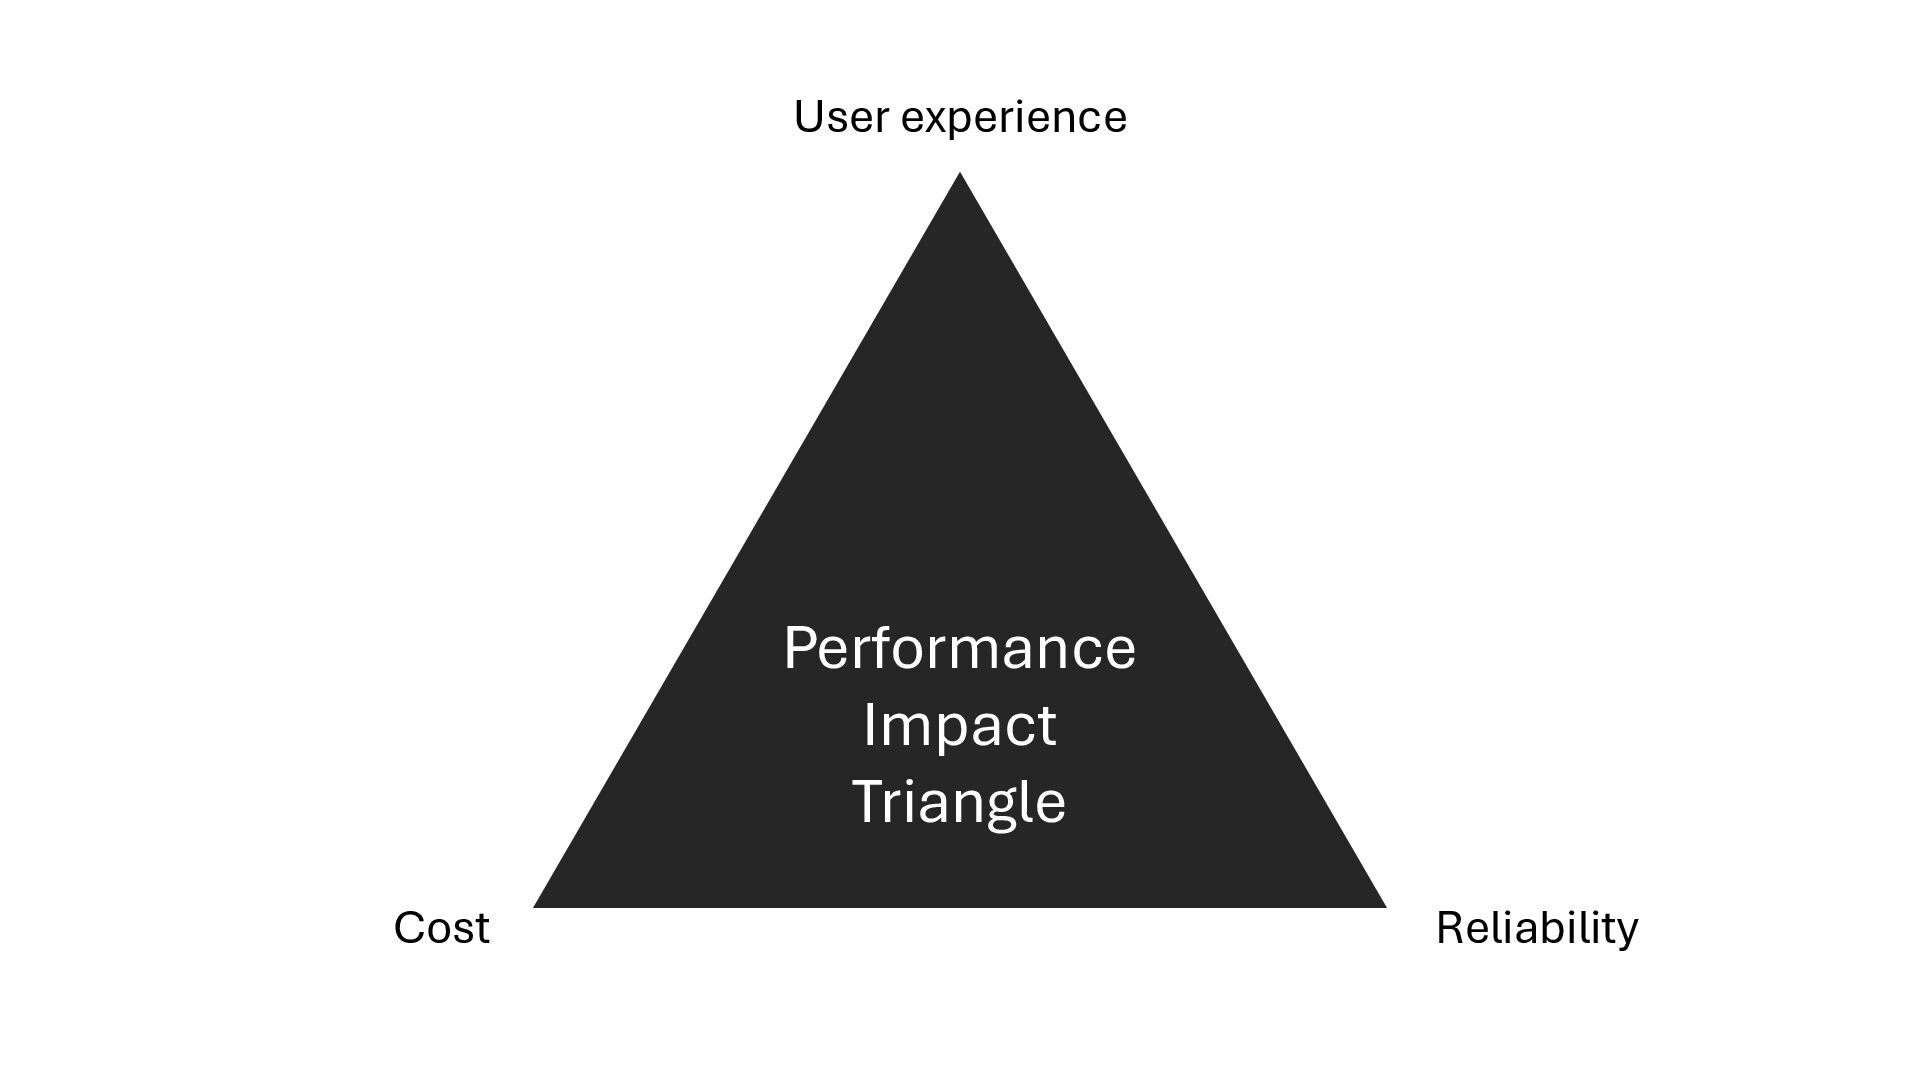
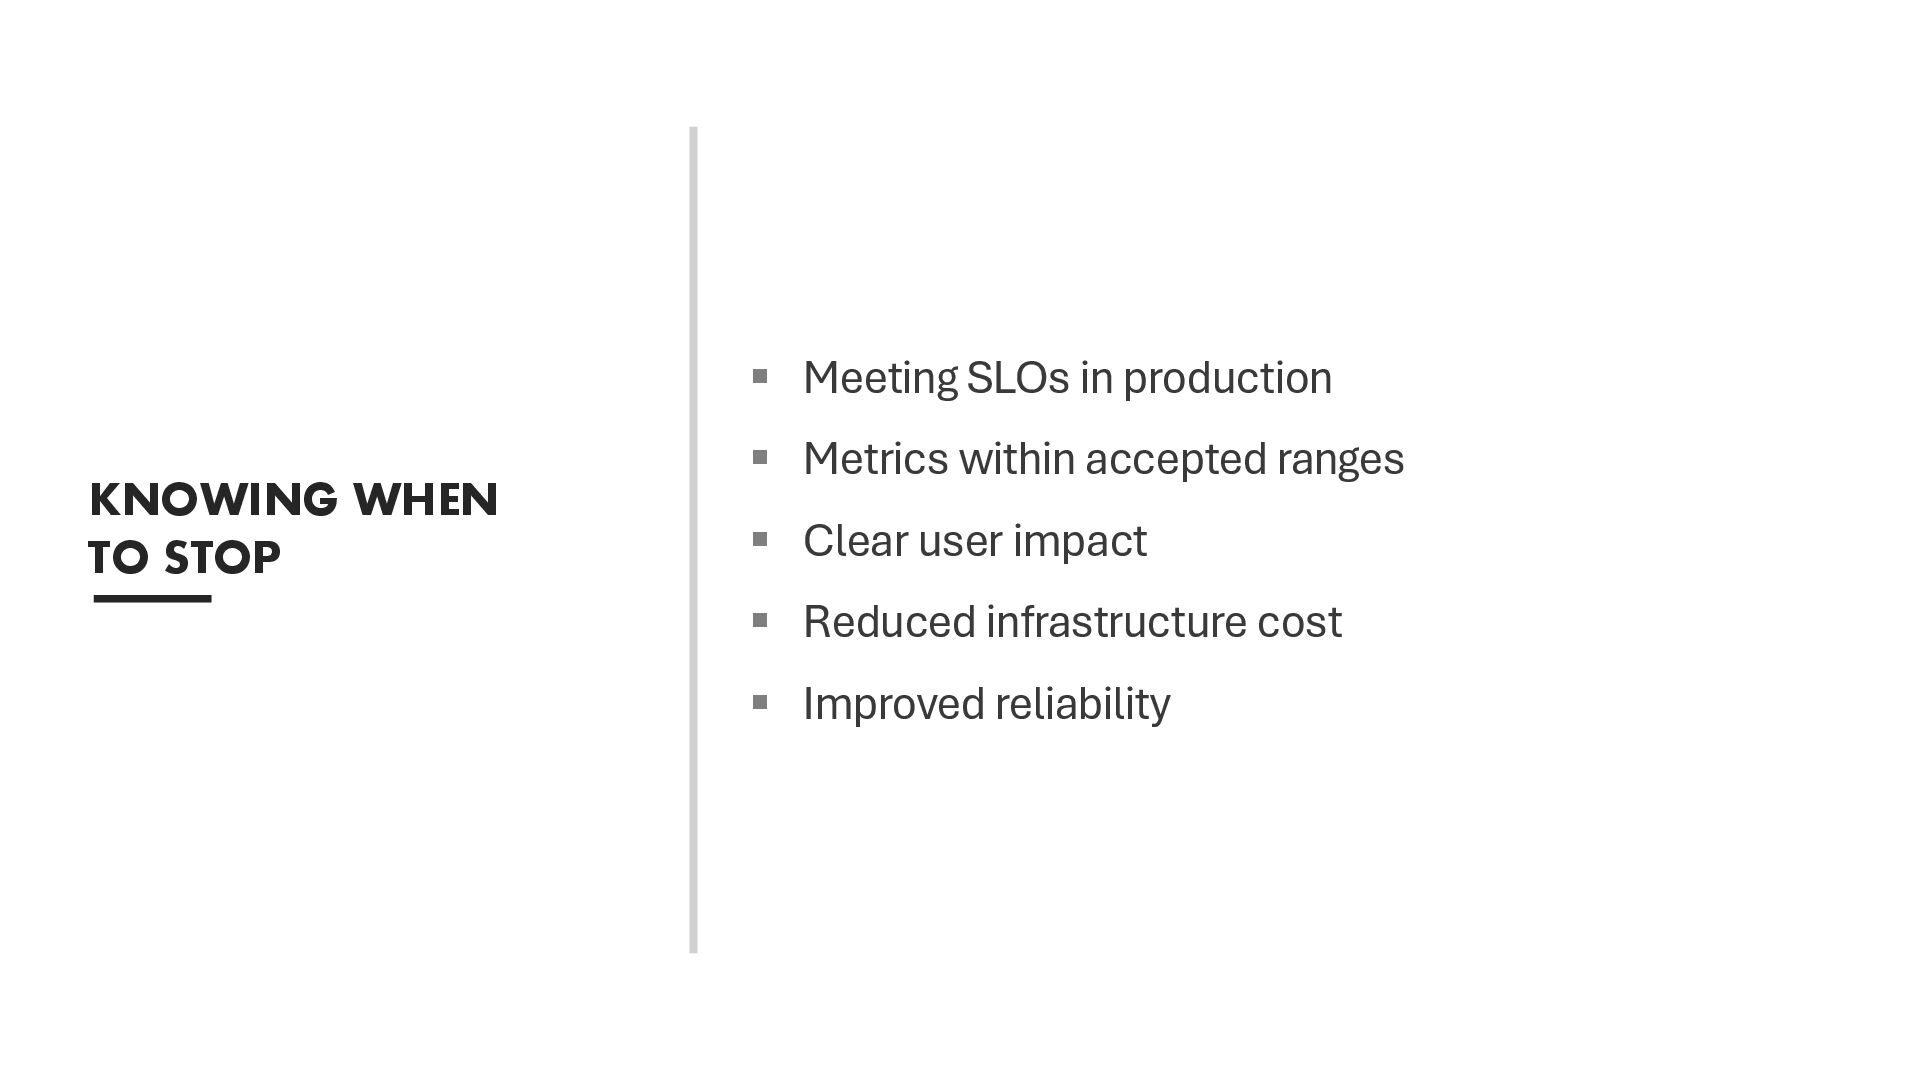
By the end of this session, you’ll leave with practical techniques to write faster, more efficient .NET code, along with the judgment to know when optimisation is worth the trade-off, and when it’s not.

Avatar for Steve Gordon

Steve Gordon

January 27, 2026
Tweet

More Decks by Steve Gordon

Other Decks in Technology

Transcript

  1. APPLICATION PERFORMANCE OPTIMISATION IN PRACTICE STEVE GORDON Engineer @ Elastic

    | Microsoft MVP | Pluralsight author @stevejgordon | stevejgordon.co.uk https://github.com/stevejgordon/practical-performance-demo
  2. WHAT WE’LL COVER ▪ Making performance visible with real data

    ▪ When and what to optimise ▪ The performance optimisation loop ▪ Demo: A real .NET optimisation https://github.com/stevejgordon/practical-performance-demo ▪ Building sustainable practices
  3. THE PERFORMANCE PROBLEM ▪ Most teams treat as reactive firefighting

    ▪ Two common failure modes: ▪ Premature optimisation (the famous quote)
  4. “We should forget about small efficiencies, say about 97% of

    the time: premature optimization is the root of all evil. Yet we should not pass up our opportunities in that critical 3%.”
  5. “We should forget about small efficiencies, say about 97% of

    the time: premature optimization is the root of all evil. Yet we should not pass up our opportunities in that critical 3%.”
  6. THE PERFORMANCE PROBLEM ▪ Most teams treat as reactive firefighting

    ▪ Two common failure modes: ▪ Premature optimisation (the famous quote) ▪ Ignoring performance until crisis ▪ Degrades gradually, not like functional bugs ▪ Performance engineering as a proactive discipline
  7. OPTIMISATION TRIGGERS ▪ Production monitoring (observability) ▪ Alerts / SLOs

    ▪ Ad hoc analysis (e.g., traces) ▪ User feedback ▪ Anecdotal evidence ▪ Developer experience and intuition ▪ Feature requirements and acceptance criteria ▪ Performance testing
  8. WHY PRODUCTION DATA MATTERS ▪ Local benchmarks ≠ real usage

    ▪ Usage patterns, load, concurrency, GC, caching etc. behave differently ▪ Avoids the “it was fast locally” bias
  9. PERFORMANCE OPTIMISATION LOOP 1. Observe – Monitoring tells you something

    is wrong 2. Identify – Profiling shows where the pain is 3. Test – Validate existing behaviour 4. Measure – Benchmarks quantify impact 5. Improve – Apply small, targeted changes 6. Validate – Prove the gain (re-run benchmarks + tests) 7. Document – Record results and explain complexity 8. Repeat – Continuously refine and re-check
  10. AI CAN HELP YOU ▪ GitHub CoPilot can help suggest

    optimisations ▪ The Visual Studio Profiler Agent (@Profiler) can help automate the optimisation loop
  11. WHERE TO SPEND ENGINEERING TIME ▪ Optimise where users and

    machines spend time ▪ Focus on: ▪ Quick wins ▪ Hot paths ▪ High-allocation paths ▪ High-frequency code ▪ Avoid: ▪ Cold paths ▪ Startup code ▪ Hypothetical improvements
  12. KNOWING WHEN TO STOP ▪ Meeting SLOs in production ▪

    Metrics within accepted ranges ▪ Clear user impact ▪ Reduced infrastructure cost ▪ Improved reliability
  13. MAKING PERFORMANCE SUSTAINABLE ▪ Make performance visible (dashboards, alerts) ▪

    Define performance budgets (SLOs) ▪ Make regression detection automatic (CI/CD) ▪ Review performance as part of normal delivery ▪ Shared ownership
  14. KEY TAKEAWAYS ▪ Performance engineering is a discipline, not a

    crisis response ▪ Measure, prioritize, optimize, validate—continuously ▪ Be data-driven ▪ Production monitoring is key ▪ Validate every change ▪ Optimise iteratively ▪ Follow the performance optimization loop ▪ Focus on hotspots ▪ Balance performance & maintainability (pragmatism) ▪ Build team ownership and shared practices