Devopsdays Cape Town: Resource Saturation Monitoring and Capacity Planning on GitLab.com
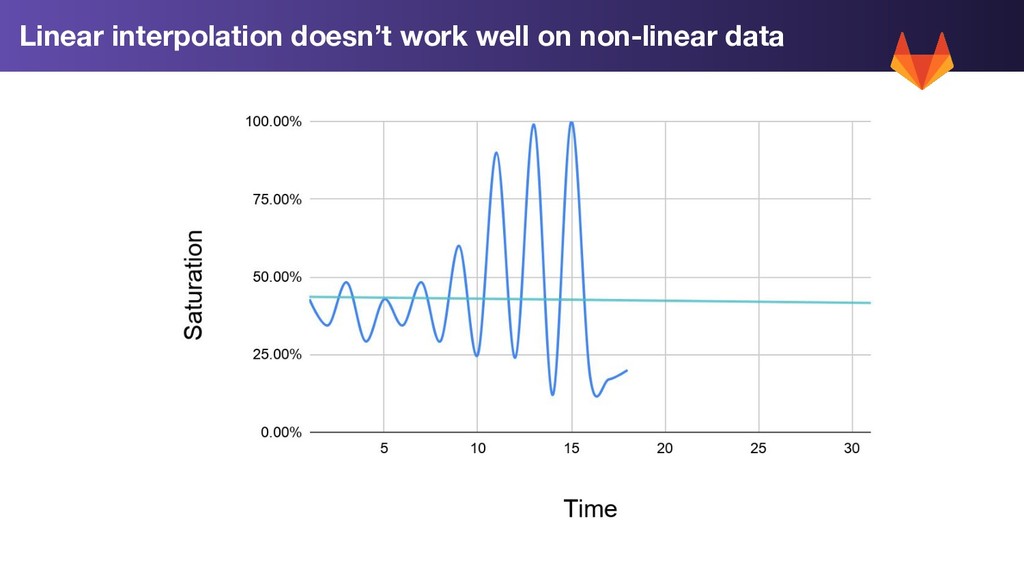
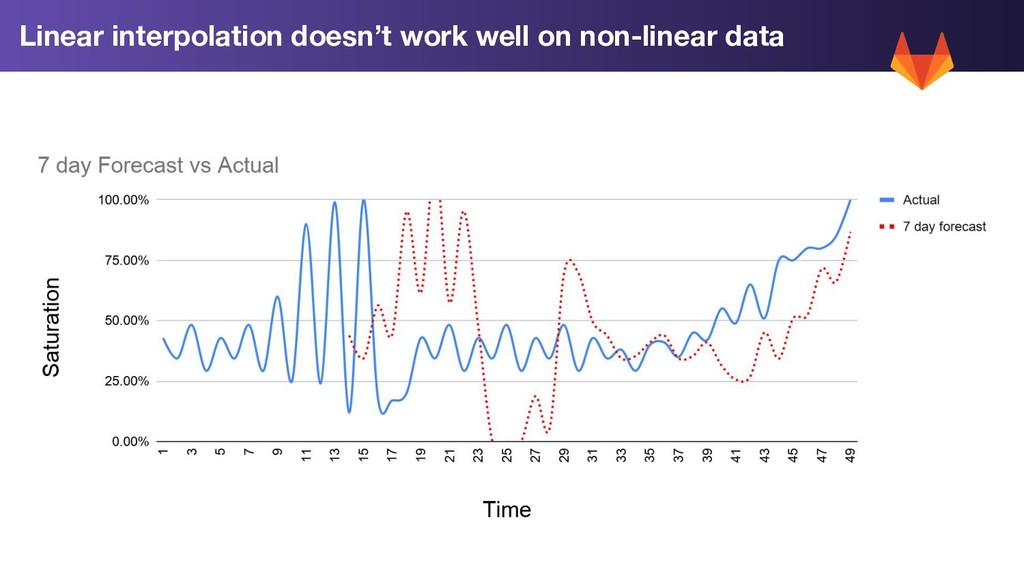
In this talk, I present the dangers of resource saturation, and how you can utilise prometheus functionality to monitor, track and predict potential future resource saturation issues, up to two weeks in advance.
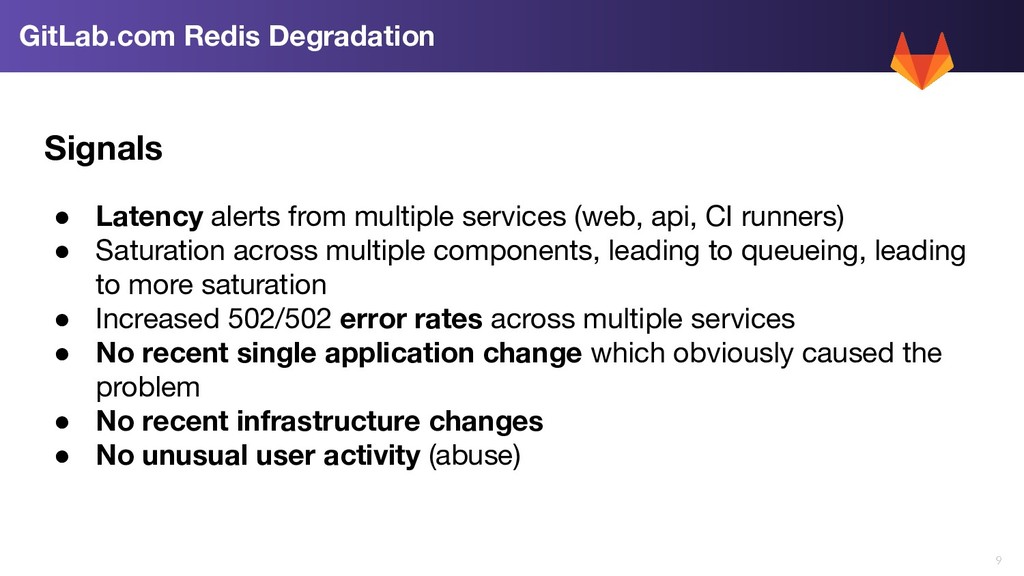
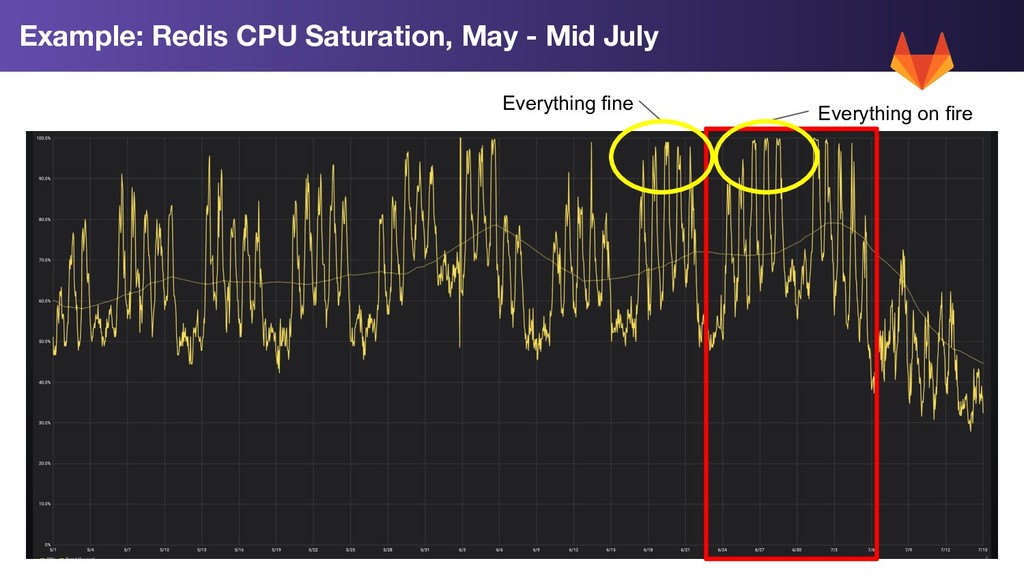
from multiple services (web, api, CI runners) • Saturation across multiple components, leading to queueing, leading to more saturation • Increased 502/502 error rates across multiple services • No recent single application change which obviously caused the problem • No recent infrastructure changes • No unusual user activity (abuse) GitLab.com Redis Degradation
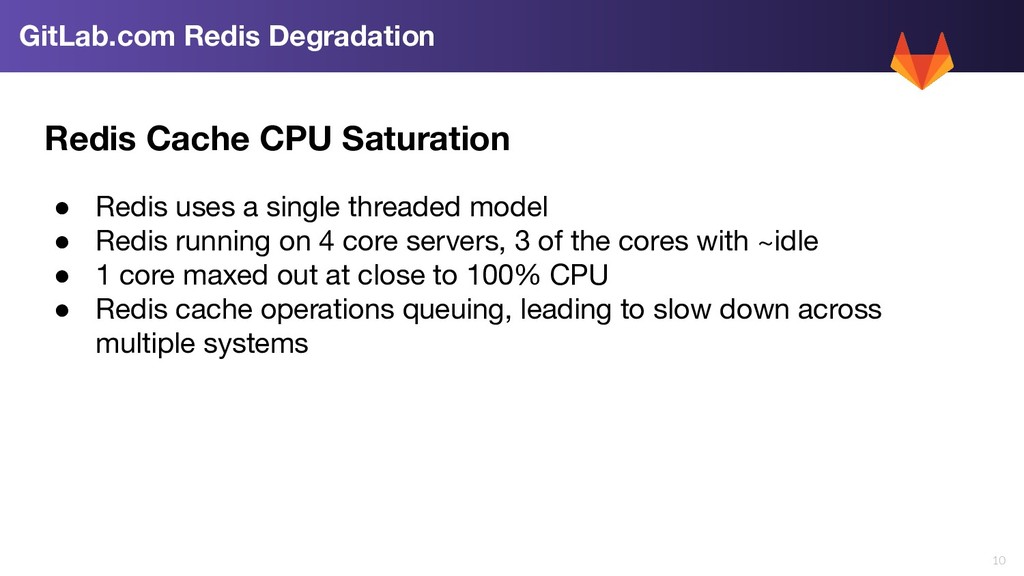
• Redis uses a single threaded model • Redis running on 4 core servers, 3 of the cores with ~idle • 1 core maxed out at close to 100% CPU • Redis cache operations queuing, leading to slow down across multiple systems GitLab.com Redis Degradation
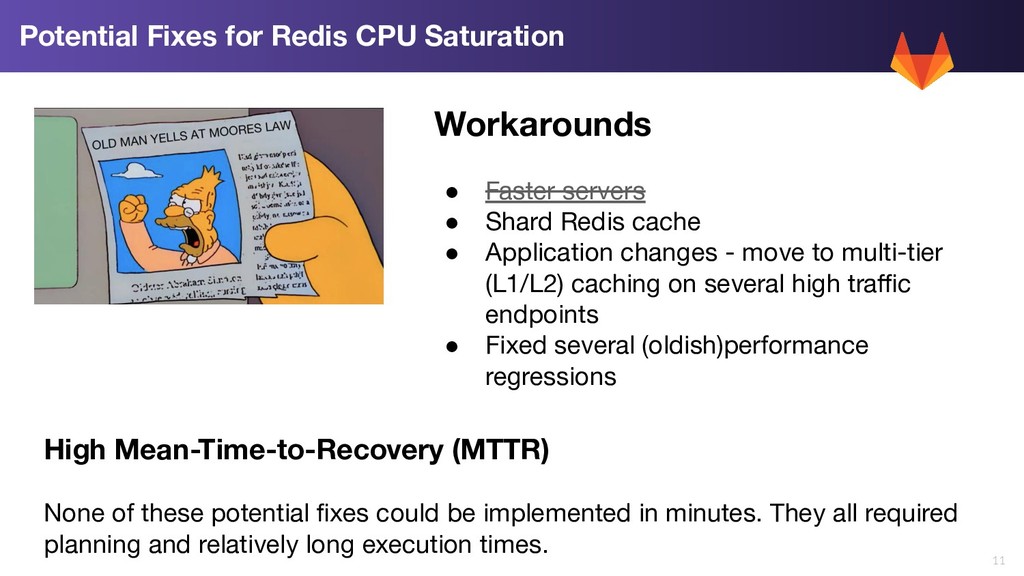
• Shard Redis cache • Application changes - move to multi-tier (L1/L2) caching on several high traffic endpoints • Fixed several (oldish)performance regressions High Mean-Time-to-Recovery (MTTR) None of these potential fixes could be implemented in minutes. They all required planning and relatively long execution times. Potential Fixes for Redis CPU Saturation
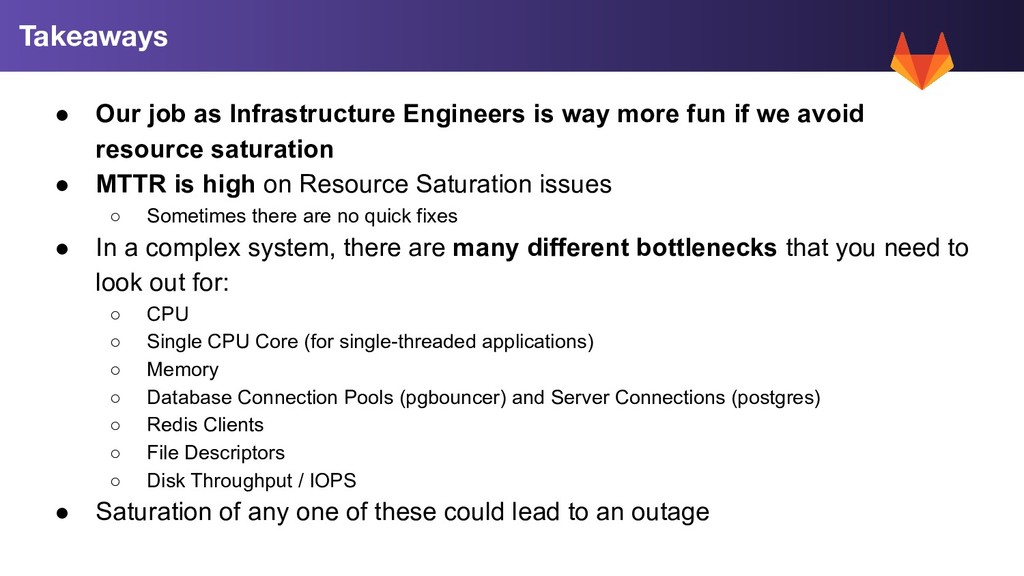
if we avoid resource saturation • MTTR is high on Resource Saturation issues ◦ Sometimes there are no quick fixes • In a complex system, there are many different bottlenecks that you need to look out for: ◦ CPU ◦ Single CPU Core (for single-threaded applications) ◦ Memory ◦ Database Connection Pools (pgbouncer) and Server Connections (postgres) ◦ Redis Clients ◦ File Descriptors ◦ Disk Throughput / IOPS • Saturation of any one of these could lead to an outage Takeaways
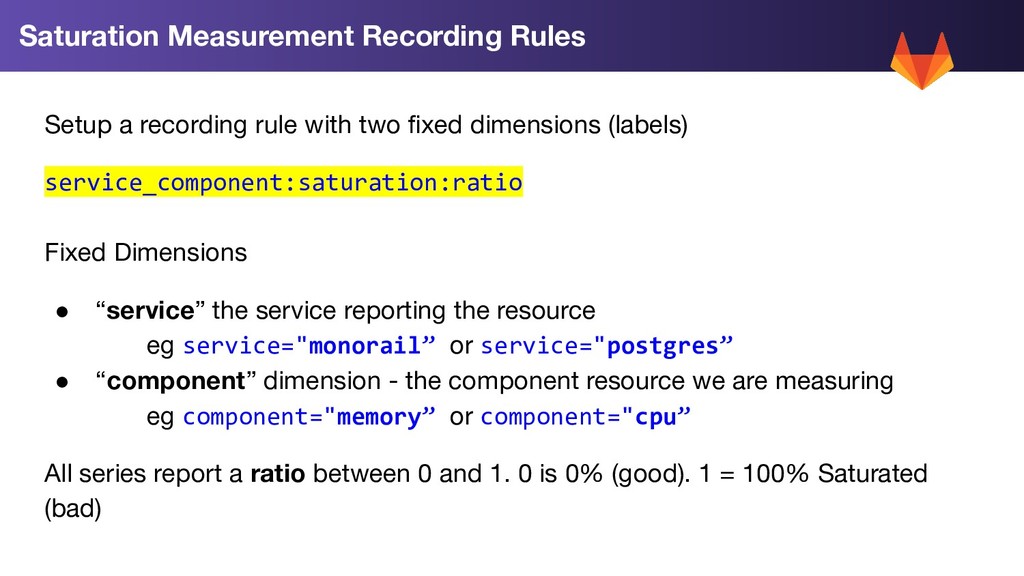
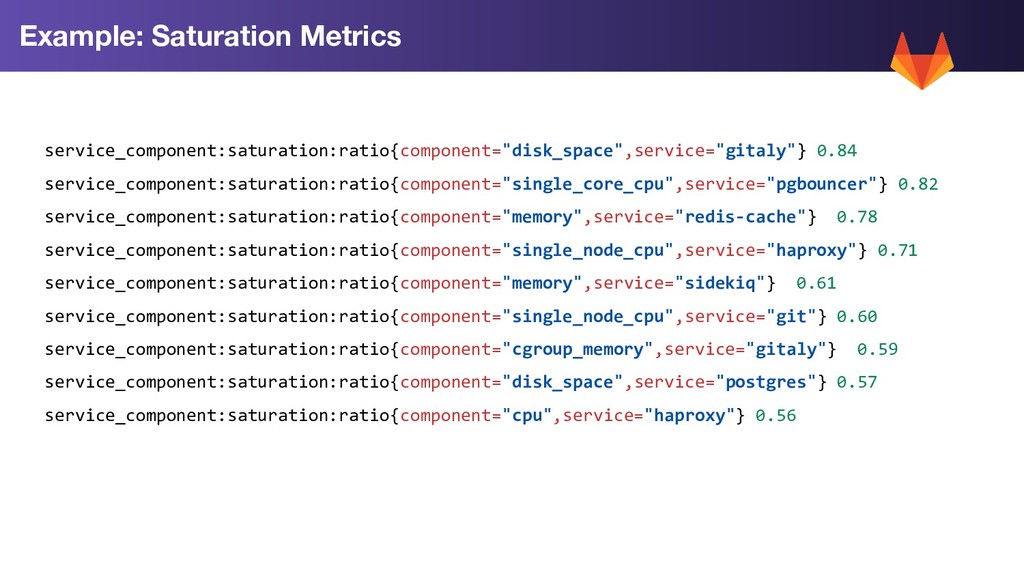
Fixed Dimensions • “service” the service reporting the resource eg service="monorail” or service="postgres” • “component” dimension - the component resource we are measuring eg component="memory” or component="cpu” All series report a ratio between 0 and 1. 0 is 0% (good). 1 = 100% Saturated (bad) Saturation Measurement Recording Rules
utilized CPU: % compute utilized across all nodes in a service Single Node CPU: Maximum compute utilization % on single node in service Single Core CPU: Maximum single core utilization for any core in a service (useful for single threaded services like Redis, pgbouncer, etc) Database Pools: % database connection pool utilization Many others, see: https://gitlab.com/gitlab-com/runbooks/blob/master/rules/service_saturation.yml Resource saturation being measured
- rate(node_cpu_seconds_total{ service=~"redis|pgbouncer", mode="idle" }[1m]) ) by (service) Aggregate with max Example: single-threaded CPU Saturation # service_component:saturation:ratio{component="single_core_cpu",service="patroni"} 0.972 # service_component:saturation:ratio{component="single_core_cpu",service="redis"} 0.404 Single threaded services
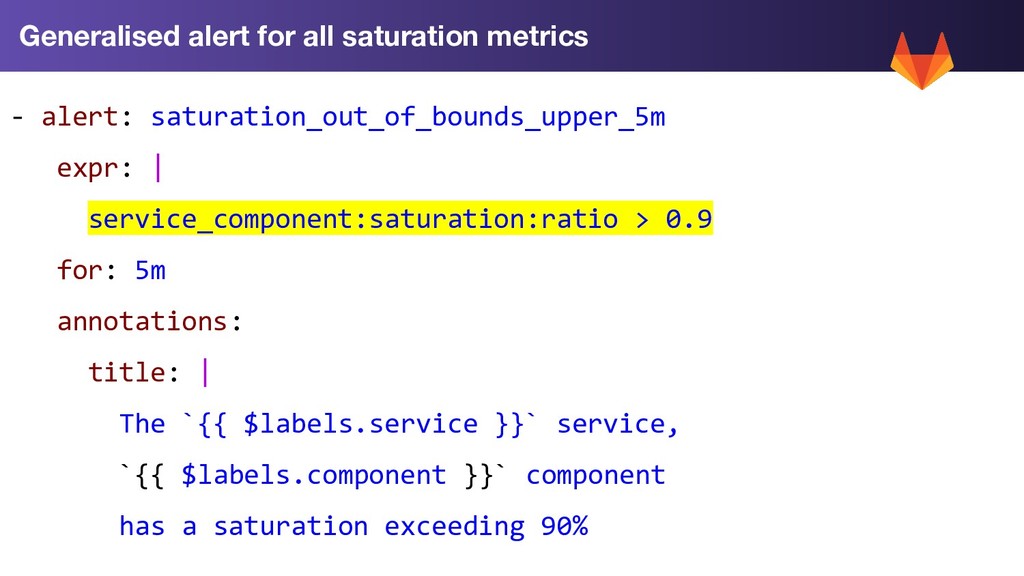
annotations: title: | The `{{ $labels.service }}` service, `{{ $labels.component }}` component has a saturation exceeding 90% Generalised alert for all saturation metrics
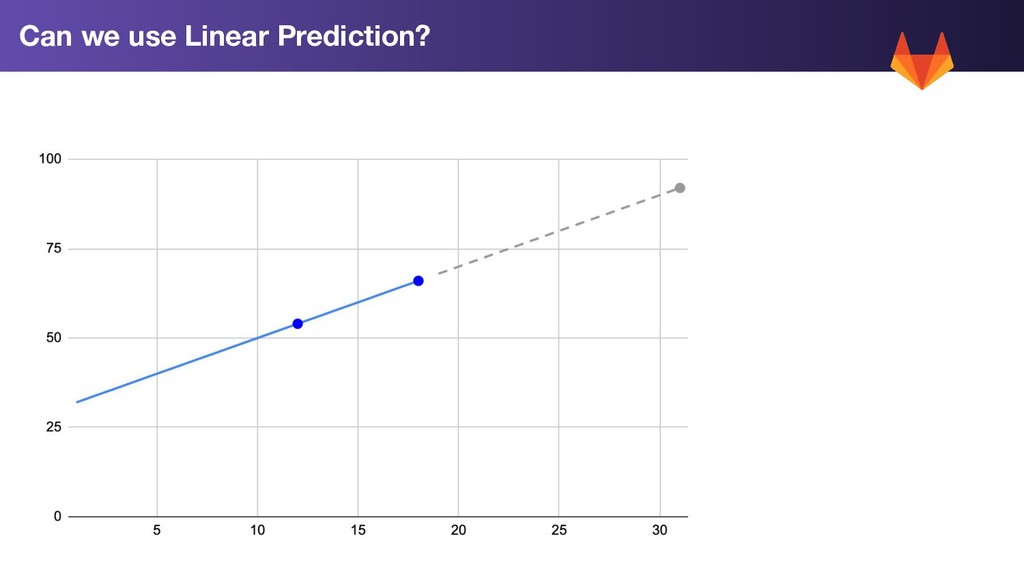
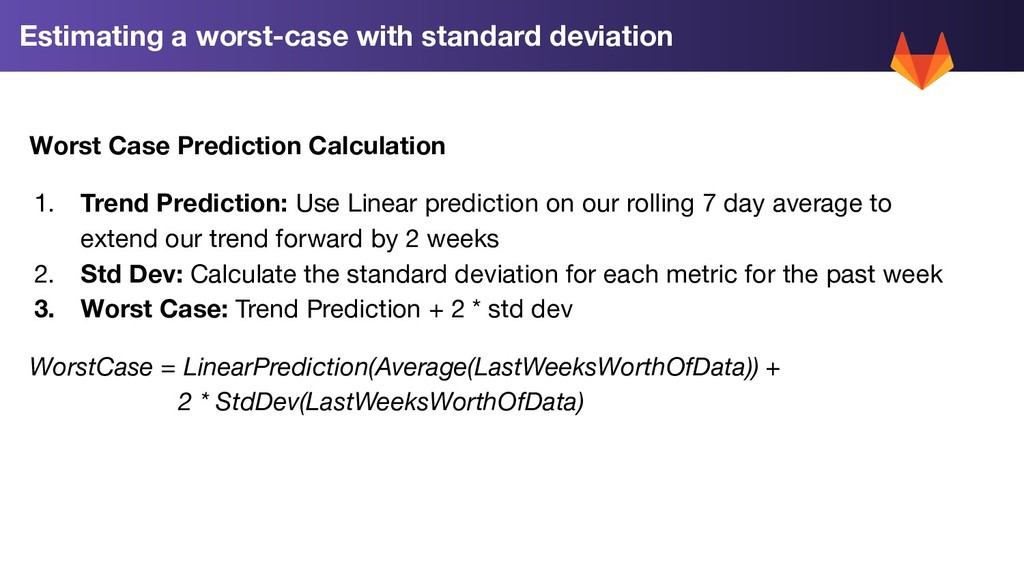
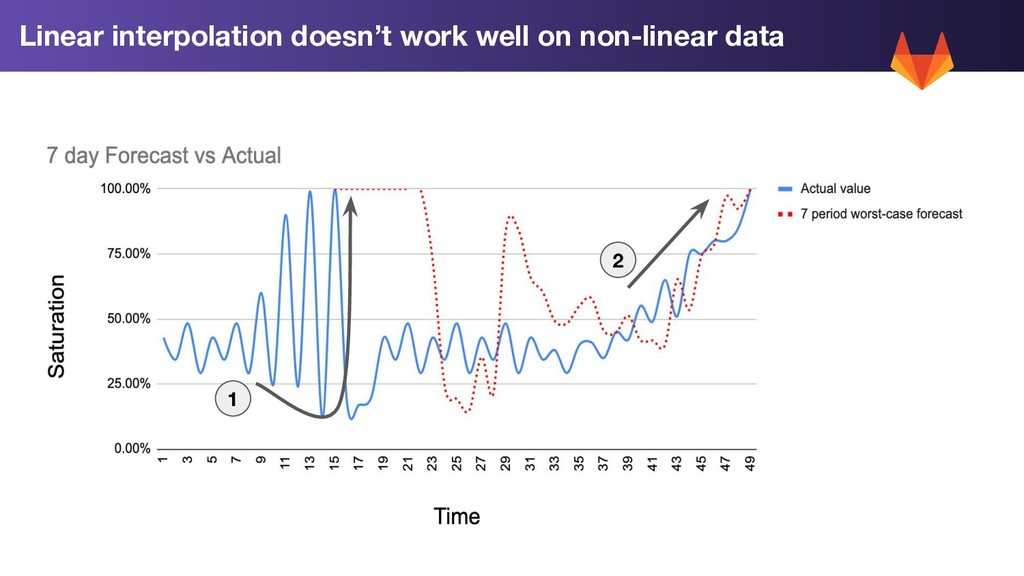
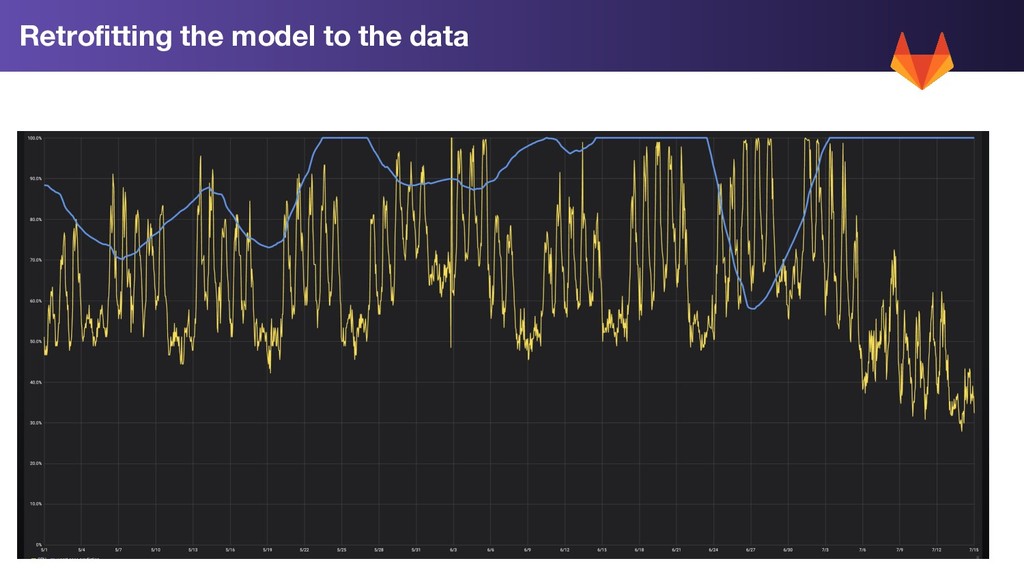
1. Trend Prediction: Use Linear prediction on our rolling 7 day average to extend our trend forward by 2 weeks 2. Std Dev: Calculate the standard deviation for each metric for the past week 3. Worst Case: Trend Prediction + 2 * std dev WorstCase = LinearPrediction(Average(LastWeeksWorthOfData)) + 2 * StdDev(LastWeeksWorthOfData)
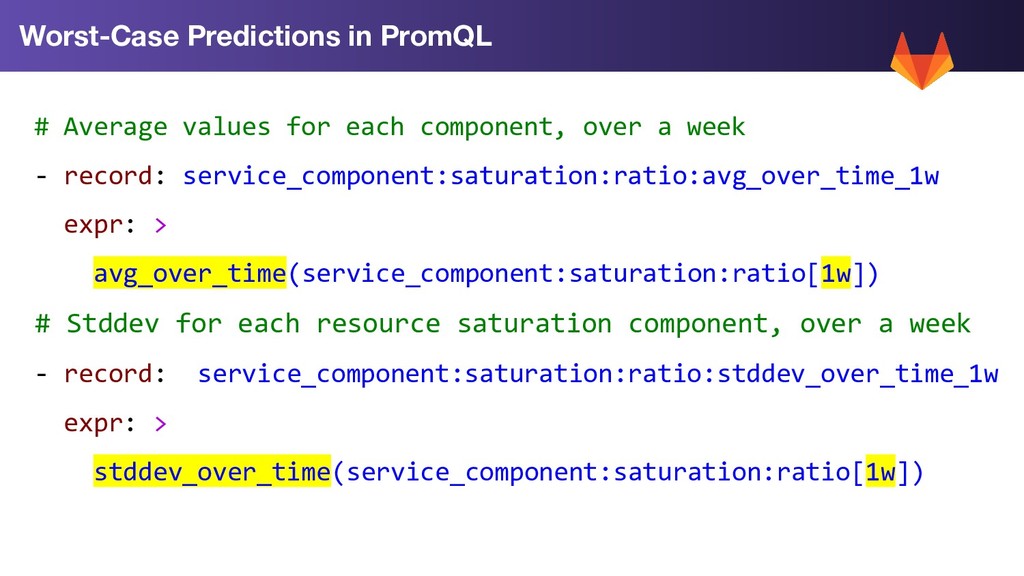
over a week - record: service_component:saturation:ratio:avg_over_time_1w expr: > avg_over_time(service_component:saturation:ratio[1w]) # Stddev for each resource saturation component, over a week - record: service_component:saturation:ratio:stddev_over_time_1w expr: > stddev_over_time(service_component:saturation:ratio[1w])
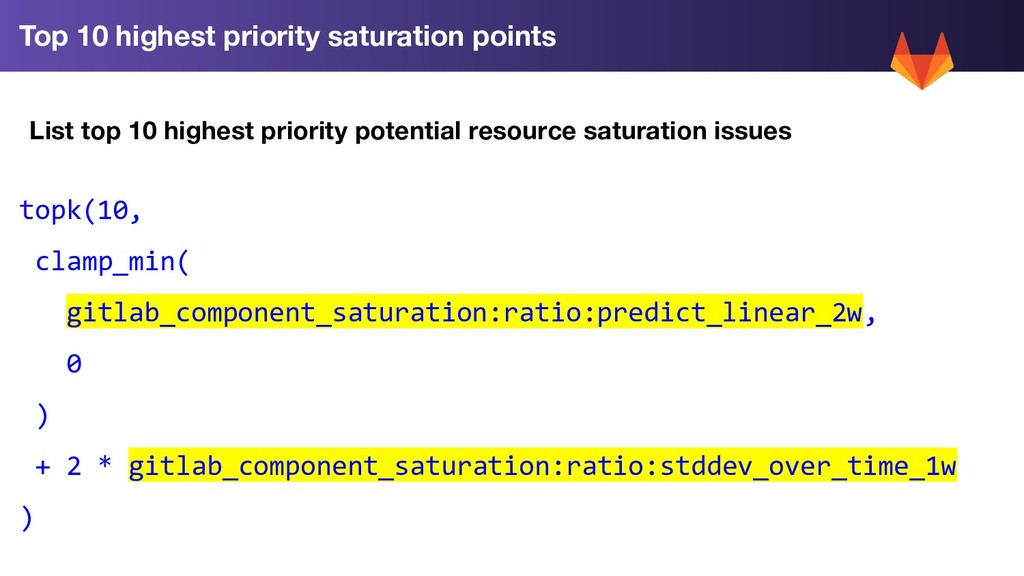
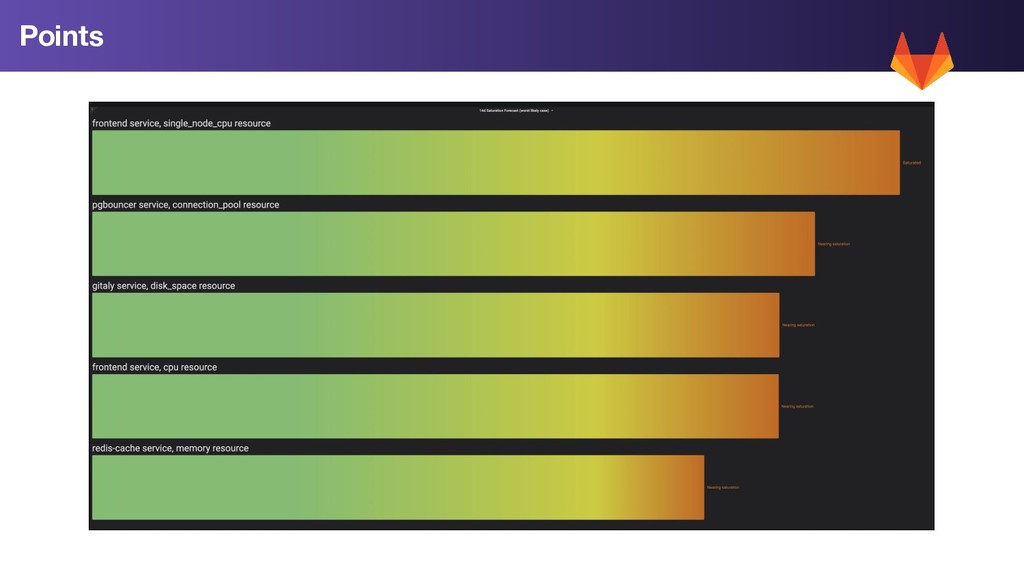
this technique provides an order list of potential bottlenecks, from most urgent to least, this is fed into our roadmap for prioritization. Dogfooding: we’re using these techniques on GitLab.com, but we will be incorporating some of them into GitLab (the product) to help GitLab sysadmins and support engineers to predict problems. Early days: we’re still figuring this out. If you have ideas, please get in touch.
![- record: service_component:saturation:ratio:predict_linear_2w expr: > predict_linear( service_component:saturation:ratio:avg_over_time_1w[1w], 86400 * 14](https://files.speakerdeck.com/presentations/d8fa0d2101f64a3db6bdd3089a3ed592/slide_32.jpg)