Resource Saturation Monitoring and Capacity Planning on GitLab.com
Presented at PromCon EU 2019, I present the dangers of resource saturation, and how you can utilise prometheus functionality to monitor, track and predict potential future resource saturation issues, up to two weeks in advance.
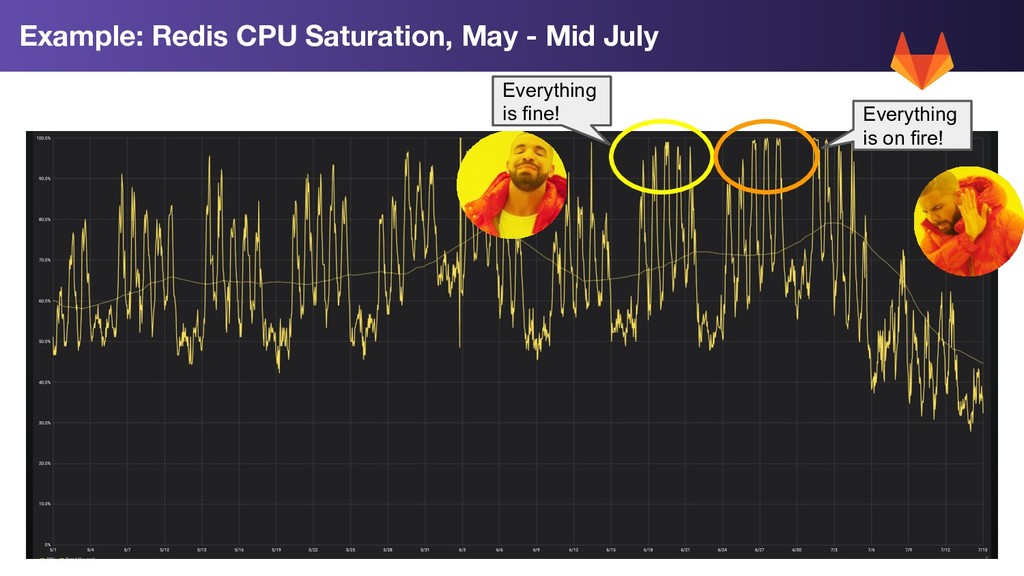
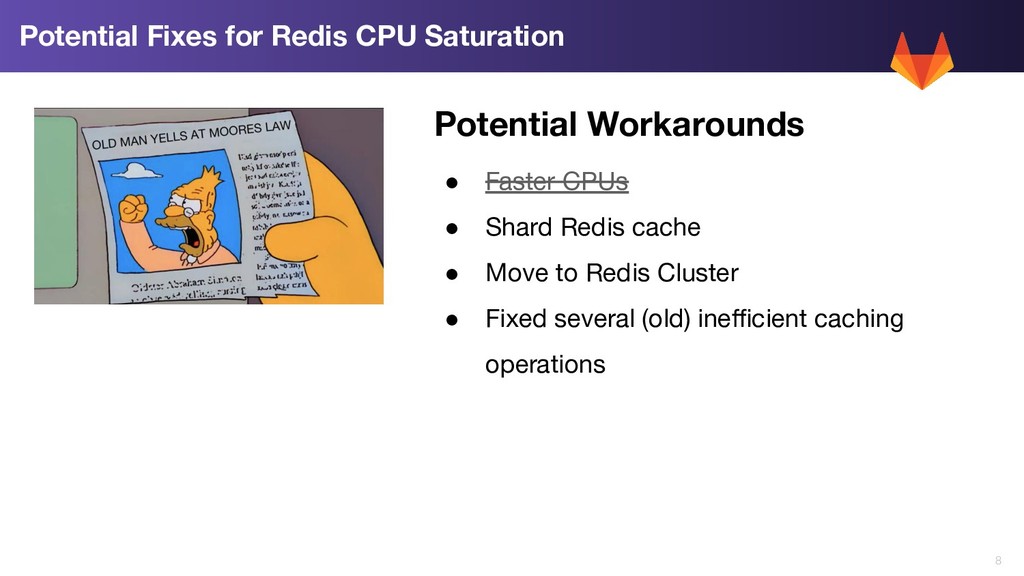
• Redis server is single-threaded • Redis running on 4 core servers, 3 of the cores ~idle at any time • Redis cache operations queuing, leading to slow down across multiple systems that relied on the cache GitLab.com Redis Degradation
application change which obviously caused the problem • No recent infrastructure changes • No unusual user activity (eg, abuse, DDOS, etc) GitLab.com Redis Degradation
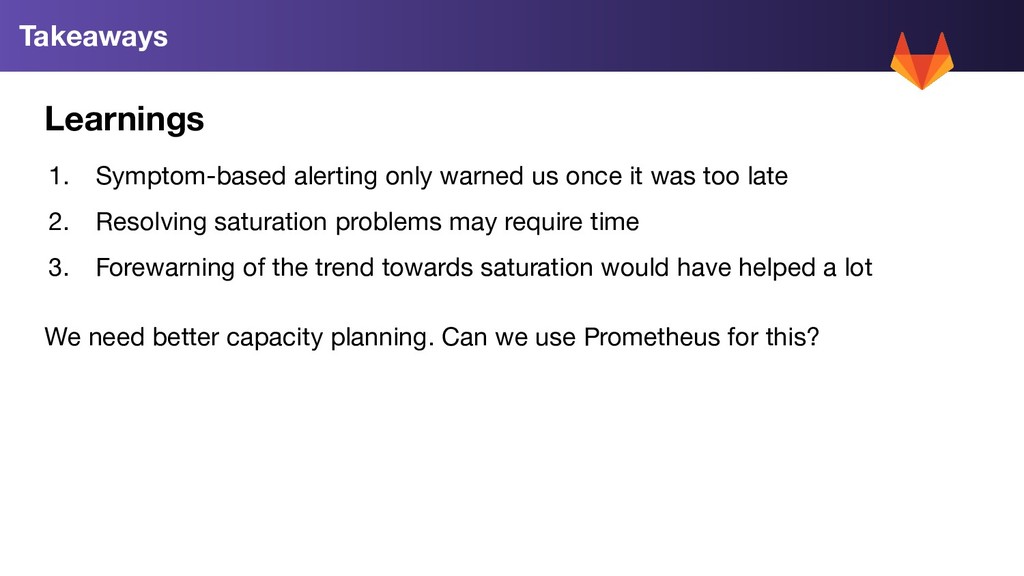
too late 2. Resolving saturation problems may require time 3. Forewarning of the trend towards saturation would have helped a lot We need better capacity planning. Can we use Prometheus for this? Takeaways
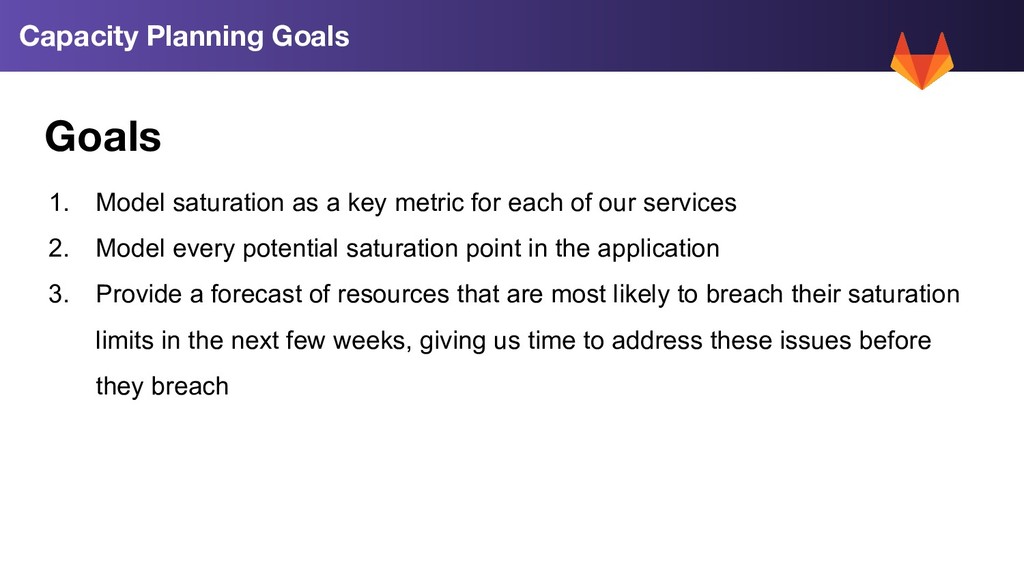
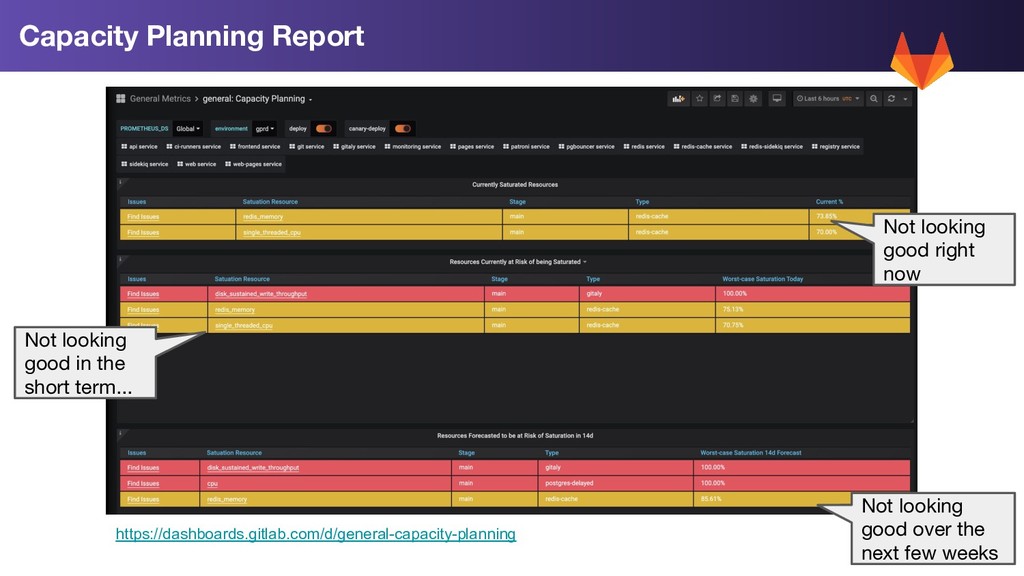
of our services 2. Model every potential saturation point in the application 3. Provide a forecast of resources that are most likely to breach their saturation limits in the next few weeks, giving us time to address these issues before they breach Capacity Planning Goals
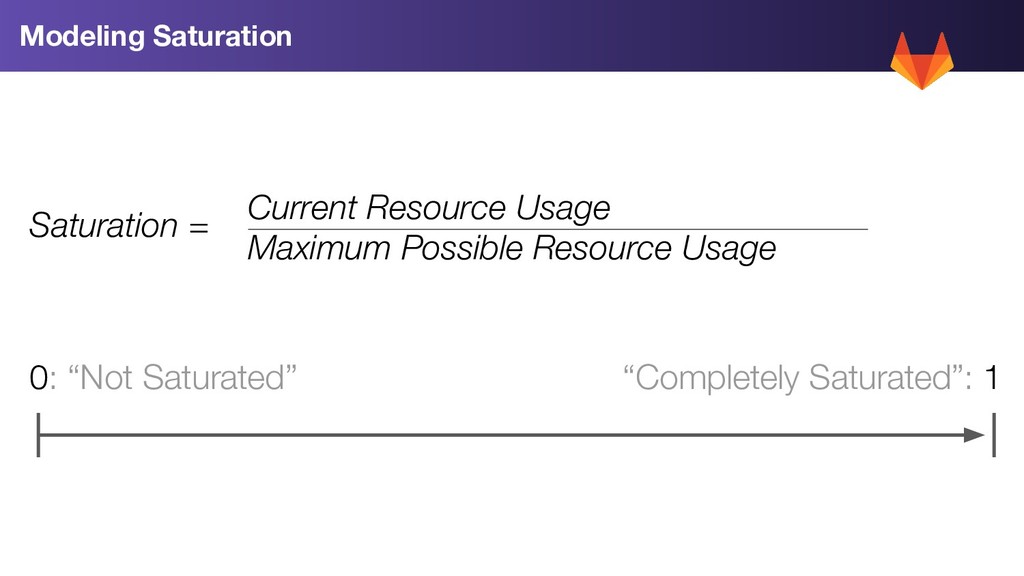
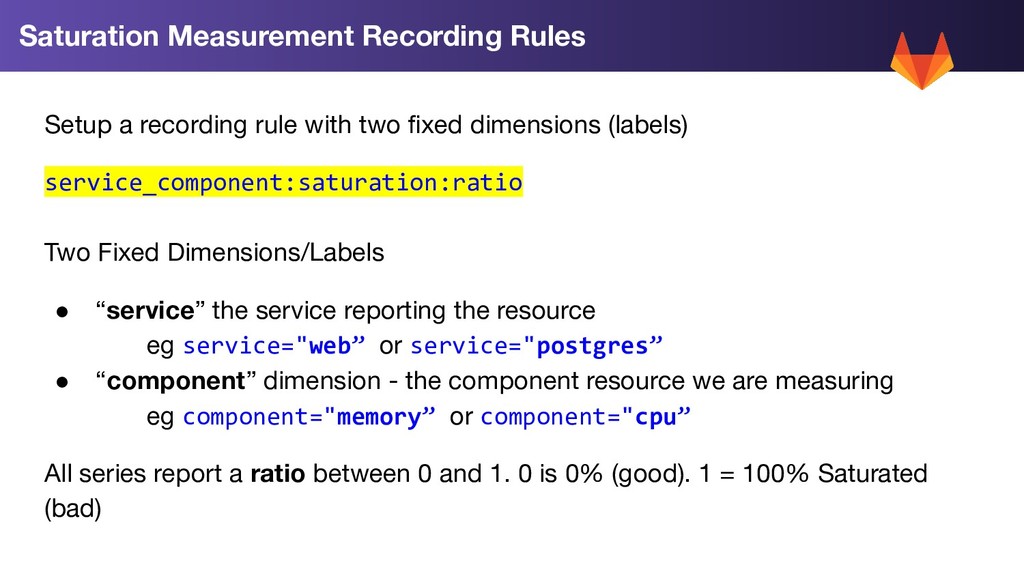
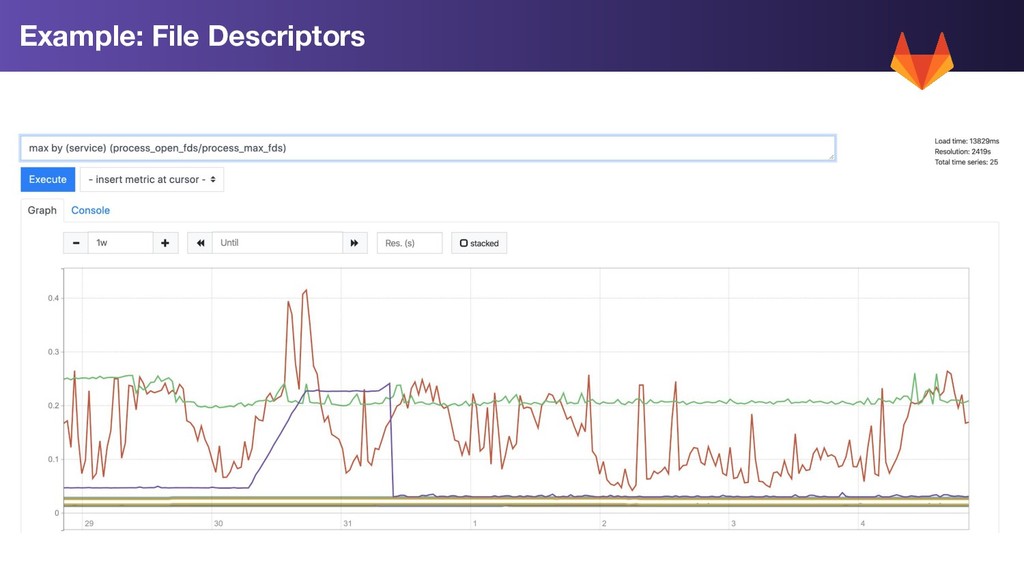
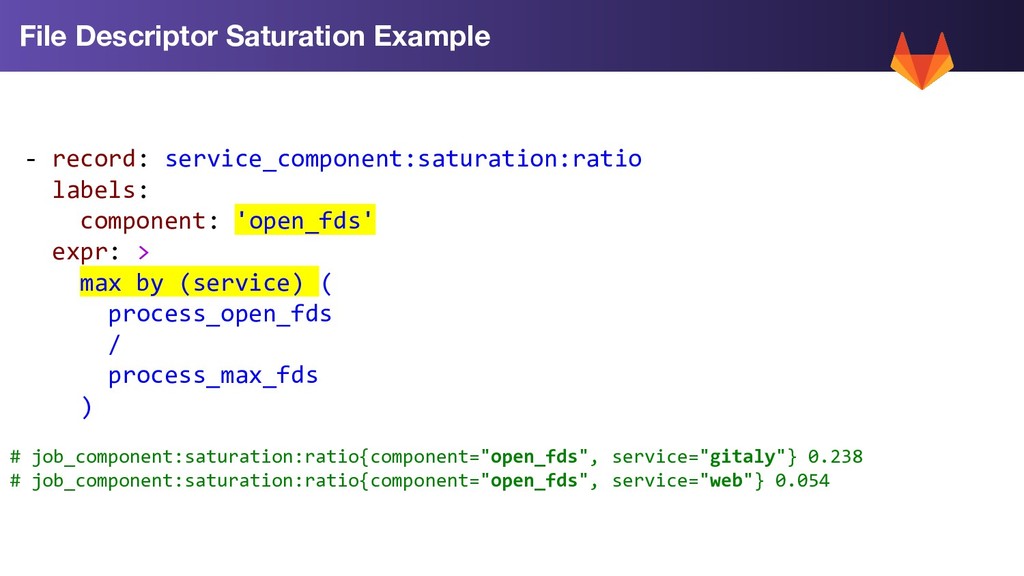
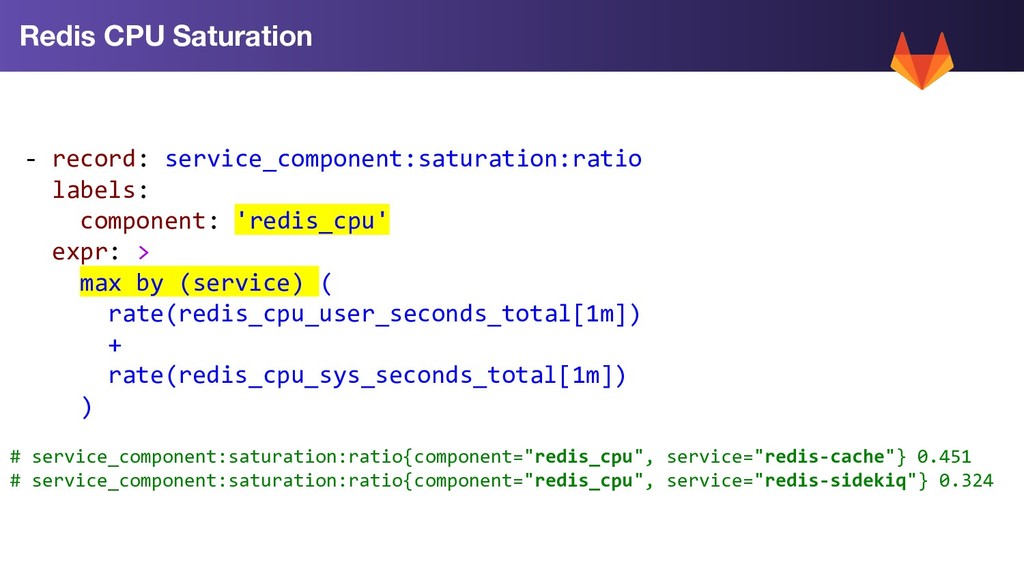
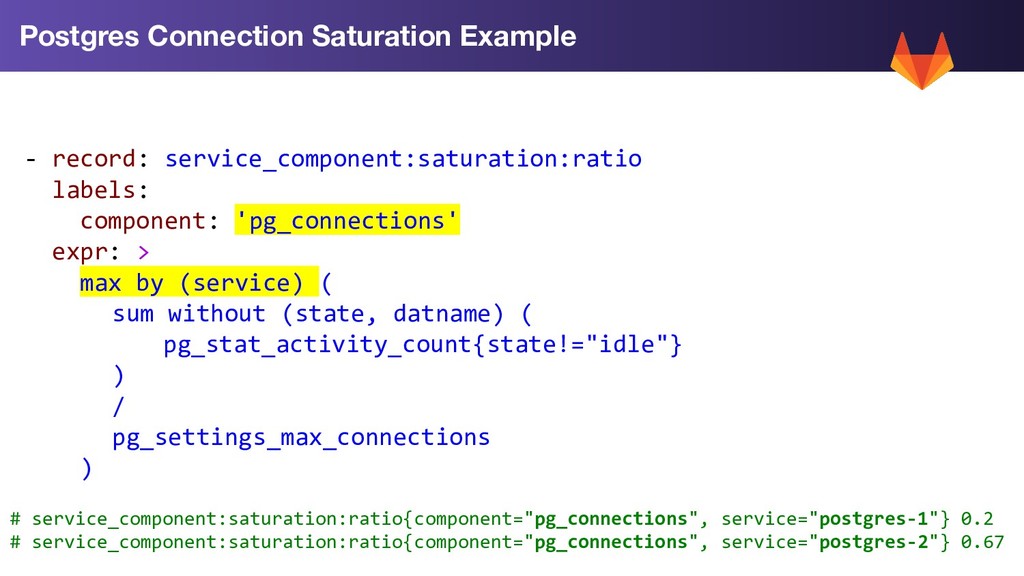
Two Fixed Dimensions/Labels • “service” the service reporting the resource eg service="web” or service="postgres” • “component” dimension - the component resource we are measuring eg component="memory” or component="cpu” All series report a ratio between 0 and 1. 0 is 0% (good). 1 = 100% Saturated (bad) Saturation Measurement Recording Rules
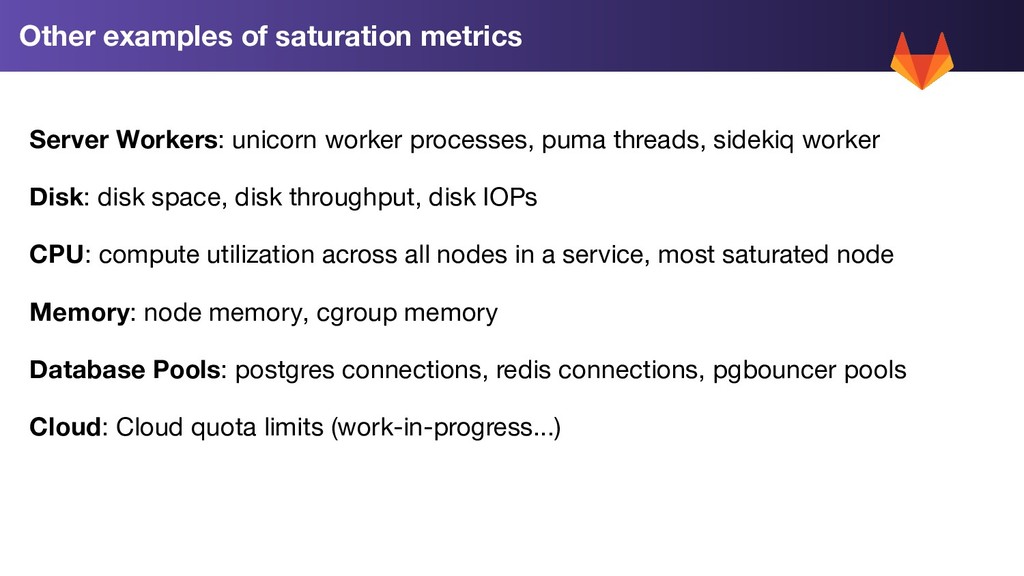
disk space, disk throughput, disk IOPs CPU: compute utilization across all nodes in a service, most saturated node Memory: node memory, cgroup memory Database Pools: postgres connections, redis connections, pgbouncer pools Cloud: Cloud quota limits (work-in-progress...) Other examples of saturation metrics
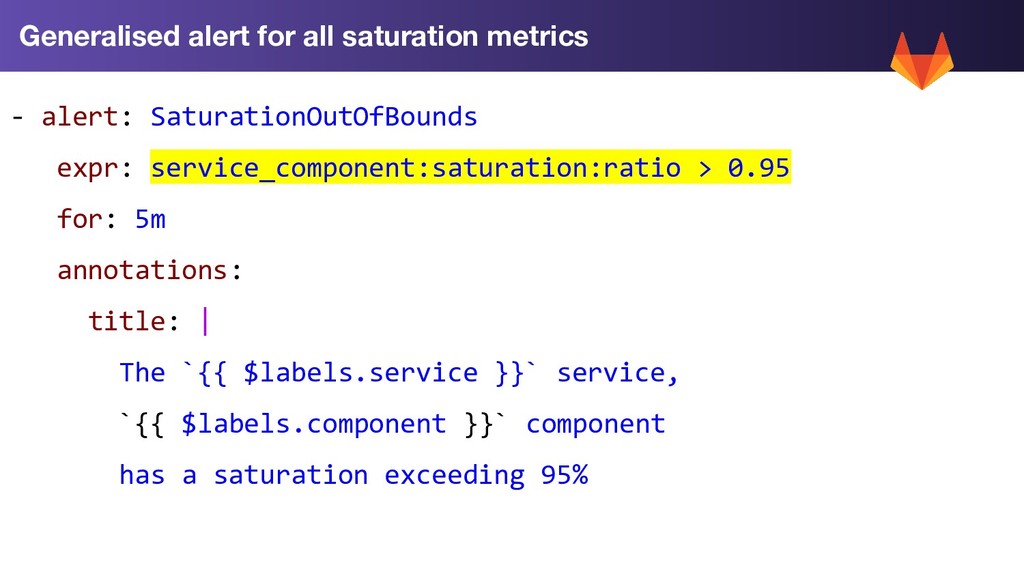
title: | The `{{ $labels.service }}` service, `{{ $labels.component }}` component has a saturation exceeding 95% Generalised alert for all saturation metrics
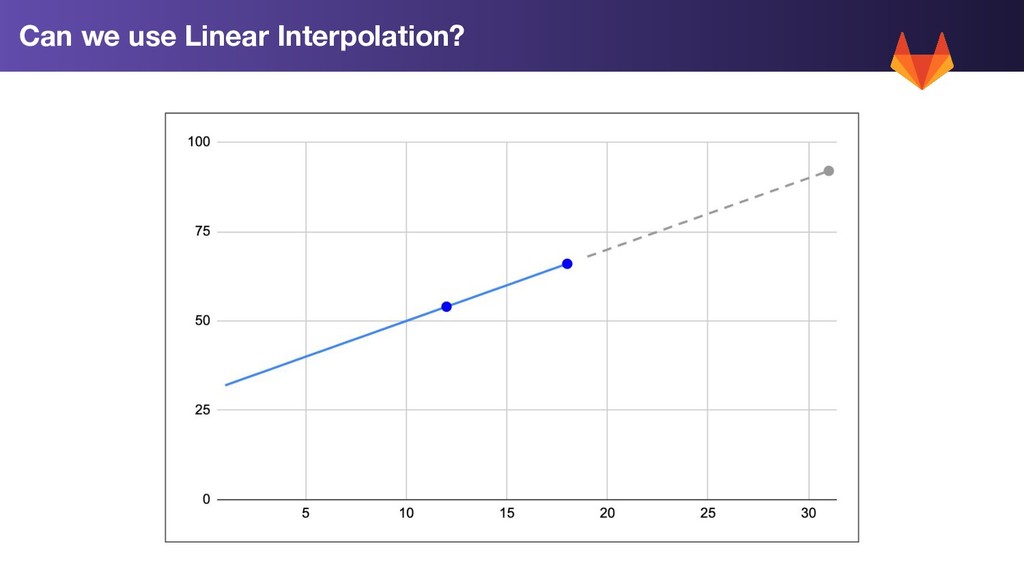
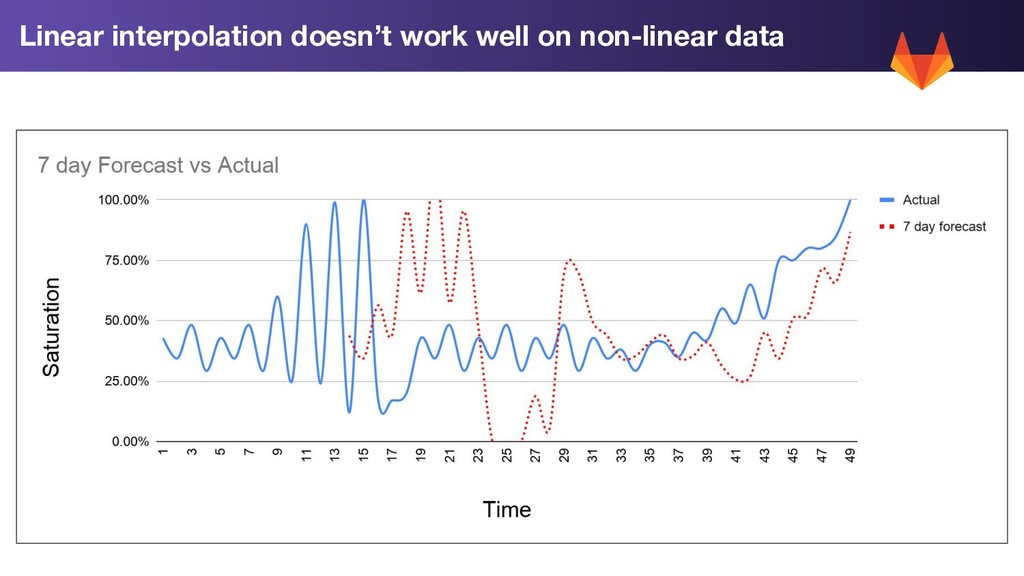
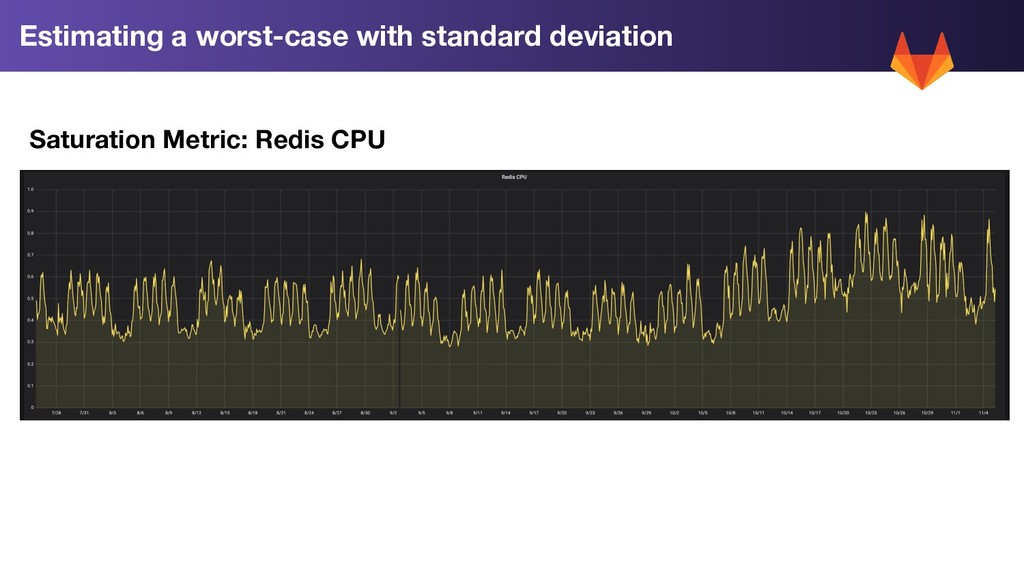
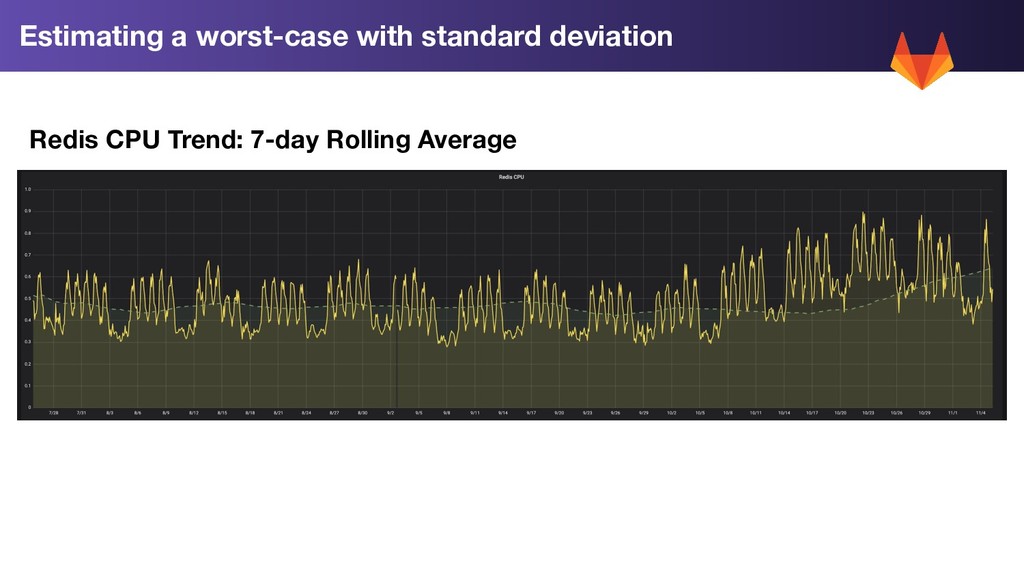
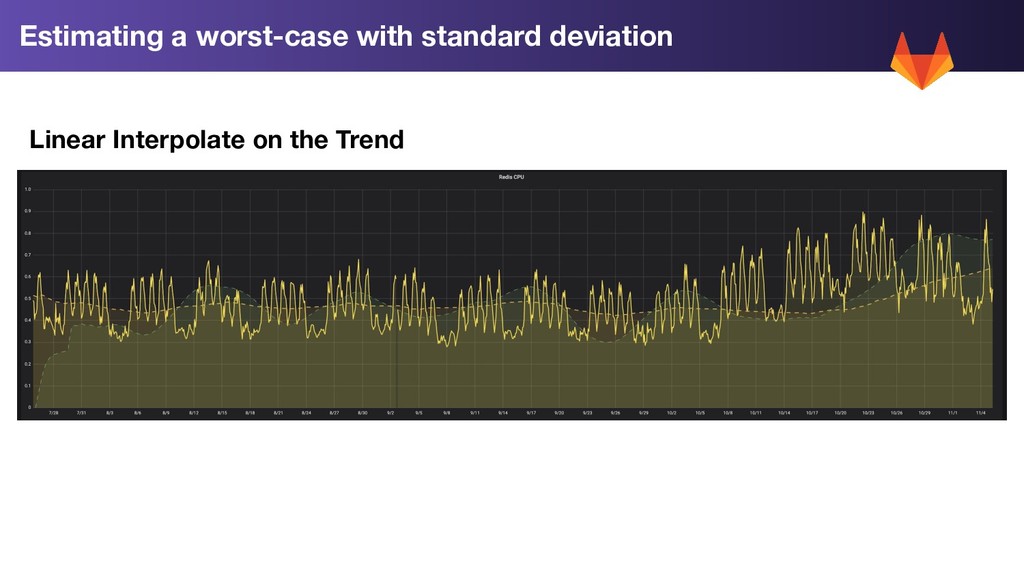
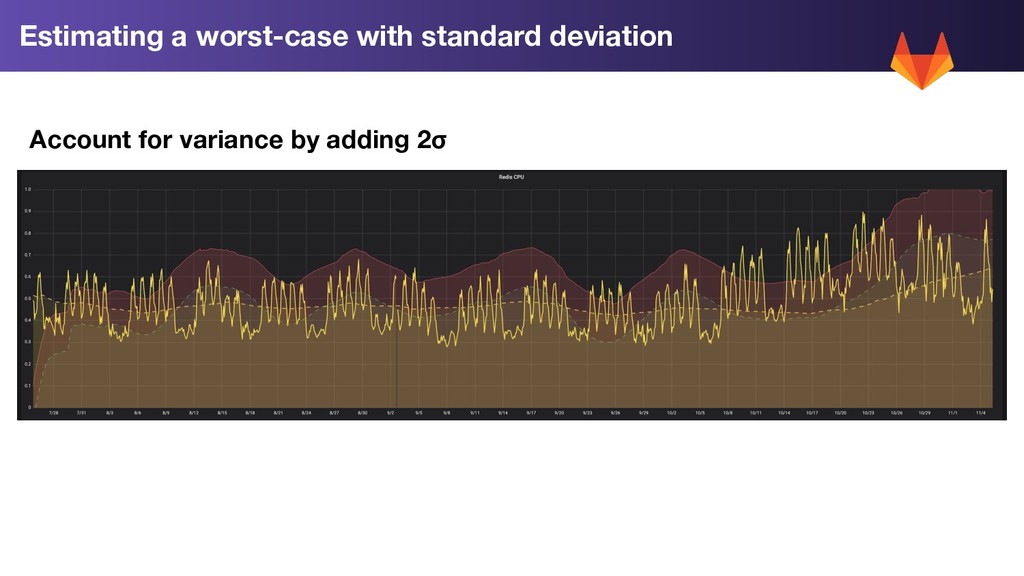
Calculation: 1. Trend Forecast: Use linear prediction on our rolling 7 day average to extend the trend forward by 2 weeks 2. Standard Deviation (σ): Calculate the standard deviation for each metric for the past week 3. Worst Case: 2w Trend Prediction + 2σ
over a week - record: service_component:saturation:ratio:avg_over_time_1w expr: > avg_over_time(service_component:saturation:ratio[1w]) # Stddev for each resource saturation component, over a week - record: service_component:saturation:ratio:stddev_over_time_1w expr: > stddev_over_time(service_component:saturation:ratio[1w])
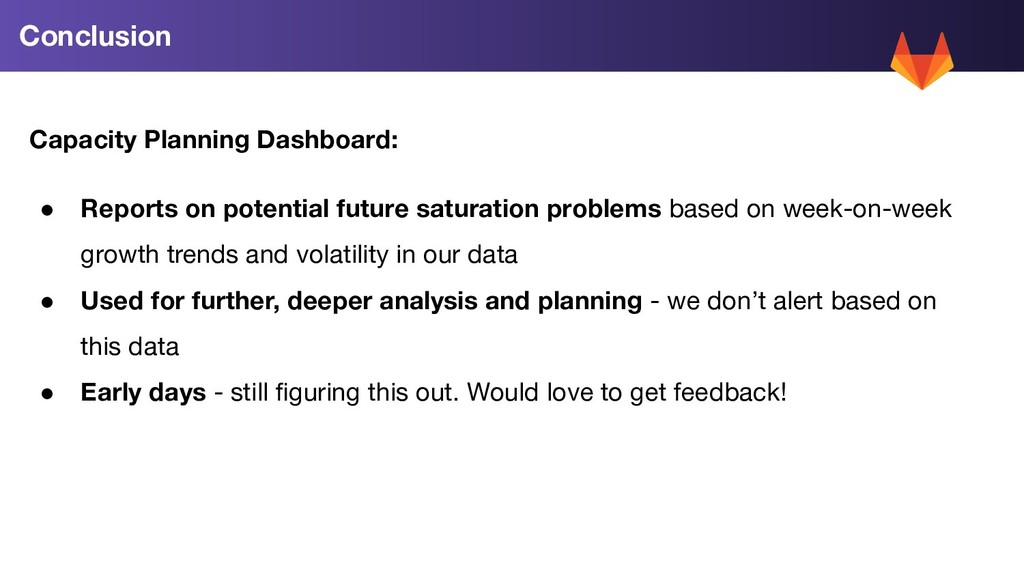
problems based on week-on-week growth trends and volatility in our data • Used for further, deeper analysis and planning - we don’t alert based on this data • Early days - still figuring this out. Would love to get feedback!
![- record: service_component:saturation:ratio:predict_linear_2w expr: > predict_linear( service_component:saturation:ratio:avg_over_time_1w[1w], 86400 * 14](https://files.speakerdeck.com/presentations/f7a18cf2119c4152ae551d61f4a72b8a/slide_33.jpg)