A short tour of data visualization in Python.
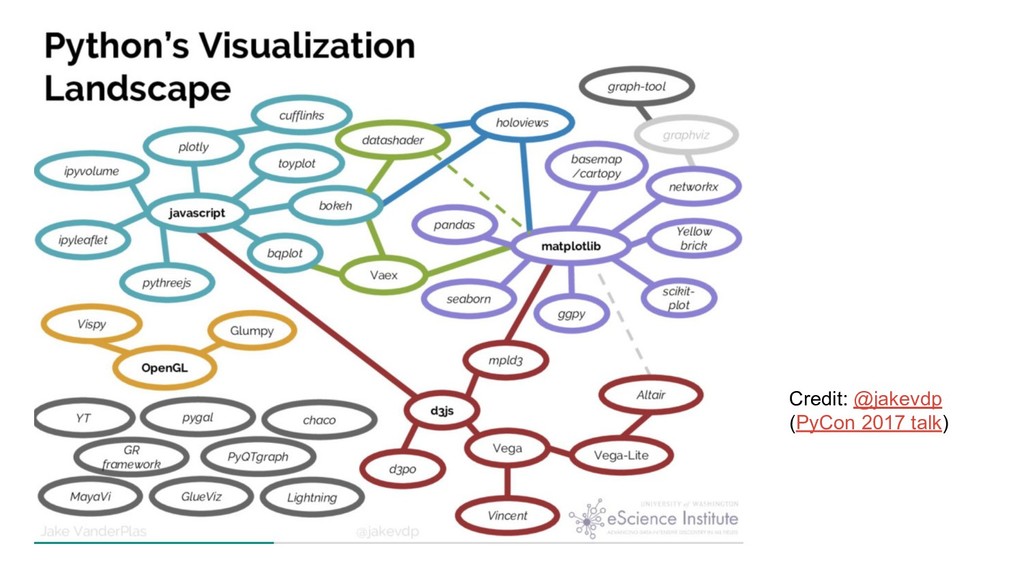
Something of a companion talk to @jakevdp's survey - in this talk I drill down and give details on three popular Python plotting ecosystems.
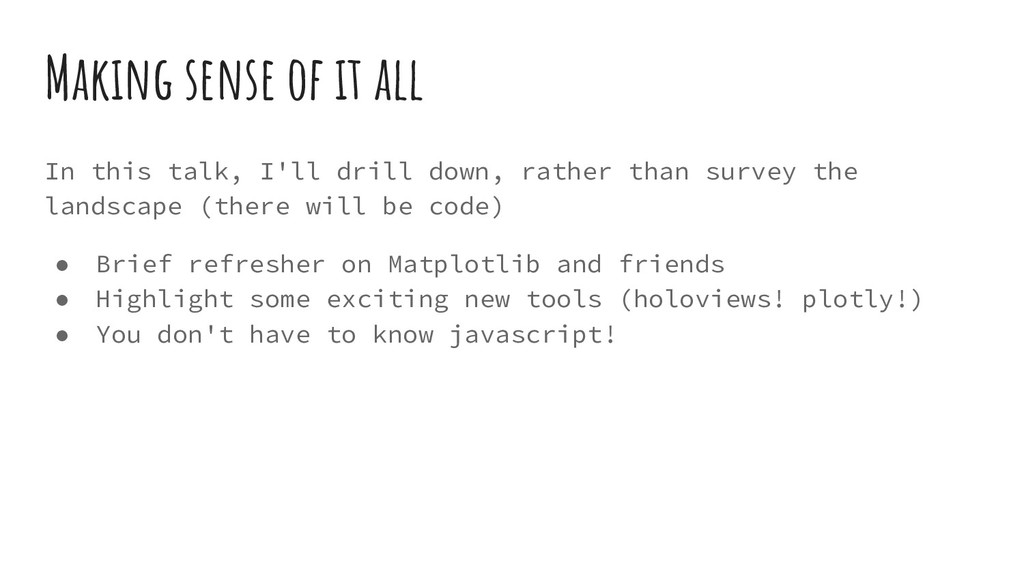
down, rather than survey the landscape (there will be code) • Brief refresher on Matplotlib and friends • Highlight some exciting new tools (holoviews! plotly!) • You don't have to know javascript!
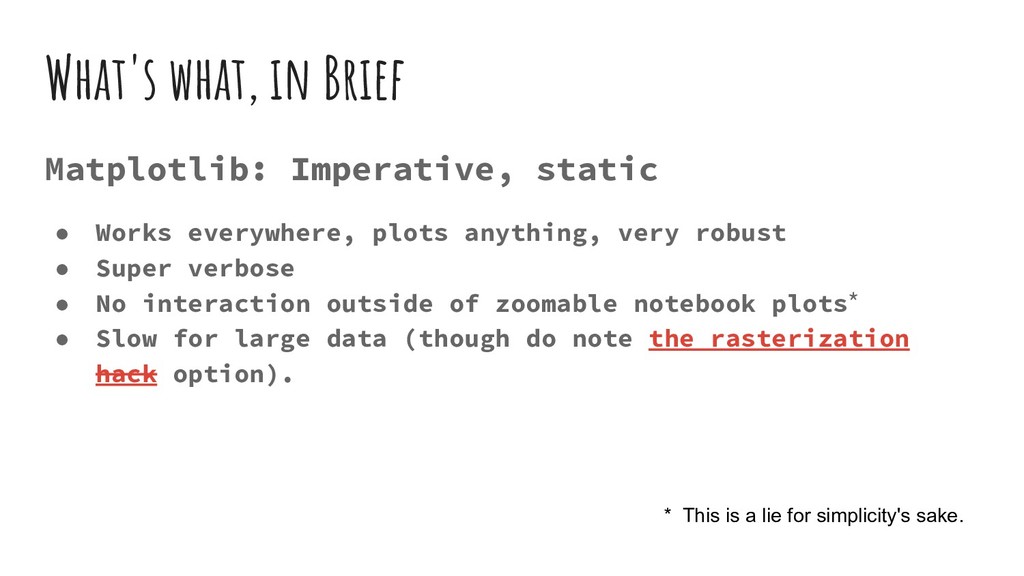
plots anything, very robust • Super verbose • No interaction outside of zoomable notebook plots* • Slow for large data (though do note the rasterization hack option). * This is a lie for simplicity's sake.
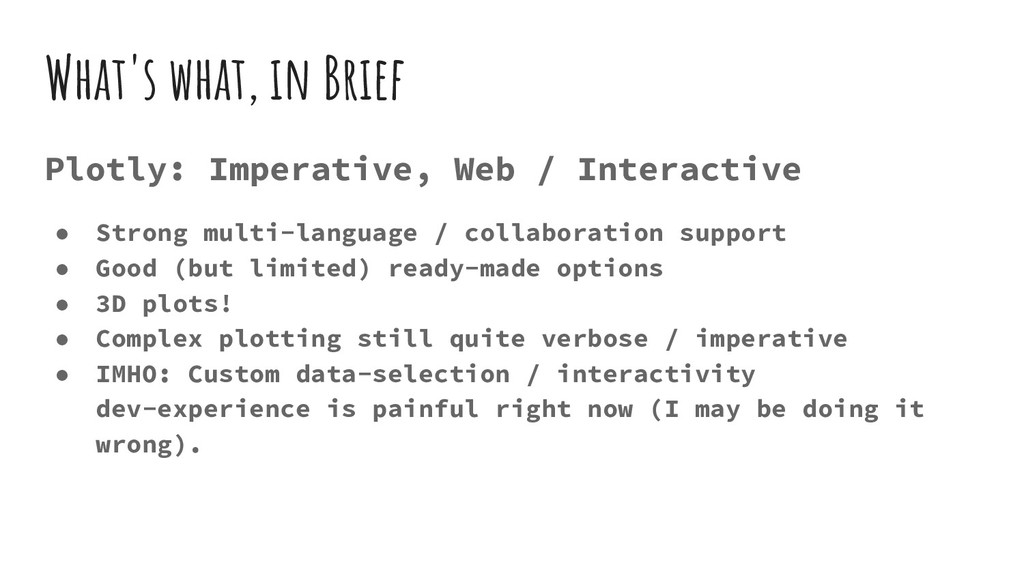
Strong multi-language / collaboration support • Good (but limited) ready-made options • 3D plots! • Complex plotting still quite verbose / imperative • IMHO: Custom data-selection / interactivity dev-experience is painful right now (I may be doing it wrong).
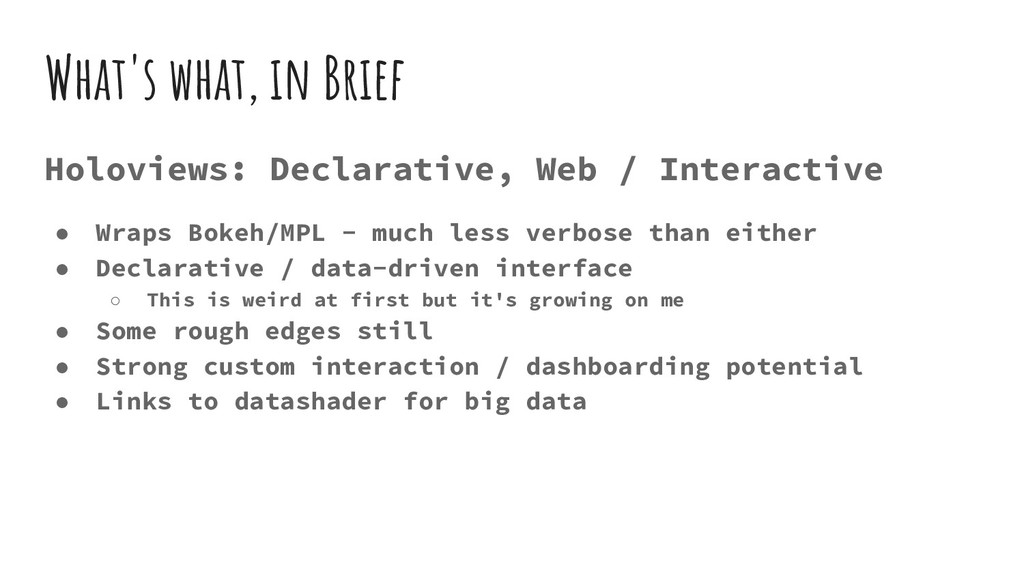
less verbose than either • Declarative / data-driven interface ◦ This is weird at first but it's growing on me • Some rough edges still • Strong custom interaction / dashboarding potential • Links to datashader for big data What's what, in Brief


 tanahiro2010
 texmeijin
 kenjiyoneyama
 prota
 kmars0605
 iwatsukayura
 mixplace
 drumath2237
 yukiny
 ivargrimstad
 lef237
 bkeepers
 malarkey
 katarinadahlin
 danielanewman
 kristinabergwall1
 cassininazir
 baasie
 nikkihalliwell
 sabderemane
 codingconduct
 auna