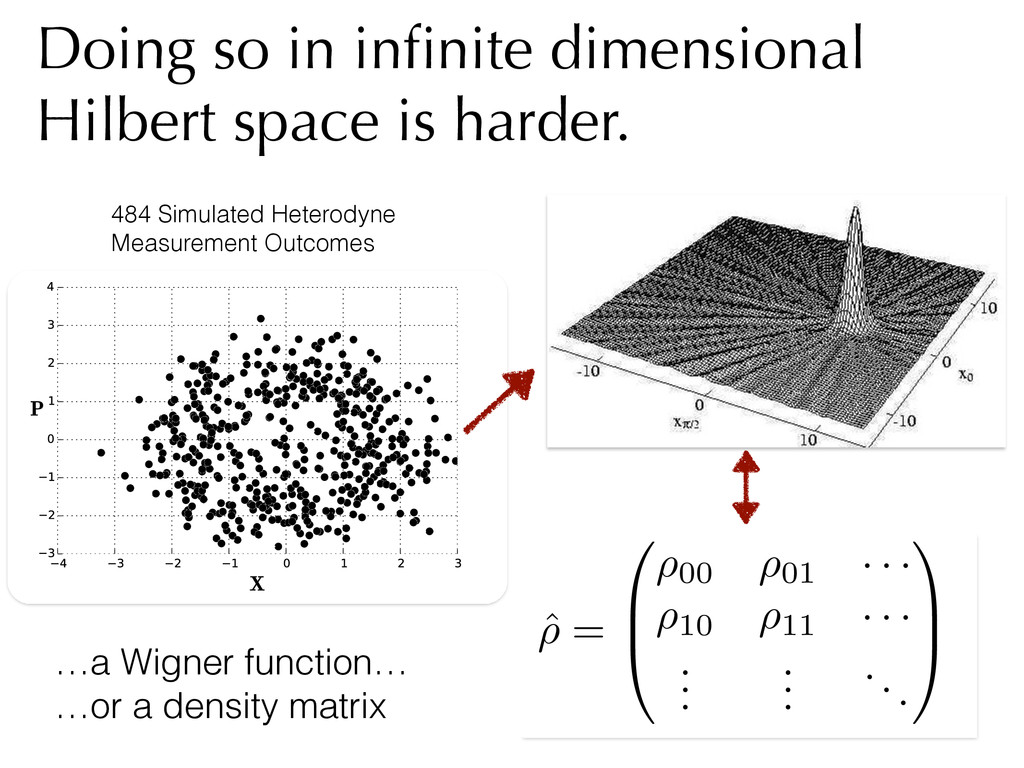
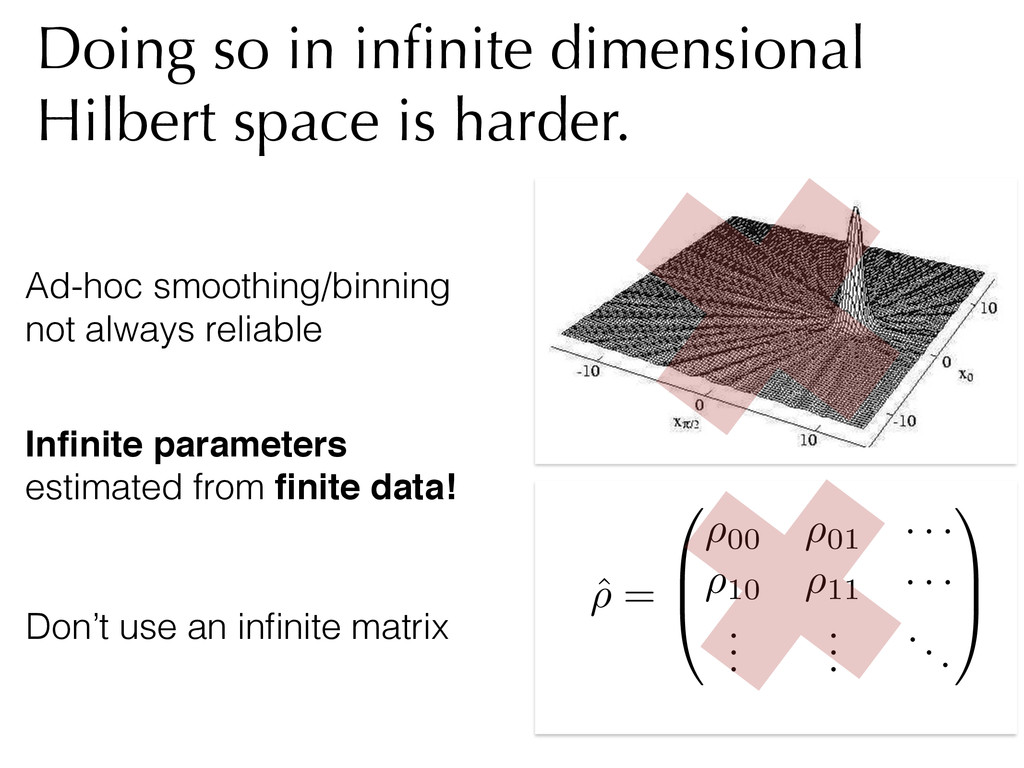
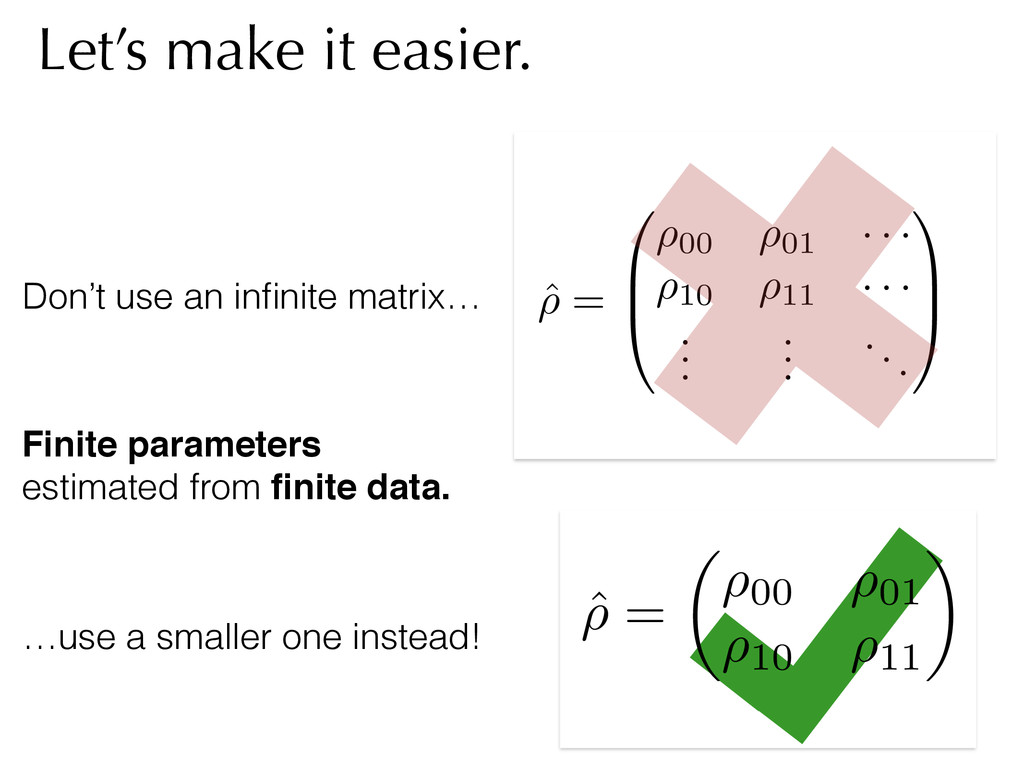
Dimension Travis L Scholten APS March Meeting 5 March 2015 Tomography is hard Sandia National Laboratories is a multi-program laboratory managed and operated by Sandia Corporation, a wholly owned subsidiary of Lockheed Martin Corporation, for the U.S. Department of Energy’s National Nuclear Security Administration under contract DE-AC04-94AL85000. Let’s make it easier… Doing so in infinite dimensional Hilbert space is harder
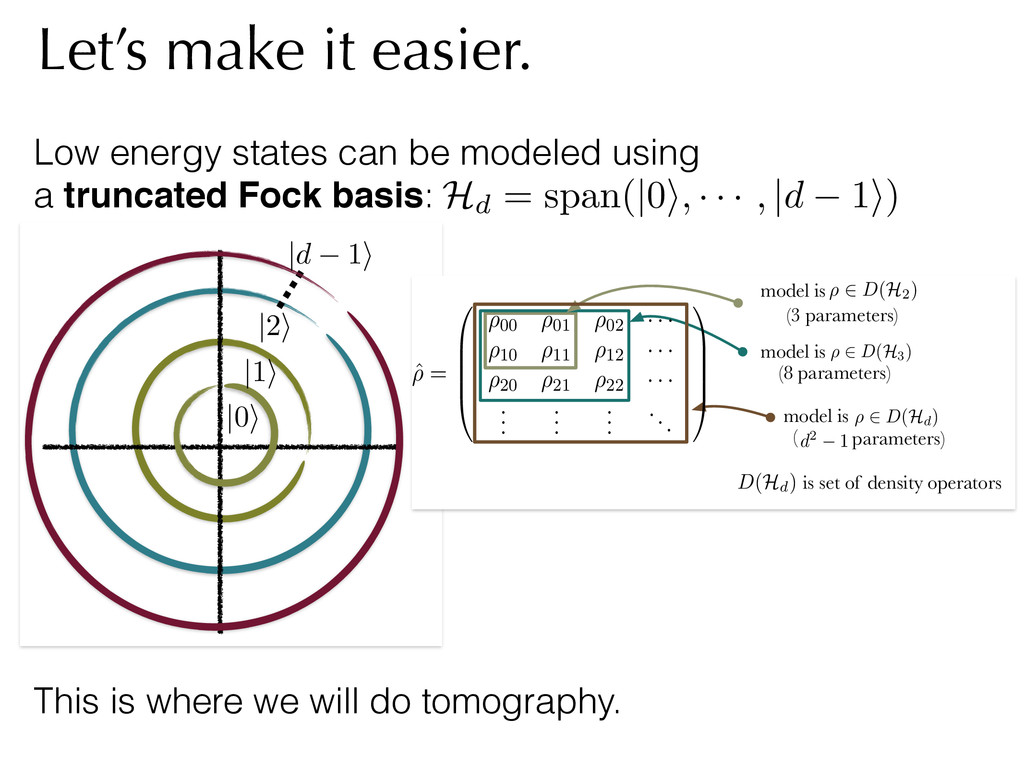
tomography. ⇢ 2 D(H2) model is (3 parameters) ⇢ 2 D(H3) model is (8 parameters) ⇢ 2 D(Hd) model is d2 1 parameters) ( D(Hd) is set of density operators ˆ ⇢ = 0 B B B @ ⇢00 ⇢01 ⇢02 · ·· ⇢10 ⇢11 ⇢12 · ·· ⇢20 ⇢21 ⇢22 · ·· . . . . . . . . . ... 1 C C C A |0i |1i |2i Low energy states can be modeled using a truncated Fock basis: Hd = span(|0i, · · · , |d 1i) |d 1i
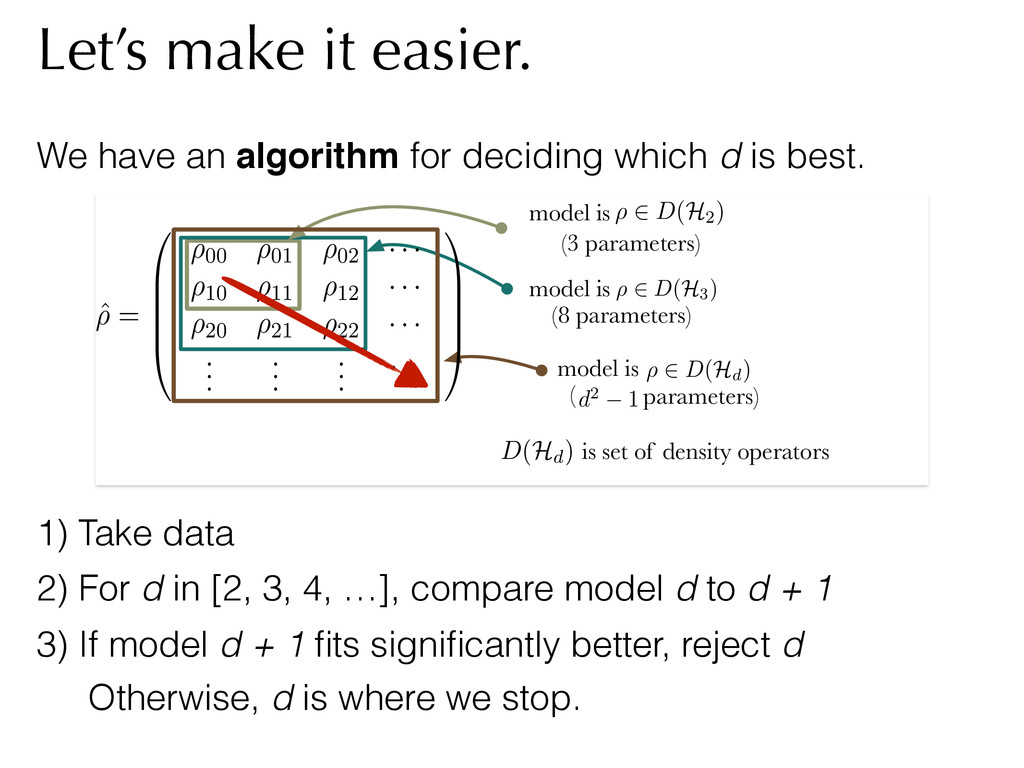
which d is best. ⇢ 2 D(H2) model is (3 parameters) ⇢ 2 D(H3) model is (8 parameters) ⇢ 2 D(Hd) model is d2 1 parameters) ( D(Hd) is set of density operators ˆ ⇢ = 0 B B B @ ⇢00 ⇢01 ⇢02 · ·· ⇢10 ⇢11 ⇢12 · ·· ⇢20 ⇢21 ⇢22 · ·· . . . . . . . . . ... 1 C C C A 1) Take data 2) For d in [2, 3, 4, …], compare model d to d + 1 3) If model d + 1 fits significantly better, reject d Otherwise, d is where we stop.
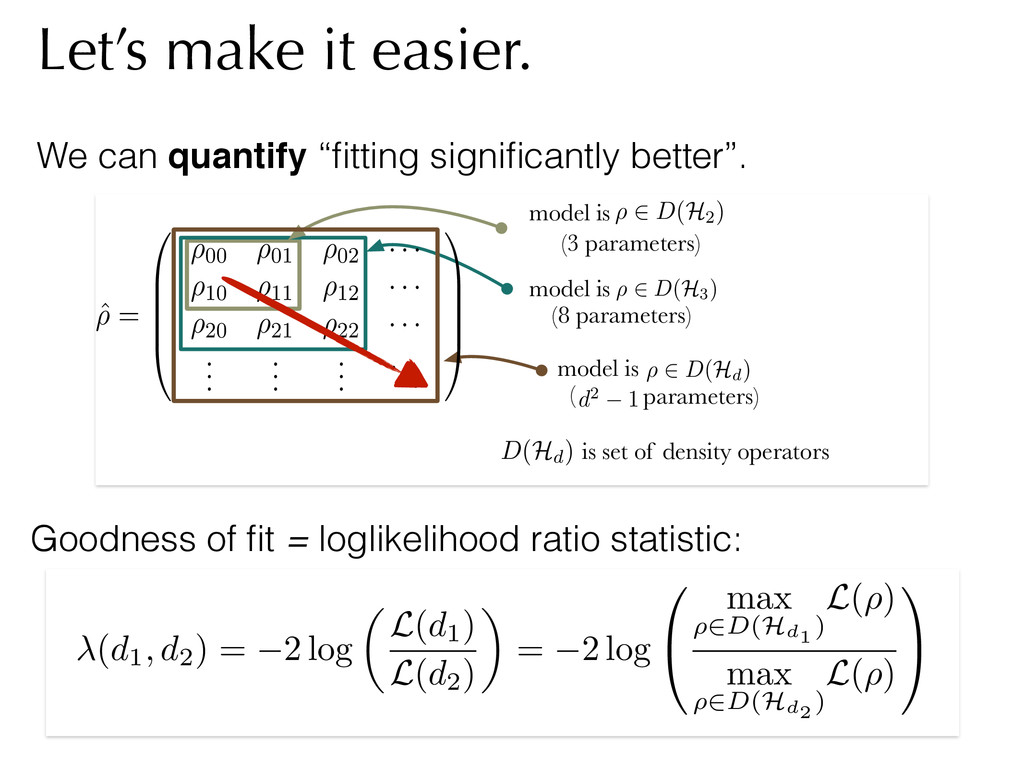
( d1, d2) = 2 log ✓ L ( d1) L ( d2) ◆ = 2 log 0 @ max ⇢2D(Hd1 ) L ( ⇢ ) max ⇢2D(Hd2 ) L ( ⇢ ) 1 A Goodness of fit = loglikelihood ratio statistic: ⇢ 2 D(H2) model is (3 parameters) ⇢ 2 D(H3) model is (8 parameters) ⇢ 2 D(Hd) model is d2 1 parameters) ( D(Hd) is set of density operators ˆ ⇢ = 0 B B B @ ⇢00 ⇢01 ⇢02 · ·· ⇢10 ⇢11 ⇢12 · ·· ⇢20 ⇢21 ⇢22 · ·· . . . . . . . . . ... 1 C C C A
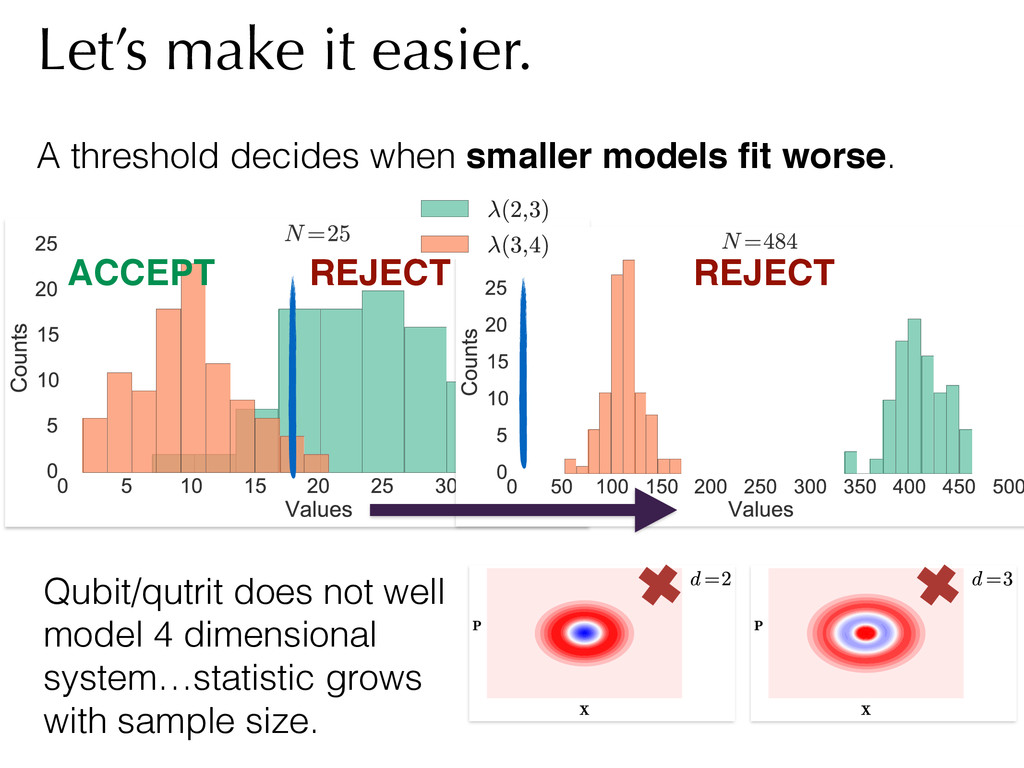
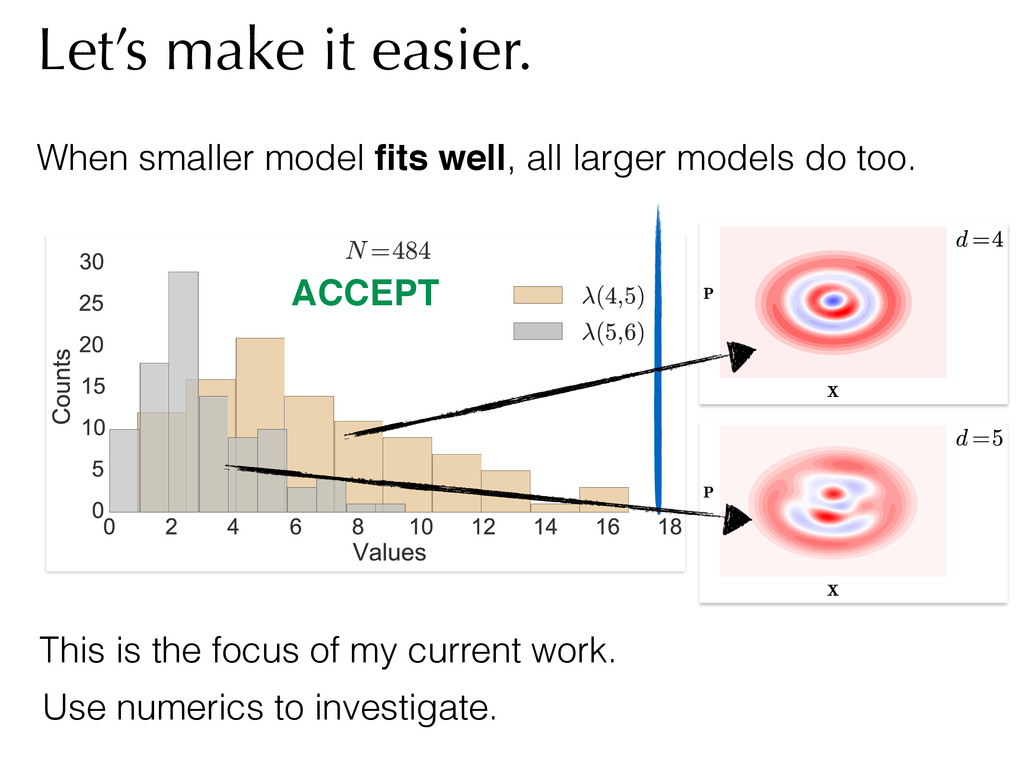
better”. ( d1, d2) = 2 log ✓ L ( d1) L ( d2) ◆ = 2 log 0 @ max ⇢2D(Hd1 ) L ( ⇢ ) max ⇢2D(Hd2 ) L ( ⇢ ) 1 A 1) Take data 2) Compute 3) If Otherwise, d is where we stop. (d, d + 1) for d in [2, 3, 4, …] (d, d + 1) greater than threshold, reject d