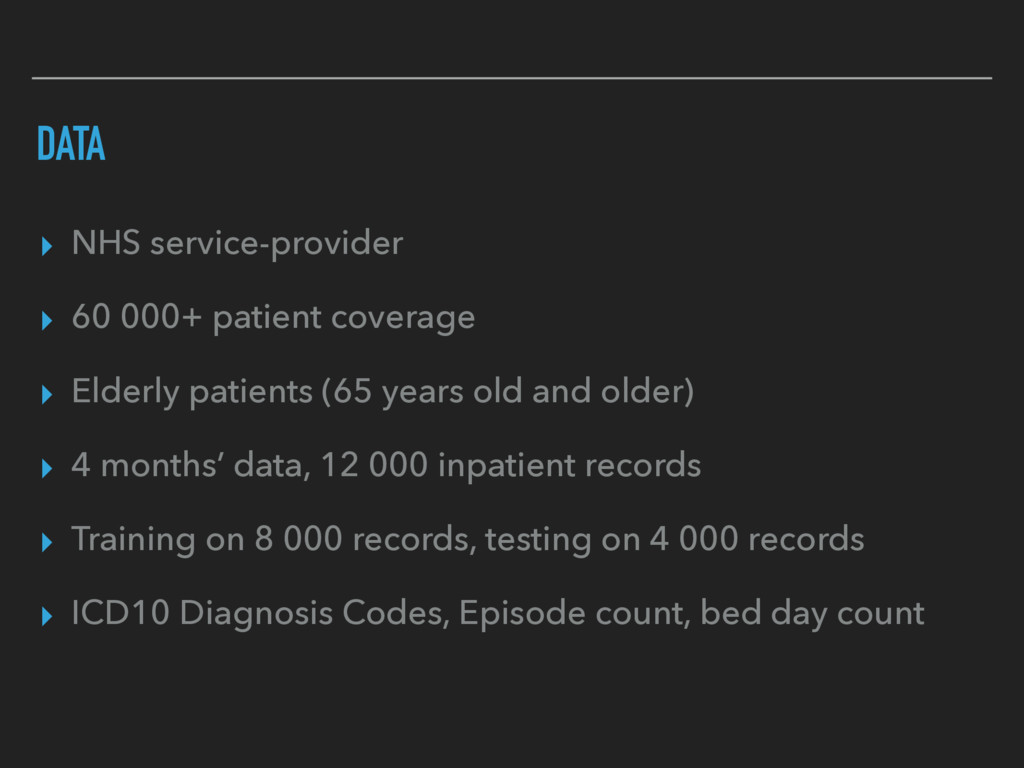
Elderly patients (65 years old and older) ▸ 4 months’ data, 12 000 inpatient records ▸ Training on 8 000 records, testing on 4 000 records ▸ ICD10 Diagnosis Codes, Episode count, bed day count
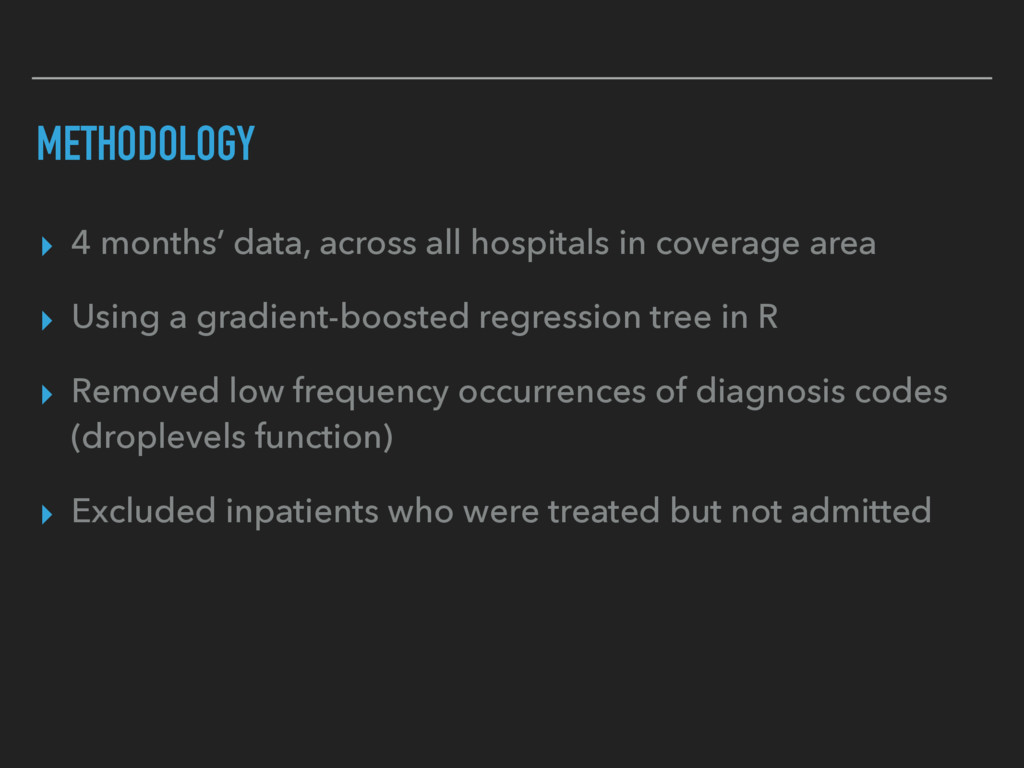
area ▸ Using a gradient-boosted regression tree in R ▸ Removed low frequency occurrences of diagnosis codes (droplevels function) ▸ Excluded inpatients who were treated but not admitted
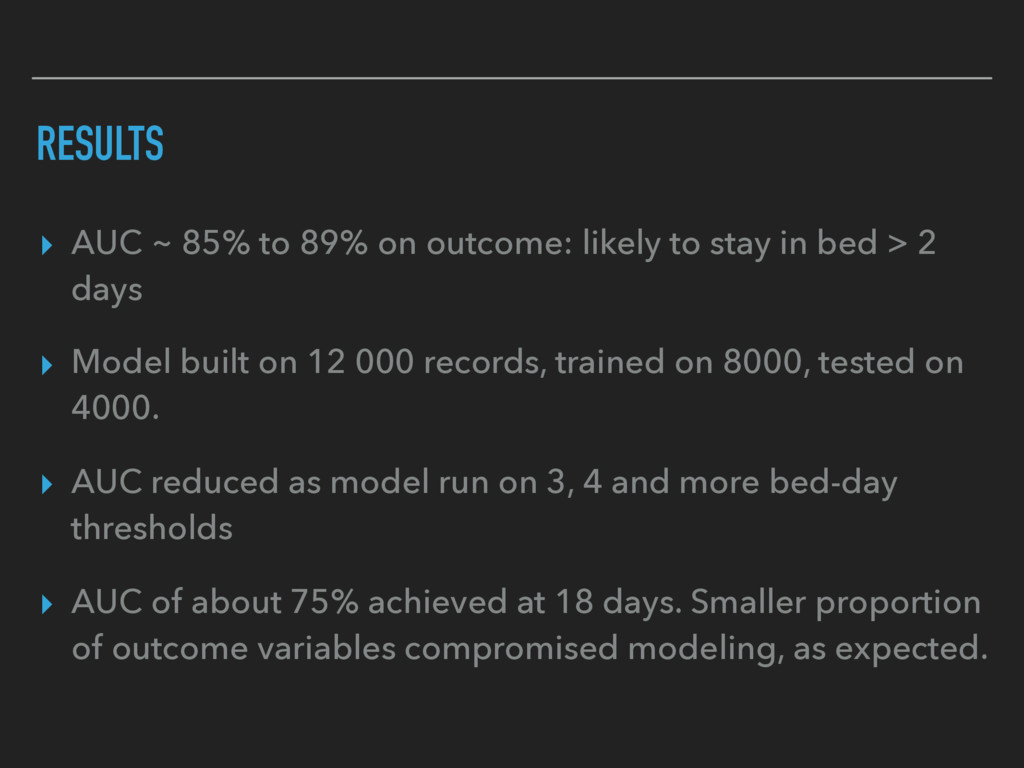
to stay in bed > 2 days ▸ Model built on 12 000 records, trained on 8000, tested on 4000. ▸ AUC reduced as model run on 3, 4 and more bed-day thresholds ▸ AUC of about 75% achieved at 18 days. Smaller proportion of outcome variables compromised modeling, as expected.
bed because they died? ▸ There’s an odd twist in the data: in between recovering enough to go home or dying, the survivors are the ones we are identifying. ▸ What are the operational procedures we can implement to decrease stays in bed?