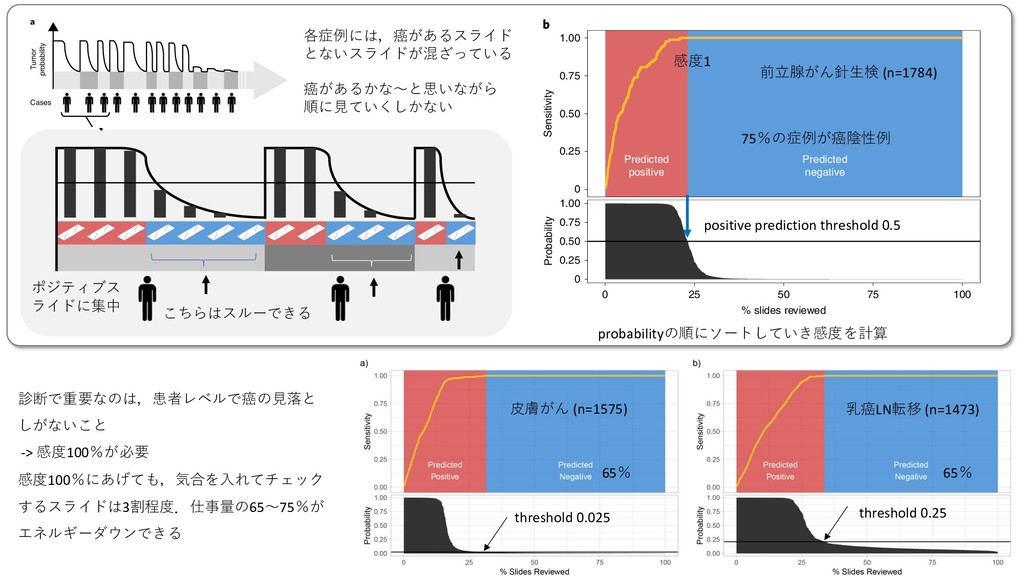
and breast metastases) that our prostate model would allow the removal of more than 75% of the slides from the workload of a pathologist without any loss in sensitivity at the patient level. For pathologists who must operate in the increasingly complex, detailed and data-driven environment of cancer diagnostics, tools such as this will allow non-subspecialized pathologists to confidently and efficiently classify cancer with 100% sensitivity. Online content Any methods, additional references, Nature Research reporting summaries, source data, statements of code and data availability and associated accession codes are available at https://doi.org/10.1038/ s41591-019-0508-1. Received: 23 October 2018; Accepted: 3 June 2019; Published: xx xx xxxx References 1. Ball, C. S. The early history of the compound microscope. Bios 37, 51–60 (1966). 2. Hajdu, S. I. Microscopic contributions of pioneer pathologists. Ann. Clin. Lab. Sci. 41, 201–206 (2011). 3. Fuchs, T. J., Wild, P. J., Moch, H. & Buhmann, J. M. Computational pathology analysis of tissue microarrays predicts survival of renal clear cell carcinoma 13. Liu, Y. et al. Detecting cancer metastases on gigapixel pathology images. Preprint at https://arxiv.org/abs/1703.02442 (2017). 14. Das, K., Karri, S. P. K., Guha Roy, A, Chatterjee, J. & Sheet, D. Classifying histopathology whole-slides using fusion of decisions from deep convolutional network on a collection of random multi-views at multi- magnification. In 2017 IEEE 14th International Symposium on Biomedical Imaging 1024–1027 (IEEE, 2017). 15. Valkonen, M. et al. Metastasis detection from whole slide images using local features and random forests. Cytom. Part A 91, 555–565 (2017). 16. Bejnordi, B. E. et al. Using deep convolutional neural networks to identify and classify tumor-associated stroma in diagnostic breast biopsies. Mod. Pathol. 31, 1502–1512 (2018). 17. Mobadersany, P. et al. Predicting cancer outcomes from histology and genomics using convolutional networks. Proc. Natl Acad. Sci. USA 115, E2970–E2979 (2018). 18. Wang, D., Khosla, A., Gargeya, R., Irshad, H. & Beck, A. H. Deep learning for identifying metastatic breast cancer. Preprint at https://arxiv.org/ abs/1606.05718 (2016). 19. Janowczyk, A. & Madabhushi, A. Deep learning for digital pathology image analysis: a comprehensive tutorial with selected use cases. J. Pathol. Inform. 7, 29 (2016). 20. Litjens, G. et al. Deep learning as a tool for increased accuracy and efficiency of histopathological diagnosis. Sci. Rep. 6, 26286 (2016). 21. Coudray, N. et al. Classification and mutation prediction from non-small cell lung cancer histopathology images using deep learning. Nat. Med. 24, 1559–1567 (2018). 22. Olsen, T. et al. Diagnostic performance of deep learning algorithms applied to three common diagnoses in dermatopathology. J. Pathol. Inform. 9, 32 (2018). 23. Ehteshami Bejnordi, B. et al. Diagnostic assessment of deep learning Predicted positive Predicted negative 0 0.25 0.50 0.75 1.00 0 0.25 0.50 0.75 1.00 0 25 50 75 100 % slides reviewed Sensitivity Probability Tumor probability Cases a b Fig. 6 | Impact of the proposed decision support system on clinical practice. a, By ordering the cases, and slides within each case, based on their tumor probability, pathologists can focus their attention on slides that are probably positive for cancer. b, Following the algorithm’s prediction would allow pathologists to potentially ignore more than 75% of the slides while retaining 100% sensitivity for prostate cancer at the case level (n=1,784). 各症例には,癌があるスライド とないスライドが混ざっている 癌があるかな〜と思いながら 順に⾒ていくしかない ig. 6 (see Extended Data Fig. 6 for BCC and breast metastases) our prostate model would allow the removal of more than 75% he slides from the workload of a pathologist without any loss in 13. Liu, Y. et al. Detecting cancer metastases on gig Preprint at https://arxiv.org/abs/1703.02442 (20 14. Das, K., Karri, S. P. K., Guha Roy, A, Chatterjee histopathology whole-slides using fusion of dec Predicted positive Predi nega 0 0.25 0.50 0 0.25 0.50 0.75 1.00 0 25 50 % slides reviewed Sensitivi Probability s 6 | Impact of the proposed decision support system on clinical practice. a, By ordering the cases, and slides within each c ability, pathologists can focus their attention on slides that are probably positive for cancer. b, Following the algorithm’s pr ologists to potentially ignore more than 75% of the slides while retaining 100% sensitivity for prostate cancer at the case l こちらはスルーできる ポジティブス ライドに集中 ARTICLES NATURE MEDICINE ⽪膚がん (n=1575) threshold 0.025 乳癌LN転移 (n=1473) 65% 65% threshold 0.25 診断で重要なのは,患者レベルで癌の⾒落と しがないこと -> 感度100%が必要 感度100%にあげても,気合を⼊れてチェック するスライドは3割程度.仕事量の65〜75%が エネルギーダウンできる in Fig. 6 (see Extended Data Fig. 6 for BCC and breast metastases) that our prostate model would allow the removal of more than 75% of the slides from the workload of a pathologist without any loss in sensitivity at the patient level. For pathologists who must operate in the increasingly complex, detailed and data-driven environment of cancer diagnostics, tools such as this will allow non-subspecialized pathologists to confidently and efficiently classify cancer with 100% sensitivity. Online content 13. Liu, Y. et al. Detecting cancer metastases on gigapixel pathology images. Preprint at https://arxiv.org/abs/1703.02442 (2017). 14. Das, K., Karri, S. P. K., Guha Roy, A, Chatterjee, J. & Sheet, D. Classifying histopathology whole-slides using fusion of decisions from deep convolutional network on a collection of random multi-views at multi- magnification. In 2017 IEEE 14th International Symposium on Biomedical Imaging 1024–1027 (IEEE, 2017). 15. Valkonen, M. et al. Metastasis detection from whole slide images using local features and random forests. Cytom. Part A 91, 555–565 (2017). 16. Bejnordi, B. E. et al. Using deep convolutional neural networks to identify and classify tumor-associated stroma in diagnostic breast biopsies. Mod. Pathol. 31, 1502–1512 (2018). Predicted positive Predicted negative 0 0.25 0.50 0.75 1.00 0 0.25 0.50 0.75 1.00 0 25 50 75 100 % slides reviewed Sensitivity Probability Tumor probability Cases a b Fig. 6 | Impact of the proposed decision support system on clinical practice. a, By ordering the cases, and slides within each case, based on their tumor probability, pathologists can focus their attention on slides that are probably positive for cancer. b, Following the algorithm’s prediction would allow pathologists to potentially ignore more than 75% of the slides while retaining 100% sensitivity for prostate cancer at the case level (n=1,784). 前⽴腺がん針⽣検 (n=1784) 75%の症例が癌陰性例 感度1 positive prediction threshold 0.5 probabilityの順にソートしていき感度を計算